General Settings Window
- Accessing the General Settings Window
- General
- Update Intervals
- Chart Update Interval
- Quote Board Update Interval
- Periodically Set System Date-Time from Server
- Quote Board High/Low Timeout Time in Seconds
- Timer Management Enable
- Timer Management - Chart Calculation/Draw Time Multiplier for Interval Delay
- Timer Management - Maximum Interval Delay in Milliseconds
- Use OS Timer for Charts
- Startup
- NewInstances
- Data
- Update Intervals
- GUI
- Scroll
- Application GUI
- Custom Title Bar Name
- Auto Hide Charts Title Bar And Scrollbar
- Minimize / Restore Detached Windows With Main Window
- Bring Detached Windows to Top on Main Window Focus
- Ignore Minimized Windows When Tiling
- Destroy Chart Windows when Hidden
- Use Alternate Window Placement Method
- Status Bar Width in Characters
- Small Pixel Amount Scaling Factor
- Display Save All Option on Exit
- Disable Prompt to Save Chartbook on Chartbook Close
- Sort CW Menu by Chart Number
- Maximum Items per Column for CW Menu
- Maximum Items per Column for Study Collections Menu
- Printing
- Windows
- Charts
- Charts
- Hide Study Inputs On Charts
- Color Chart Tabs with Chart Link Number Color
- Display Chart Timeframe On Tabs When Title Bar Name Is Set To Be Used On Chart Tab
- Show Chart Number First on Chart Name
- Show On-Chart Status Messages
- Use Controlled Order Chart Updating
- Large Increase/Decrease Chart Spacing Pixels
- Interactive Scale Range Movement Adjust Direction
- Interactive Scale Range Percent Change for Full Region Move (Fractional: .1 = 10%)
- Display Fractions In Short Format
- Allow New Data In Unlocked Fill Space
- Additional Days to Add to Rollover Date for Chart and Quote Board Rollovers
- Reset Bar Size/Spacing/Scale On Symbol Change
- Reset Bar Size/Spacing/Scale On Timeframe Change
- Study Collection
- Symbol
- Chartbooks
- Charts
- Settings Windows
- Settings Windows
- Resize Settings Window on Column Count Change
- Use Single Click for Yes/No in Settings Window when not Selected
- Use Single Click for Edit Control in Settings Window when not Selected
- Use Single Click for List Box in Settings Window when not Selected
- Use Single Click For Editable List Box In Settings Window When Not Selected
- Use Single Click for Button in Settings Window when not Selected
- Use Single Click for Color Control in Settings Window when not Selected
- Select All Text in Edit Control Upon Editing
- Immediately Show Drop Down When List Setting Is Being Edited
- Show View Menu in Settings Window
- Use Mouse Scroll Wheel to Select Settings in Settings Window
- Select String Matching Method in Search
- Customizations
- Settings Windows
- Log
- Paths
- Alerts
- Alert Settings
- Alert Number
- Number of Times to Play This Alert
- Run Program When This Alert Triggered
- Text to Play When This Alert Triggered
- Send Alert as Chat Message When This Alert is Triggered
- Chat Identifier for Alert
- Capture Chart Image on Alert for Chart
- Capture Chart Image On Trade Order Event
- Include Alert Comment in Alert Chat Message/Popup
- Add Alert to Compact Alert Popup Window
- Sound File
- User Defined Name
- Notification
- Additional Settings
- Remote Alerts
- Other Alerts
- Text to Speech Wave File Creation
- Alert Settings
- Additional Alert Information
- Configuring Alert Number Instructions
- Alerts During Back Testing
- Playing Alert Sound Multiple Times
- Text-To-Speech Alerts
- Sampling/Testing Sound Files
- Default Sound
- Time Delay Between Sounds
- Clearing the Alert Sound Queue
- Troubleshooting for Alert Sounds That Do Not Play
- Playing an Alert Sound Repeatedly Until Manually Stopped
- Using Chat For Remote Alert Notifications and Connecting to Telegram (Opens a new page)
Accessing the General Settings Window
To display the General Settings window select Global Settings >> General Settings on the menu.
Press OK to save settings or Cancel to exit without saving.
General
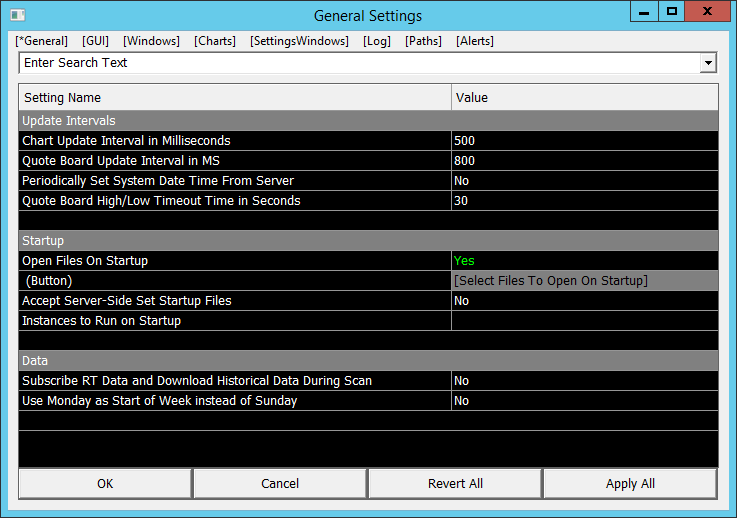
Update Intervals (Global Settings >> General Settings >> General)
This sub-section contains global settings related to update intervals for various parts of the Sierra Chart software.
Chart Update Interval (Global Settings >> General Settings >> General >> Update Intervals)
The Chart Update Interval sets how often the chart graphics are updated and studies are calculated when connected to the Data/Trade server. When market data, Trade Order data or Trade Position data is received, it will be displayed within this time interval.
If there is no new market data, Trade Order or Position data, then the chart will not be updated.
Enter the value in milliseconds. Using a higher value will reduce CPU usage. However, the chart will update slower. Using a lower value will increase CPU usage. However, the chart will update faster. This setting does not affect the speed at which data is stored, it is stored tick by tick without any gaps. All trades received are displayed.
The Chart Update Interval provides for very efficient use of the CPU, and prevents lags. Using a very short update interval may require a fast CPU.
Using too short of an update interval, like 50 milliseconds or less on a large number of charts, may have the effect of causing a lag of data received because the load that Sierra Chart will present to the CPU may be too high preventing network data from being process timely.
You will know if the Chart Update Interval setting is too fast if the CPU usage of Sierra Chart, as reported in the system Task Manager, is near to the limit of a single core. For example, if your system has 8 cores, the maximum core percentage will be 12.5 percent as reported in the Task Manager. If you see the Sierra Chart process at the maximum or higher percentage for a single core, then it is presenting the maximum load to the CPU. Although Sierra Chart does use multiple threads, so you can see at certain times, a percentage which is higher than what a single core will use. Most of the time this will not be the case though.
If you encounter any problems with a short Chart Update Interval, increase it. Do not contact support about issues arising from too short of a Chart Update Interval.
At each Chart update, in the case of an Intraday chart, Sierra Chart will read the latest data from the Intraday chart data file and perform other functions even if there is not any new market data to read. Therefore, using too short of a Chart Update Interval, does increase the CPU load.
Each individual chart can also override the global Chart Update Interval and use its own chart update interval. So this gives you the ability to set some charts to a faster or slower speed than the global setting. Refer to Chart Update Interval in the Chart Settings documentation.
While Sierra Chart is a fast and responsive program, it was not designed with high-frequency trading in mind where one would require response times in the microsecond range or very low millisecond range. The Chart Update Interval can be reduced as low as 10 milliseconds. However, if you require study calculations to be done at intervals faster than that and have reaction times from an automated trading system to be less than that, and in the microsecond range, then instead you would need to develop your trading system external to Sierra Chart and communicate with Sierra Chart using the DTC Protocol Server.
Since charts are updated at the specified Chart Update Interval, there can be momentary differences with price values between charts of the same symbol, at any instant in time. This becomes less noticeable, the faster the chart update interval.
Quote Board Update Interval (Global Settings >> General Settings >> General >> Update Intervals)
The Quote Board Update Interval specifies how often and milliseconds the data on a Quote Board updates if it has changed.
A recommended setting is between 500 to 1000 milliseconds.
This setting also applies to Study Summary Windows and Quote Spreadsheets. In the case of a Quote Spreadsheet, you need to close and reopen it for the new Update Interval to go into effect.
Periodically Set System Date-Time from Server (Global Settings >> General Settings >> General >> Update Intervals)
When this option is enabled, then every hour the current Date-Time in UTC is requested from the Sierra Chart Web server and your computer's clock is adjusted to this time.
For complete details about this functionality, refer to Global Settings >> Set System Date-Time from Server.
Quote Board High/Low Timeout Time in Seconds (Global Settings >> General Settings >> General >> Update Intervals)
The Quote Board High/Low Timeout Time in Seconds setting specifies the amount of time in seconds the High or Low Quote Board fields remain highlighted for when there is a new High or Low respectively.
For information about setting the highlighting color, refer to Setting Colors (Quote Board).
Timer Management Enable (Global Settings >> General Settings >> General >> Update Intervals)
The following information applies to version 2719 and higher.
This setting defines whether the following two settings for Timer Management - Chart Calculation/Draw Time Multiplier for Interval Delay and Timer Management - Maximum Interval Delay in Milliseconds are used to affect the Sierra Chart timers. If this option is set to Yes and the setting for Use OS Timer for Charts is set to No, the the Timer Management settings will affect the timers as defined below.
Otherwise, if this option is set to No then the Timer Management settings will have no impact on the Sierra Chart timers and the default settings for these timers is used.
Timer Management - Chart Calculation/Draw Time Multiplier for Interval Delay (Global Settings >> General Settings >> General >> Update Intervals)
The following information applies to version 2716 and higher.
This setting is for charts only. It does not apply to any other timer functionality in Sierra Chart.
A chart is updated according to its Chart Update Interval. For complete details, refer to Chart Update Interval.
A Chart Update Interval for a chart is the time interval in milliseconds, that a chart will be updated at. For example, if it is set to 500 ms for a particular chart or globally, then a chart will update every 500 ms assuming there is market activity. Or some other event which will cause a chart to update. However, if there are many charts open, and each chart takes 50 ms to calculate and draw, then this makes less time available for other charts to update and they will update less frequently.
In order to maintain a responsive user interface, Sierra Chart will dynamically increase the Chart Update Interval. This occurs dynamically based upon the calculation and draw time of the chart. Sierra Chart will not increase it higher than the Timer Management - Maximum Interval Delay in Milliseconds setting.
The formula that Sierra Chart uses to increase the Chart Update Interval is that the time to calculate and draw chart during a chart update is measured. This time is multiplied by the Timer Management - Chart Calculation/Draw Time Multiplier for Interval Delay setting (default is 3). So for example if a chart takes 60 ms to calculate and draw and this setting is 3, then the Chart Update Interval becomes 180 ms. This update interval continuously changes based upon the calculation and draw time of the chart.
Additionally, Sierra Chart will ensure between chart updates, that there is a duration of the Chart Update Interval. In this example, there will be a 180 ms between each chart update.
This setting can be set anywhere from .5 to 100. It can be a fractional value like 1.2.
Timer Management - Maximum Interval Delay in Milliseconds (Global Settings >> General Settings >> General >> Update Intervals)
This setting is for charts only. It does not apply to any other timer functionality in Sierra Chart.
This is the maximum time in milliseconds that Sierra Chart will dynamically increase the Chart Update Interval for a particular chart to.
Use OS Timer for Charts (Global Settings >> General Settings >> General >> Update Intervals)
When this option is set to Yes then the Operating System timers are used for charts instead of the Sierra Chart timers. This also means that the Timer Management settings above do not have any influence on the timers being used.
In order to use the Sierra Chart timers and to be able to modify the Timer Management settings for them, this option must first be set to No.
There are advantages and disadvantages, with using Sierra Chart timers versus Operating System timers. For more information, refer to Using Sierra Chart Timers for Faster Updates.
Startup (Global Settings >> General Settings >> General)
This sub-section contains global settings related to functionality that occurs at the startup of the Sierra Chart software.
Open Files On Startup (Global Settings >> General Settings >> General >> Startup)
When this option is set to Yes, then the files in the Files to Open on Startup list will automatically be opened when Sierra Chart is started. When this option is set to No, this will not occur.
This setting is also on the Sierra Chart login window and can be turned on or off from that window. When a change is made on the Login window, then that change will be reflected in this setting.
Temporarily Preventing Automatic Opening of Files on Startup
To prevent the automatic opening of files, Chartbooks and Spreadsheets, in the list of Files to Open on Startup in Global Settings >> General Settings, when Sierra Chart is started, then disable the Files to Open on Startup option on the General Settings window.
Alternatively, when Sierra Chart is started, on the Login window disable the Open Files on Startup option. This will prevent Chartbooks and other files from automatically being opened upon startup.
The Files to Open on Startup will not automatically open on startup of Sierra Chart if Open Files on Startup is disabled on the Login window.
Select Files to Open On Startup (Global Settings >> General Settings >> General >> Startup)
This setting allows you to create a list of files to automatically open when you start Sierra Chart. These files can include Chartbook and Spreadsheet files (.scss file extension). These are the only files you can automatically open.
Selecting the button for Files to Open on Startup will bring up a window that allows the files to be added to the list.
Press the Add button to add a file to the list. The Open File window will display. Select the file you want to add and press the Open button.
To change an existing file in the list, select the file you want to change in the list and press the Change button.
To remove a file, select the file you wish to remove and press the Remove button.
You can change the order of the files to control the order in which they are opened, by using the Up Arrow and the Down Arrow buttons. The last file in the list, will be the last file opened. In the case of a Chartbook, this will become the active Chartbook file.
For information about chartbooks, refer to the Chartbooks documentation page.
If the first file to open in the list is a Spreadsheet, then a new Chartbook will be created when that Spreadsheet is automatically opened because a Chartbook is required to exist when opening a Spreadsheet file. Therefore, it is recommended to put the Spreadsheet files at the end of the list of Files to Open on Startup to avoid this.
The files will not automatically open if the Open Files on Startup option is disabled.
There is a limit in Sierra Chart to open no more than 64 Chartbooks/Spreadsheets on startup but this does not mean you cannot have more Chartbooks/Spreadsheets open than that. This just relates to what can be automatically opened at once.
Accept Server-Side Set Startup Files (Global Settings >> General Settings >> General >> Startup)
For some Sierra Chart accounts files may be automatically added to the Files to Open On Startup list. This happens when logging into Sierra Chart.
To prevent the files from being added to this list, set Accept Server-Side Set Startup Files to No.
NewInstances (Global Settings >> General Settings >> General)
.
Instances to Run on Startup (Global Settings >> General Settings >> General >> New Instances)
Sierra Chart supports running new instances with the File >> New Instance command.
For additional information, refer to Using DTC Server for Data and Trading in Another Sierra Chart Instance.
After you have manually started new instances with that command, to automatically start those instances when Sierra Chart is started, enter the instance numbers in the Instances to Open on Startup field.
This is a comma separated list of instance numbers. Example: 2, 3. This means when Sierra Chart is started, the second and third instance will be run automatically.
Use Symbol Settings in New Instances when Started (Global Settings >> General Settings >> General >> New Instances)
When this option is set to Yes, then when File >> New Instance is used to start a new instance of Sierra Chart, then the Global Symbol Settings from the main instance the new instance is started from, are copied to the new instance. The new instance then uses these Symbol Settings. This is useful to make sure the customized settings you have set in the main instance are used by all of the sub instances.
It is important to understand that when this option is enabled, you must not make changes to Symbol Settings within sub instances started with File >> New Instance. Otherwise, when those sub instances are restarted, those Symbol Settings changes or custom symbols added, will then be lost and overwritten with the main instance Symbol Settings.
Always Copy Configuration Files to New Instances When Started (Global Settings >> General Settings >> General >> New Instances)
When this option is set to Yes, then all of the global configuration files from the main instance of Sierra Chart are copied to a sub instance every time the sub instance is started with File >> New Instance.
This ensures that the Global Settings within the main instance, are always applied to the sub instance.
However, any changes to Global settings within a sub instance will be lost when it is closed and started again with File >> New Instance or is automatically run on startup.
Global configuration files do not include Chartbooks, Study Collections, Trade Window configurations or Spreadsheets.
When this option is set to No, then each individual sub instance started with File >> New Instance will have a configuration which matches the main instance, the first time that instance is created. Thereafter, any changes to that particular sub instance global settings, will remain with that instance only and be different and independent from the main instance.
Data (Global Settings >> General Settings >> General)
This sub-section contains global settings related to how data is handled.
Subscribe RT Data and Download Historical Data During Scan (Global Settings >> General Settings >> General >> Data)
When this option is set to Yes, then when scanning through symbols in a chart, historical data will be downloaded for the chart if it has not already been downloaded and real-time data updates will be started for the symbol.
Use Monday as Start of Week instead of Sunday (Global Settings >> General Settings >> General >> Data)
When this option is set to Yes, the start of the week is considered Monday instead of Sunday. Otherwise, the start of the week is considered Sunday.
This setting applies to studies which have a Time Period Type Input which is set to Weeks .
GUI (Global Settings >> General Settings)
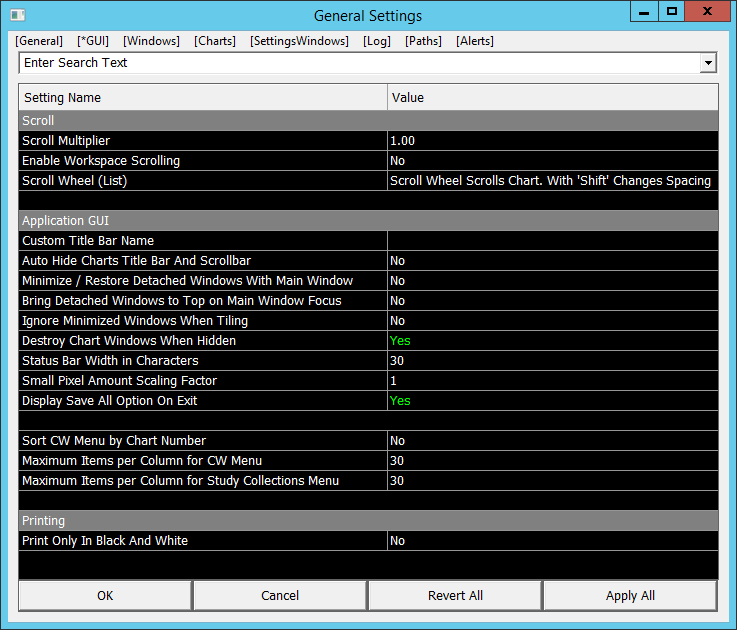
Scroll (Global Settings >> General Settings >> GUI)
This sub-section contains global settings related to scrolling.
Scroll Multiplier (Global Settings >> General Settings >> GUI >> Scroll)
The Scroll Multiplier setting sets the speed of scrolling in charts when using the chart Scrollbar at the bottom of the chart. This is not an integer value but a floating-point value and supports fractional values (Example: .75).
When it is set to 1.0 and you click on the chart Scrollbar arrows or press the left and right arrows on your keyboard, the chart will scroll by 1 bar/column.
Also, with this same setting when you you scroll the chart page-by-page by clicking within the Scrollbar area (not on the Scrollbar arrows or scroll box), the chart will scroll by one full window of bars/columns.
When this setting is set to 0.5, then the scrolling amount with any of the scrolling methods becomes reduced by half. When this setting is set to 2, then the scrolling amount with any of the scrolling methods, is doubled. Use a higher value for increased scrolling speed.
When the Scroll Multiplier is set to 1 and Sierra Chart scrolls by more than 1 bar/column when using a scroll wheel, then the issue has to do with the scroll wheel implementation on your computer system and Sierra Chart has no control over that.
Regardless of what the Scroll Multiplier is set to, if there is right side fill space in the chart which is not locked, scrolling will be at a speed of 1.
Enable Workspace Scrolling (Global Settings >> General Settings >> GUI >> Scroll)
Enables scroll bars to appear on the main Sierra Chart window when you move chart and Spreadsheet windows beyond the main window's edges.
This allows you to widen your Chartbook workspace. You can then use the scroll bars to move charts in and out of view.
You need to restart Sierra Chart when enabling or disabling this option for the change to go into effect.
Scroll Wheel Setting (Global Settings >> General Settings >> GUI >> Scroll)
The scroll wheel can be used to control the chart horizontal position and also the spacing between the chart bars. The options for how the scroll wheel can be used are as follows:
When the scroll wheel is used to scroll the chart horizontally, the Scroll Multiplier setting applies in this case.
- No Scroll Wheel Support
- Scroll Wheel Scrolls Chart. With 'Shift' Changes Spacing
- Scroll Wheel Changes Spacing. With 'Shift' Scrolls Chart
- Scroll Wheel Scrolls Vertical Scale. With 'Shift' Changes Spacing
- Scroll Wheel Scrolls Vertical Scale. With 'Shift' Scrolls Chart
- Scroll Wheel Scrolls Chart. With 'Shift' Scrolls Vertical Scale
- Scroll Wheel Changes Spacing Normal. With 'Shift' Changes Spacing at Bar: When using the Shift key on the keyboard with this option, the bar being pointed to with the Chart Values tool is maintained at the location, as best as possible, in its current location.
Application GUI (Global Settings >> General Settings >> GUI)
This sub-section contains global settings related to the Sierra Chart application Graphical User Interface (GUI).
Custom Title Bar Name (Global Settings >> General Settings >> GUI >> Application GUI)
This setting allows you to set text which is displayed on the title bar of the main program window. When there is text set, the name of the Data or Trading service will no longer be displayed on the title bar.
The text is displayed on the far left side of the title bar assuming the operating system is not centering the text. This text will also be visible with the icon on the system Taskbar to help identify a particular instance of Sierra Chart when you are running multiple instances.
The setting immediately goes into effect and updates the title bar.
It is also supported to use your own custom icon at the top left of the Sierra Chart windows and on the system taskbar. Simply place a Program.ico file with your own custom icon in the installation folder for Sierra Chart. It will be automatically used when Sierra Chart is started.
Auto Hide Charts Title Bar And Scrollbar (Global Settings >> General Settings >> GUI >> Application GUI)
The Auto Hide Charts Title Bar and Scrollbar option when enabled will automatically hide a charts title bar and scrollbar, when the chart does not have the focus and is not the active window.
This setting also affects Time and Sales windows, and Trade DOM windows.
For details on moving and resizing a window which has its title bar removed, refer to Show Title Bar on the Chart Menu page.
If this option does not work reliably, then understand it is an operating system level problem and we recommend not using it in that case. The feature is reliably implemented within Sierra Chart.
It is also supported to manually hide both the Title Bar and Scrollbar on an individual chart through the Chart menu. Refer to Show Title Bar and Show Scrollbar.
Minimize / Restore Detached Windows With Main Window (Global Settings >> General Settings >> GUI >> Application GUI)
When this option is set to Yes, then when minimizing the main Sierra Chart window, any detached Chart and Spreadsheet windows will also be minimized at the same time.
When this option is to Yes, then when maximizing or restoring the main Sierra Chart window, any detached Chart and Spreadsheet Windows will also be restored at the same time.
Bring Detached Windows to Top on Main Window Focus (Global Settings >> General Settings >> GUI >> Application GUI)
When this option is set to Yes, and there are detached charts in the visible Chartbook, then when the main window of Sierra Chart is given the focus, then these detached charts are also brought to the top of what is called the Z order and moved above other windows from other programs that they may be under.
The order in which these detached charts are brought to the top is according to the order in which they are listed in Window >> Windows and Chartbooks.
Ignore Minimized Windows When Tiling (Global Settings >> General Settings >> GUI >> Application GUI)
When this option is selected and one of the Windows Tiling options is selected (such as Windows >> Tile Horizontally), the space that is occupied by the minimized windows icons at the bottom of the graphics area is ignored, and the windows are placed over the icons.
Otherwise, when this option is not selected, the tiling of windows will take into account the space that is occupied by the minimized windows icons and will place the tiled windows so they do not cover the icons.
Destroy Chart Windows when Hidden (Global Settings >> General Settings >> GUI >> Application GUI)
When this option is set to Yes, then when a chart window is hidden because the Chartbook it is part of is no longer the visible Chartbook, the chart window will be destroyed. This conserves operating system window related resources and allows more chart windows to be open at the same time.
When this option is set to No, then when a Chartbook is not visible, and it remains open, the charts are only hidden but not destroyed.
This option must only be changed when Chartbooks are not currently open. Close all Chartbooks first before changing this option. Otherwise, it is possible when switching to a Chartbook which is currently open, that its charts will not appear, but they would still be present within the Chartbook.
The term "destroy" is an operating system term which indicates that the operating system window for the chart is being destroyed when it is hidden. This is simply means that the resources associated with it, are removed. When a chart window is made visible again like when making the Chartbook it is part of, active, then the window is re-created exactly as it was before. There is no loss of information at all.
If you have a large number of charts open for different symbols because you want to overlay them within a common single chart window, then instead consider using the Add Additional Symbol study instead of using a large number of separate charts.
Use Alternate Window Placement Method (Global Settings >> General Settings >> GUI >> Application GUI)
For the implementation of the Use Alternate Window Placement Method setting, update to version 2642 or higher. Refer to Fast Update.
This is a setting, which uses an alternative method to determine the Position and Size of a window and also to restore the Position and Size of a window. This is also known as the window placement. This applies to all windows within Sierra Chart except for windows attached within the main window. These attached windows are also called MDI child windows. This option does not apply to a MDI child window.
This setting is used to attempt to resolve the problem documented in the Window Size and Position Not Restored When Opening Chartbook help topic.
Changes to Use Alternate Window Placement Method requires a restart of Sierra Chart for the change to go into effect.
When this setting is enabled, and when a window in Sierra Chart is maximized, not an MDI child window, but the main Sierra Chart window, any detached windows, or any other top level window, the normal or restored size of that window is not going to be known. When the window is re-created by Sierra Chart, its restored/normal size will be the same as the maximized size. So when you take a window out of the maximized state and restore it, its size will not change. This only applies when this setting is enabled.
If enabling this setting does not cause Chart windows and the main Sierra Chart window to be restored in the same way they were when a Chartbook is closed or the main program is exited, on multiple monitors, then there are two other possibilities.
If you are maximizing a detached chart, on a monitor and it is not being restored to the same monitor when opening the Chartbook it is contained within, then rather than maximizing the chart on that monitor, keep it in a Restored state and adjust its top left position and size to occupy the entire size of the monitor. Do the same thing with the main Sierra Chart window. This may resolve the problem.
The issue of Chart windows and the main Sierra Chart window not being restored to the same position and size they were when saved, when they are reopened, is an operating system level problem.
Status Bar Width in Characters (Global Settings >> General Settings >> GUI >> Application GUI)
This setting controls the width of the Status Bar display on the Control Bar in characters.
After changing this setting it is necessary to disable the Control Bar through Window >> Control Bars >> Control Bar [#] and then reenable the Control Bar.
For further details, refer to Window >> Control Bars >> Control Bar [#].
Small Pixel Amount Scaling Factor (Global Settings >> General Settings >> GUI >> Application GUI)
This is a scaling factor/multiplier which is used to adjust various small widths and sizes of various display elements throughout Sierra Chart. By default this is 1. Using a larger value will cause larger widths or sizes to be used.
Using a value of 2 means that the default pixel width for a particular display element, then becomes twice the number of pixels from the default.
Some of the included items that this setting affects are as follows:
- The width of the short vertical divider line displayed on a header when hovering between columns on the header columns in adjustable multicolumn list views like the Time and Sales window.
- Default column widths for multicolumn list views. These columns are also manually adjustable.
- Spacing between columns on the Numbers Bars study.
- Minimum and Maximum padding when using a Subgraph Draw Style of Left Side Tick Size Rectangle or Right Side Tick Size Rectangle.
Display Save All Option on Exit (Global Settings >> General Settings >> GUI >> Application GUI)
When this option is set to Yes and you exit from Sierra Chart, a Save All window will display allowing you to save all of your Chartbooks and your Spreadsheets. If this option is set to No, then this window will not be displayed on exit.
Effectively this option to display the Save All question functions as a prompt to confirm exiting from Sierra Chart since it will always display when enabled.
Disable Prompt to Save Chartbook on Chartbook Close (Global Settings >> General Settings >> GUI >> Application GUI)
When this option is set to Yes then when a chartbook is closed, there will not be a prompt to save the chartbook. This means that if the chartbook needs to be saved prior to closing, then it needs to have been saved previously, or any changes to the chartbook since the last save will be lost.
Otherwise, when this option is set to No, then when a chartbook is closed, there will be a prompt to save the chartbook.
Sort CW Menu by Chart Number (Global Settings >> General Settings >> GUI >> Application GUI)
When this option is enabled, then the CW (Child Window) menu which lists Chart and Spreadsheet windows, will be sorted according to the Chart Number rather than alphabetically. In this case any open Spreadsheet windows will be listed at the end.
Maximum Items per Column for CW Menu (Global Settings >> General Settings >> GUI >> Application GUI)
This setting establishes the number of listed charts that are displayed in each column in the CW Menu.
This setting is to be used if the number of available charts is too long to be able to see the entire list on a monitor. When this occurs, lower the number in this setting in order to split the list of charts into multiple columns so that all the charts can be seen in the list. This value determines the number of charts per column.
Maximum Items per Column for Study Collections Menu (Global Settings >> General Settings >> GUI >> Application GUI)
This setting establishes the number of listed study collections that are displayed in each column in the Analysis menu.
This setting is to be used if the number of available Study Collections is too long to be able to see the entire list on a monitor. When this occurs, lower the number in this setting in order to split the list of study collections into multiple columns so that all the study collections can be seen in the list. This value determines the number of study collections per column.
Printing (Global Settings >> General Settings >> GUI)
This sub-section contains global settings related to printing.
Print Only In Black And White (Global Settings >> General Settings >> GUI >> Printing)
When this option is enabled and you print a chart with File >> Print, then the chart is printed in black and white only. The background remains the color of the printer paper, or if you are printing to an electronic document it will be white.
Windows (Global Settings >> General Settings)
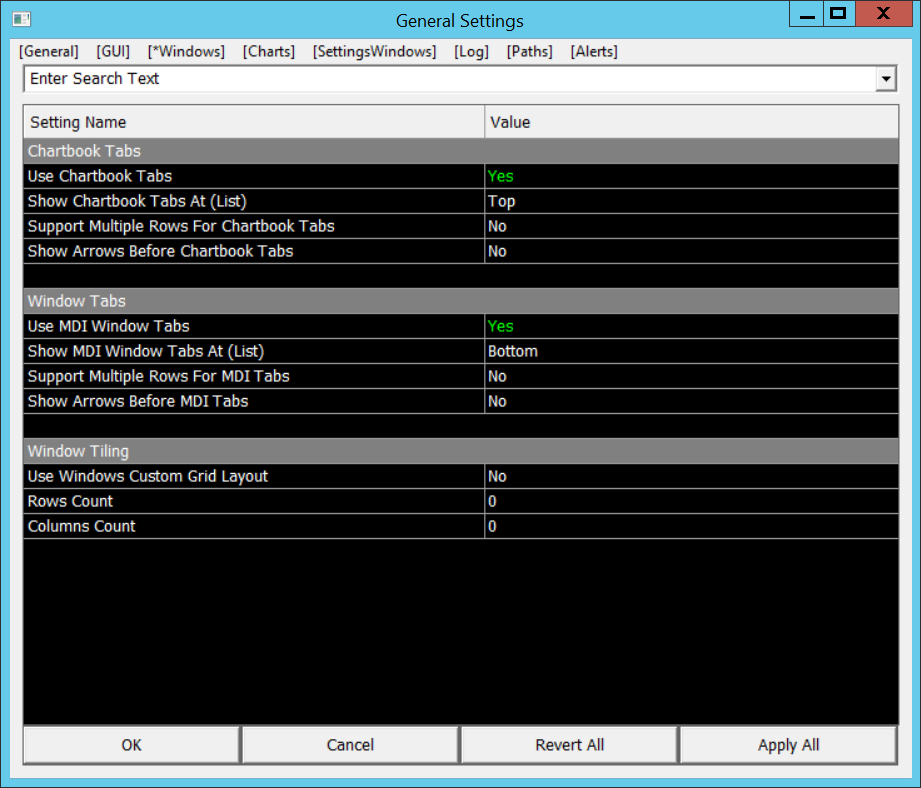
Chartbook Tabs (Global Settings >> General Settings >> Windows)
This sub-section contains global settings related to chartbook tabs.
Use Chartbook Tabs (Global Settings >> General Settings >> Windows >> Chartbook Tabs)
When this option is set to Yes, then the Chartbook Tabs are displayed at the location determined by the setting for Show Chartbook Tabs At. Otherwise, if this is set to No, then the Chartbook Tabs are not displayed and a chartbook would be selected by choosing it in the CB menu.
Show Chartbook Tabs At (Global Settings >> General Settings >> Windows >> Chartbook Tabs)
This option determines where the Chartbook tabs will be located. The following options are available:
- Top: When this option is selected, the Chartbook tabs are placed at the top of the Sierra Chart window, but below any Control Bars that are also Attached to the Top.
- Bottom: When this option is selected, the Chartbook tabs are placed at the bottom of the Sierra Chart window, below the MDI Tabs if they are also located on the bottom.
Support Multiple Rows (Global Settings >> General Settings >> Windows >> Chartbook Tabs)
When this option is enabled, and there are enough Chartbook Tabs to go beyond the viewable edge of the window, then the Chartbook Tabs are placed into multiple rows.
Otherwise, the Chartbook Tabs are placed out of view and arrows are displayed to allow for scrolling left and right through the Chartbook Tabs.
Show Arrows Before Chartbook Tabs (Global Settings >> General Settings >> Windows >> Chartbook Tabs)
When this option is enabled and the option for Support Multiple Rows is disabled, and there are enough Chartbook Tabs to go beyond the viewable edge of the window, then the Chartbook Tab Arrows, that allow for scrolling to the left and right through the Chartbook Tabs, will be displayed on the left side of the Chartbook Tabs.
Otherwise the arrows are displayed on the right side of the Chartbook Tabs.
Window Tabs (Global Settings >> General Settings >> Windows)
This sub-section contains global settings related to the Multi-Document Interface (MDI) Tabs
Double-clicking with your Pointer on an MDI tab, will maximize or restore the chart or Spreadsheet window associated with that tab.
For information on how to change the order of tabs, change the coloring of tabs, and changing tab names go to the Working with Tabs section.
Use MDI Window Tabs (Global Settings >> General Settings >> Windows >> Window Tabs)
When this option is set to Yes, then the MDI Tabs are displayed at the location determined by the setting for Show MDI Tabs At. Otherwise, if this is set to No, then the MDI Tabs are not displayed and an MDI window would be selected by choosing it in the CW menu.
Show MDI Tabs At (Global Settings >> General Settings >> Windows >> Window Tabs)
This option determines where the MDI (Multiple Document Interface) tabs will be located. MDI Tabs include the Chart and Spreadsheet windows. The following options are available:
- Top: When this option is selected, the MDI Tabs are placed at the top of the Sierra Chart window, but below any Control Bars that are also Attached to the Top, and below the Chartbook tabs if they are located at the top.
- Bottom: When this option is selected, the MDI Tabs are placed at the bottom of the Sierra Chart window, above the Chartbook tabs if they are also located on the bottom.
Support Multiple Rows for MDI Tabs (Global Settings >> General Settings >> Windows >> Window Tabs)
When this option is set to Yes and there are enough MDI Tabs to go beyond the viewable edge of the window, then the MDI Tabs are placed into multiple rows.
Otherwise, the MDI Tabs are placed out of view and arrows are displayed to allow for scrolling left and right through the MDI Tabs.
Show Arrows Before MDI Tabs (Global Settings >> General Settings >> Windows >> Window Tabs)
When this option is set to Yes and the option for Support Multiple Rows is set to No, and there are enough MDI Tabs to go beyond the viewable edge of the window, then the MDI Tab Arrows, that allow for scrolling to the left and right through the MDI Tabs, will be displayed on the left side of the MDI Tabs.
Otherwise, the arrows are displayed on the right side of the MDI Tabs.
Window Tiling (Global Settings >> General Settings >> Windows)
This sub-section contains global settings related to window tiling.
Use Windows Custom Grid Layout (Global Settings >> General Settings >> Windows >> Window Tiling)
When this option is set to Yes and positive values are entered in the Rows Count and the Columns Count, then when selecting Window >> Tile As Grid - Horizontally or Window >> Tile As Grid - Vertically, the windows will arrange into a grid pattern defined by the Rows Count and the Columns Count.
For example, if Rows Count is set to 3 and the Columns Count is set to 2 then when selecting Window >> Tile As Grid - Horizontally/Vertically the windows will be arranged into 3 rows and 2 columns.
Rows Count (Global Settings >> General Settings >> Windows >> Window Tiling)
This sets the number of rows into which the windows are tiled when the setting for Use Windows Custom Grid Layout is set to Yes and an option to tile the windows is selected.
Columns Count (Global Settings >> General Settings >> Windows >> Window Tiling)
This sets the number of columns into which the windows are tiled when the setting for Use Windows Custom Grid Layout is set to Yes and an option to tile the windows is selected.
Charts (Global Settings >> General Settings)
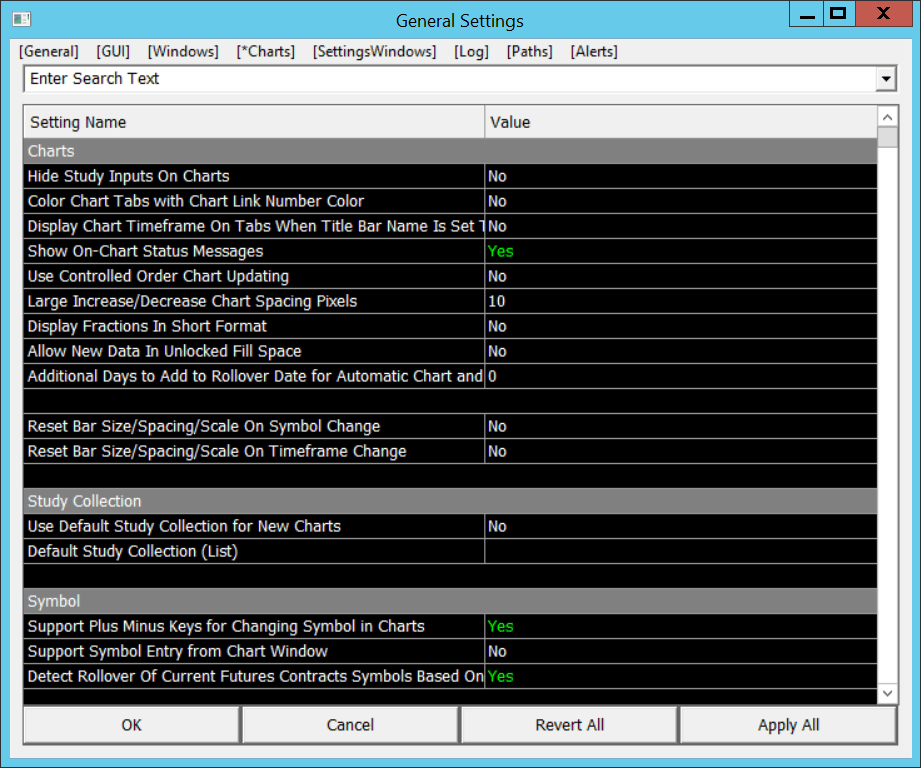
Charts (Global Settings >> General Settings >> Charts)
This sub-section contains global settings related to charts.
Hide Study Inputs On Charts (Global Settings >> General Settings >> Charts >> Charts)
When this option is set to Yes, then the values for study Inputs will not be displayed after the study Name on the Region Data Line at the top of the Chart Region where the study is located, and the values of study Inputs will not be displayed in the Chart Values windows. This is a global option and overrides the study Input display option on the studies themselves.
Color Chart Tabs with Chart Link Number Color (Global Settings >> General Settings >> Charts >> Charts)
When this option is set to Yes, the chart window tabs in the main Sierra Chart window are color-coded according to the associated color for the Chart Link Number if the chart is set to a nonzero Link Number.
For more information about Chart Linking, refer to Chart Linking.
The Chart Link Number colors are set through the Graphics Settings window in the Colors and Widths list box. They are labeled Link Number Color #1 through Link Number Color #16.
Display Chart Timeframe On Tabs When Title Bar Name Is Set To Be Used On Chart Tab (Global Settings >> General Settings >> Charts >> Charts)
In Chart >> Chart Settings, if you have set a Title Bar Name and you have enabled Use Title Bar Name As Tab Label, then the chart bars period is no longer displayed on the MDI tab for the chart. When you enable this option, then the chart bars period will be displayed on the MDI chart tab even in this case.
Show Chart Number First on Chart Name (Global Settings >> General Settings >> Charts >> Charts)
When this option is set to Yes, the chart number will be displayed first in locations that show the chart number and name, such as the Title Bar and the chart tabs. Otherwise, the chart number is displayed after the Chart Name.
Show On-Chart Status Messages (Global Settings >> General Settings >> Charts >> Charts)
The download status for a symbol can be shown on the chart. This lets you instantly and clearly know what the current download status is. The chart will not update in real time until the historical data has been downloaded for it. When this option is set to Yes, you will see the download status on the chart. Therefore it is advised that you always keep this option enabled so you can clearly see the download status. It is not recommended you disable this option.
Use Controlled Order Chart Updating (Global Settings >> General Settings >> Charts >> Charts)
By default this option is set to No and under typical use this should stay No. When this option is set to Yes, then studies which reference data in other charts are used to determine the order of calculating charts.
Charts which depend upon other charts are calculated last in the order of calculations. For example, if there are charts 1, 2 and 3 and chart 1 depends upon charts 2 and 3 in its calculations because it makes a reference to those charts, then charts 2 and 3 will be calculated first and then chart 1 will be calculated last.
By default this option is disabled and under typical use this should be disabled. The calculation order of charts, when this option is disabled is going to be random. However, this is the most efficient method of calculations.
One potential effect of using this option, but not necessarily, is that if you have many charts open in a Chartbook and it takes a significant amount of time to calculate those charts, then you will notice that the user interface of Sierra Chart will momentarily be busy while the calculations are occurring.
When using Controlled Order Chart Updating the minimum update interval is 250 milliseconds. The Chart Update Interval is controlled by the Global Chart Update Interval setting.
Large Increase/Decrease Chart Spacing Pixels (Global Settings >> General Settings >> Charts >> Charts)
This setting controls the number of pixels that the bar spacing will be changed by when increasing or decreasing the chart spacing by a large amount as documented in Changing Bar Spacing.
Interactive Scale Range Movement Adjust Direction (Global Settings >> General Settings >> Charts >> Charts)
This setting controls the pointer direction of movement when adjusting the vertical scale range. The following options are available:
- Move down decreases range. Move up increases range.
- Move down increases range. Move up decreases range.
Interactive Scale Range Percent Change for Full Region Move (Fractional: .1 = 10%) (Global Settings >> General Settings >> Charts >> Chart)
This setting controls the speed with which the vertical Interactive Scale Range adjusts. A higher value means a movement of the same amount will adjust the range more than a smaller value.
Display Fractions In Short Format (Global Settings >> General Settings >> Charts >> Charts)
When this option is set to Yes, fractions such as 110 5/32 will be displayed as 110'5 in charts.
Due to the nature of a Trading DOM and the requirement for a fixed width for the price column, symbols which use a fractional display, will always be displayed in a short format like 110'5, even when Display Fractions In Short Format is set to No.
Allow New Data In Unlocked Fill Space (Global Settings >> General Settings >> Charts >> Charts)
When the Right Side Fill Space is unlocked, and Allow New Data in Unlocked Fill Space is set to Yes, then as new bars are added to the chart, then these bars will be added in the fill space.
If this option is set to No and new bars are added to the chart, then the Right Side Fill Space will be preserved.
Additional Days to Add to Rollover Date for Chart and Quote Board Rollovers (Global Settings >> General Settings >> Charts >> Charts)
This setting works with Charts, Quote Boards, and the symbol list window (Chart >> Associated Symbol List).
This option sets the number of days after the date-based rollover date for the symbol, for the symbol to be considered expired or needs to be rolled over.
For example, if this is set to 3 and the date-based automatic rollover for a symbol is March 31, then the symbol will not rollover until April 3.
Reset Bar Size/Spacing/Scale On Symbol Change (Global Settings >> General Settings >> Charts >> Charts)
When this option is set to Yes, then when the thickness of the chart bars changed with Chart >> Decrease/Increase Bar Width is reset, the spacing between the chart bars is reset, and the chart scale is reset, when the symbol of the chart is changed.
Reset Bar Size/Spacing/Scale On Timeframe Change (Global Settings >> General Settings >> Charts >> Charts)
When this option is set to Yes, then the thickness of the chart bars which have been changed with Chart >> Decrease/Increase Bar Width is reset, the spacing between the chart bars is reset, and the chart scale is reset, when the timeframe / bar period of the chart bars is changed.
Study Collection (Global Settings >> General Settings >> Charts)
This sub-section contains global settings related to Study Collections.
Use Default Study Collection for New Charts (Global Settings >> General Settings >> Charts >> Study Collection)
When this option is enabled, then the selected Study Collection will automatically be applied to new charts that you open. Choose the Study Collection that you wish to automatically apply to new charts, from the list box entitled Default Study Collection. Refer to Study Collections for more information.
Default Study Collection (Global Settings >> General Settings >> Charts >> Study Collection)
This option defines the Study Collection that will be applied to all new charts when the option for Use Default Study Collection for New Charts is set to Yes.
Symbol (Global Settings >> General Settings >> Charts)
Support Plus Minus Keys for Changing Symbol in Charts (Global Settings >> General Settings >> Charts >> Symbol)
When this option is set to Yes, then the Plus (+) and Minus (-) keys on the keyboard will cycle through the list of symbol files in the data folder for this Sierra Chart instance. Each press will change the symbol to the next (or previous) data file found and load that data into the chart.
Support Symbol Entry from Chart Window (Global Settings >> General Settings >> Charts >> Symbol)
When this option is enabled, then you are allowed to enter a symbol directly from the chart window by simply typing the symbol into the chart window and pressing the ENTER key on the keyboard. For more information, refer to the Changing the Symbol of the Chart page.
Detect Rollover Of Current Futures Contracts Symbols Based On Real Time Volume (Global Settings >> General Settings >> Charts >> Symbol)
When this option is enabled, then the Daily Volume of a futures symbol for a chart is compared to the Daily Volume of the next contract month. When the volume of the next contract month is higher than the current futures symbol of a chart, then the current symbol is considered expired and a Rollover message will be displayed on the chart.
This feature can only work properly when Sierra Chart is connected to the data feed. To connect to the data feed select File >> Connect to Data Feed.
If the absolute value of the difference between the current date and the rollover date based upon the date rollover rules for the symbol, is more than 4 days, then a volume-based rollover analysis is not performed. In other words if the current date is not within 4 days of the date based rollover date for the symbol, then a volume-based rollover analysis is not performed.
If a symbol is considered expired by a week or more according to the date rollover rules, then a volume-based rollover analysis is not performed. In this case, the standard date based rollover rules will indicate a message on the chart that the symbol is expired.
When the symbol is considered expired based upon the volume being higher in the next contract month, then a Rollover message is displayed on the chart for a half a day. It is necessary to rollover to the next contract month to clear this message. This message will redisplay after reconnecting to the data feed.
Left click on this message to display the Futures Symbol Rollover window to roll over to the next contract month.
The check for determining if the symbol is expired based on volume is performed every 10 minutes and initially upon when the symbol is used.
If you want to prevent the Volume based Rollover message from being displayed on the chart, then you need to disable this option, Detect Rollover Of Current Futures Contracts Symbols Based On Real Time Volume, and then restart Sierra Chart. You may still see the standard rollover text message on the chart for 30 seconds but it will clear after that amount of time.
When using the Detect Rollover Of Current Futures Contracts Symbols Based On Real Time Volume option, you are going to want to disable the Automatically Rollover Futures Symbol option in the Chart Settings for the chart.
The Continuous Contract option in Chart >> Chart Settings is fully unrelated to Detect Rollover Of Current Futures Contracts Symbols Based On Real Time Volume, and has no effect upon the current symbol of the chart.
Chartbooks (Global Settings >> General Settings >> Charts)
This sub-section contains global settings for items related to Chartbooks.
Close Existing Chartbooks When Open Chartbook Group (Global Settings >> General Settings >> Charts >> Chartbooks)
When this option is set to No, then when opening a Chartbook Group all open Chartbooks are not closed. Otherwise, when this option is set to Yes, and a Chartbook Group is opened, the open Chartbooks are automatically closed.
Auto-Save Chartbooks (Global Settings >> General Settings >> Charts >> Chartbooks)
When this option is set to Yes, then the Chartbooks that are currently open will be automatically saved at the interval specified in the setting Auto-Save Chartbooks Interval In Minutes.
At the same time, all open Spreadsheet files are also saved.
Auto-Save Chartbooks Interval In Minutes (Global Settings >> General Settings >> Charts >> Chartbooks)
This option specifies the number of minutes between automatic saving of open chartbooks when the option for Auto-Save Chartbooks is set to Yes.
Settings Windows (Global Settings >> General Settings)
Settings Windows (Global Settings >> General Settings >> Settings Windows)
This sub-section contains global settings related to the settings windows.
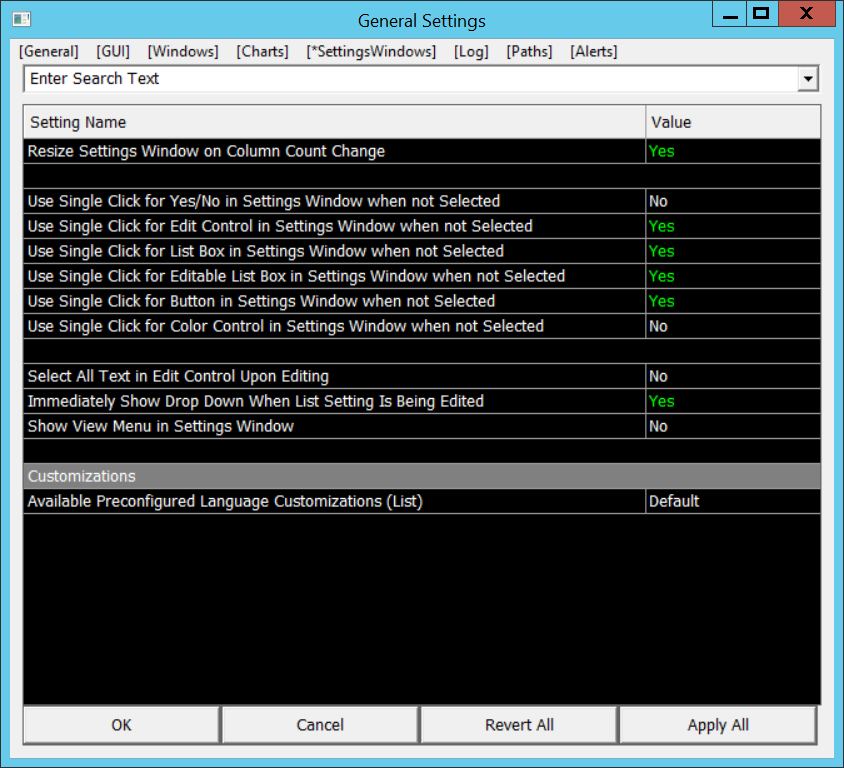
Resize Settings Window on Column Count Change (Global Settings >> General Settings >> SettingsWindows)
When this option is set to Yes, and there is a change to the number of columns on a Settings Window it will automatically resize appropriately. Either larger or smaller.
Use Single Click for Yes/No in Settings Window when not Selected (Global Settings >> General Settings >> SettingsWindows)
When this option is set to Yes, then when selecting the Yes/No area of a non-highlighted setting (any setting other than the currently active one), the setting will change the Yes/No value (Yes will become No and No will become Yes). Otherwise, selecting the Yes/No area of a non-highlighted setting will not change the value.
Use Single Click for Edit Control in Settings Window when not Selected (Global Settings >> General Settings >> SettingsWindows)
When this option is set to Yes, then when selecting the Value Field area of a non-highlighted setting (any setting other than the currently active one), the value field will be selected to allow immediate editing. Otherwise, selecting the Value Field area of a non-highlighted setting will not select the Value Field.
Use Single Click for List Box in Settings Window when not Selected (Global Settings >> General Settings >> SettingsWindows)
When this option is set to Yes, then when selecting the List Box area of a non-highlighted setting (any setting other than the currently active one), the list box area will be selected. Otherwise, selecting the List Box area of a non-highlighted setting will not select the list box.
Use Single Click For Editable List Box In Settings Window When Not Selected (Global Settings >> General Settings >> SettingsWindows)
When this option is set to Yes, then when selecting the Editable List Box area of a non-highlighted setting (any setting other than the currently active one), the editable list box area will be selected. Otherwise, selecting the Editable List Box area of a non-highlighted setting will not select the editable list box.
Use Single Click for Button in Settings Window when not Selected (Global Settings >> General Settings >> SettingsWindows)
When this option is set to Yes, then when selecting the Button area of a non-highlighted setting (any setting other than the currently active one), the button will be activated. Otherwise, selecting the button of a non-highlighted setting will not activate the button.
Use Single Click for Color Control in Settings Window when not Selected (Global Settings >> General Settings >> SettingsWindows)
When this option is set to Yes, then when selecting the Color Control area of a non-highlighted setting (any setting other than the currently active one), the control will be activated. Otherwise, selecting the color control of a non-highlighted setting will not activate the color control.
Select All Text in Edit Control Upon Editing (Global Settings >> General Settings >> SettingsWindows)
When this option is set to Yes, then when selecting an editable field on a Settings Window, the existing text within that field will be automatically selected. This allows for immediate entry of new information without having to select the text separately. When this option is set to No then the text in the editable field will not be selected.
Immediately Show Drop Down When List Setting Is Being Edited (Global Settings >> General Settings >> SettingsWindows)
When this option is set to Yes, and a settings row contains a drop-down list box, when the editing begins for that row, the drop-down list will be automatically opened.
Show View Menu in Settings Window (Global Settings >> General Settings >> SettingsWindows)
When this option is set to Yes, then the View menu will be displayed on the Settings windows. Otherwise, the View menu will not be displayed.
Use Mouse Scroll Wheel to Select Settings in Settings Window (Global Settings >> General Settings >> SettingsWindows)
When this option is set to Yes then when a Settings Window is the active window and the scroll wheel is used, the selection highlight showing which option is active will move with the scroll wheel. This also means that the scroll wheel will not scroll the window up or down, if there is space to do so, but the selection highlight will stay in the viewable area.
Otherwise, when this option is set to No and a Settings Window is the active window, then the scroll wheel will have not change the selection highlight, but will scroll the window up/down if there is space to do so.
Select String Matching Method in Search (Global Settings >> General Settings >> SettingsWindows)
This setting gives the following options for how to search for strings within the search capabilities of the Settings Windows:
- Exact String Matching: The exact string that is entered will only match exactly to strings within the settings window.
- Fuzzy String Matching: The string that is entered will match to other strings that are similar to the entered string, but do not have to be exact matches (exact matches will also be matched) within the settings window.
Customizations (Global Settings >> General Settings >> SettingsWindows)
This sub-section contains global settings related to customizing Sierra Chart.
Available Preconfigured Language Customizations (Global Settings >> General Settings >> SettingsWindows >> Customizations)
Selecting an item in this list will customize the Sierra Chart interface for the selected language
Further information on language customization can be found in the section for Additional Language Support.
Log (Global Settings >> General Settings)
Log (Global Settings >> General Settings >> Log)
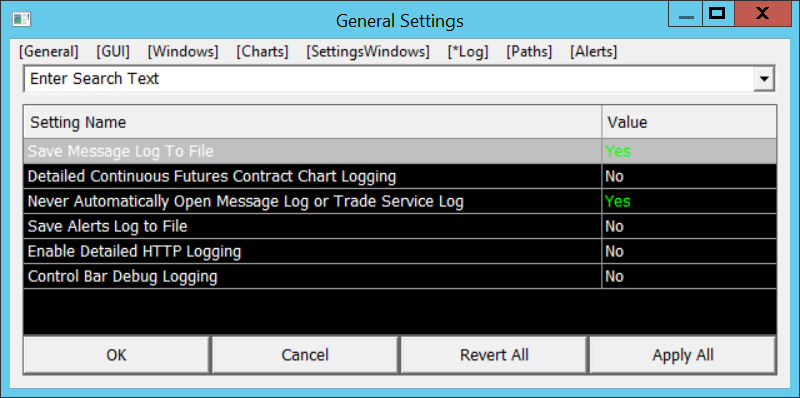
Save Message Log to File (Global Settings >> General Settings >> Log >> Log)
When this option is set to Yes, then the Window >> Message Log lines are automatically saved to a file.
The Message Log files are saved in the Logs subfolder in the folder that Sierra Chart is installed to on your system. The default location for the logs folder is: C:\SierraChart\Logs. This folder will be different if Sierra Chart is installed into a different folder on your system. To determine the location where Sierra Chart is installed on your system, open the Message Log with Window >> Message Log.
If the Message Log does not display, select Window >> Reset Windows, and try opening the Message Log again.
Near the top, you will see a line like this: Program path: C:\SierraChart\.
The filename format for the saved log is: Message Log YYYY-MM-DD HHMMSS.log.
A new message log file is created every 24 hours at the time a new message is added.
Detailed Continuous Futures Contract Logging (Global Settings >> General Settings >> Log >> Log)
When this option is set to Yes, then when data is being downloaded and also loaded from local disk files for a Continuous Futures Contract chart, detailed logging will be added to the Message Log window indicating relevant detailed messages.
Normally this option should be set to No. Do not enable it unless you need to see the detailed messages because a lot of messages will be added to the Message Log.
Never Automatically Open Message Log or Trade Service Log (Global Settings >> General Settings >> Log >> Log)
When this option is set to Yes, the Message Log and Trade Service Log windows will not automatically open if they are currently not open, even when there is an error message which requires user attention.
It is recommended not to enable this option and Sierra Chart takes no responsibility whatsoever for the consequence of enabling this option. This will be fully the end-user's responsibility.
Save Alerts Log to File (Global Settings >> General Settings >> Log >> Log)
When this option is set to Yes, then the Window >> Alerts Log lines are automatically saved to a file as they are added to the Log.
The Alerts Log files are saved in the Logs subfolder in the folder that Sierra Chart is installed to on your system. The default location for the logs folder is: C:\SierraChart\Logs.
This folder will be different if Sierra Chart is installed into a different folder on your system. To determine the location where Sierra Chart is installed on your system, open the Message Log with Window >> Message Log.
If the Message Log does not display, select Window >> Reset Windows. And try opening the Message Log again.
Near the top, you will see a line like this: Program path: C:\SierraChart\.
The filename format for the Alert Log is: Alert Log YYYY-MM-DD HHMMSS.log.
Enable Detailed HTTP Logging (Global Settings >> General Settings >> Log >> Log)
When this option is set to Yes, then when historical data is being downloaded from the Sierra Chart historical data service, detailed logging will be added to the Message Log window indicating relevant detailed messages.
Normally this option should be set to No. Do not enable it unless you need to see the detailed messages because a lot of messages will be added to the Message Log.
Control Bar Debug Logging (Global Settings >> General Settings >> Log >> Log)
When this option is set to Yes, then when a Control Bar Button is selected, detailed logging will be added to the Message Log window indicating relevant detailed messages.
Normally this option should be set to No. Do not enable it unless you need to see the detailed messages because a lot of messages will be added to the Message Log.
Paths (Global Settings >> General Settings)
Files and Folder Paths (Global Settings >> General Settings >> Paths)
This sub-section contains global settings related to file and folder names and locations
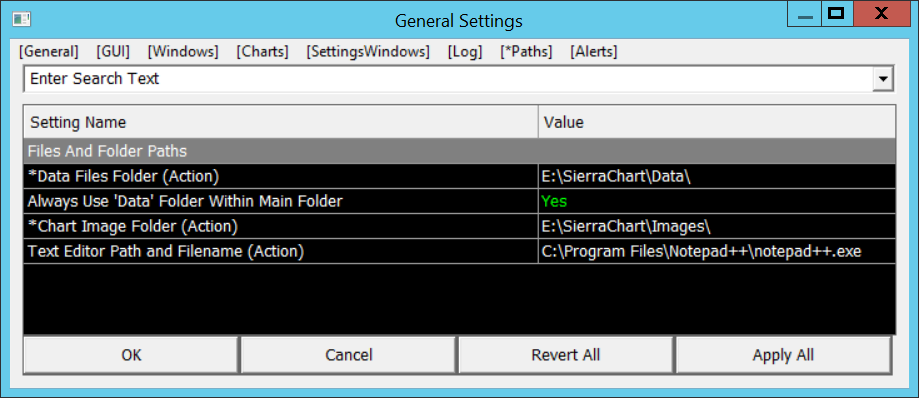
Data Files Folder (Global Settings >> General Settings >> Paths >> Files and Folder Paths)
The Data Files Folder displays the path to the folder where the Daily and Intraday data files, Market Depth data files, Chartbook, and Study Collection files are stored/located.
To change this folder, either type in the folder name, or select the browse button and select a folder in the Browse for Folder window and press OK.
The default folder is the Data folder under the folder where Sierra Chart is installed.
If you make changes, then you need to use your operating system file manager and move files from the old folder to the new folder or you will not have access to those files.
If you are connected to the data feed, then Intraday data will still be written to the files in the old folder until the next time you reconnect to the data feed. If you change the data files folder, then you should restart Sierra Chart to ensure data will be written to the new folder.
Changing the Data Files Folder
- Select File >> Disconnect.
- Select Global Settings >> General Settings.
- Uncheck the Always Use 'Data' Folder within Main Folder option.
- Press the browse button in the Data Files Folder field. Change the folder to what you require. The Browse for Folder window gives you the ability to also create a new folder to select. This folder can be located on any storage device, but it should be a storage device which has fast access.
- Press OK.
- Press OK to close the General Settings window.
- Select File >> Exit to exit from Sierra Chart.
- Move the files in the old Data Files Folder to the new Data Files Folder through your operating system file manager.
- Start Sierra Chart.
Always Use 'Data' Folder within Main Folder (Global Settings >> General Settings >> Paths >> Files and Folder Paths)
When the Always Use 'Data' Folder within Main Folder option is set to Yes, then the Data Files Folder will always be set to the Data folder that is located within the folder that Sierra Chart is installed to.
When this option is set to Yes and Sierra Chart is relocated to another folder or drive, the path to the Data Files Folder will be changed to be the Data folder within the main folder where Sierra Chart is currently located.
It is recommended to keep this setting enabled unless you are using a Data folder that is not within the Sierra Chart installation folder such as if the folder is on another storage drive on your system.
In the case of a sub instance of Sierra Chart started with File >> New Instance, Always Use 'Data' Folder within Main Folder is always enabled and cannot be disabled. This is to ensure, there is not an improper setting of the Data Files Folder in that case. If you want to relocate the Data Files Folder in the case of a sub-instance to another storage drive on your system, it is then necessary to relocate the main Sierra Chart instance to that same storage drive itself and then all of the sub instances will be on that drive as well as the Data folders. It is recommended to use a large capacity solid-state drive. For information about relocating/moving Sierra Chart, refer to help topic 15.
Chart Image Folder (Global Settings >> General Settings >> Paths >> Files and Folder Paths)
The Chart Image Folder displays the path to the folder where the last Image uploaded using Sierra Chart Image Upload Service and a log of the images uploaded is saved.
To change this folder, enter a new path or press the Browsebutton and select a folder in the Browse for Folder window then press OK.
Text Editor Path and Filename (Global Settings >> General Settings >> Paths >> Files and Folder Paths)
This field displays the text editor to use when the Edit >> Edit Data - Historical Chart command is selected or after data is exported and the editor is automatically opened.
To change the editor, press the Browse button, then select an editor to use. The default is Notepad++ that is included with Sierra Chart.
Trade Activity Logs Folder Path (Global Settings >> General Settings >> Paths >> Files and Folder Paths)
This setting specifies the folder to use for the Trade Activity Log storage files.
Normally this particular setting is blank. In the case when it is blank, the default location of /TradeActivityLogs subfolder in the Sierra Chart installation folder is used.
You can set this to a new folder path location to store Trade Activity Log files.
After changing the setting, it is mandatory to restart Sierra Chart.
You will also need to move existing Trade Activity Log files from the existing folder location to the new folder location, before restarting Sierra Chart.
Alerts (Global Settings >> General Settings)
Alert Settings (Global Settings >> General Settings >> Alerts)
This sub-section contains global settings for the configuration of alerts in Sierra Chart.
An Alert can consist of a sound to play, a phrase to be spoken, a log message added to the Alerts Log, a notification which can be received through an app running on a mobile device or other device, a pop-up notification, or running of a custom program to perform some custom action. Any or all of this can occur for an Alert within Sierra Chart.
There are numerous conditions which can cause in alert to be triggered within Sierra Chart.
This can be a Simple Alert condition or when a Spreadsheet System or Alert study condition becomes true.
An Alert can be triggered, when connected or disconnected from the data feed.
There are various Alerts for different types of Trade Order Events.
Advanced Custom Studies can also generate Alerts.
There are other conditions, which can trigger Alerts in Sierra Chart. Whatever the source of an alert is in Sierra Chart, at the location where the condition is configured, you choose an Alert Number. In the General Settings >> Alerts settings here, you configure what happens when this particular Alert Number is triggered.
Sierra Chart supports 200 Alert Sound configurations.
When an Alert Number is triggered, a message is always added to the Alerts Log with complete details about the alert.
A sound can also be configured to be played when the Alert Number is triggered. These are standard wav files that can be located anywhere on your computer.
Alert notifications can also be sent to the Sierra Chart Chat, which also allows for forwarding alerts to Telegram.
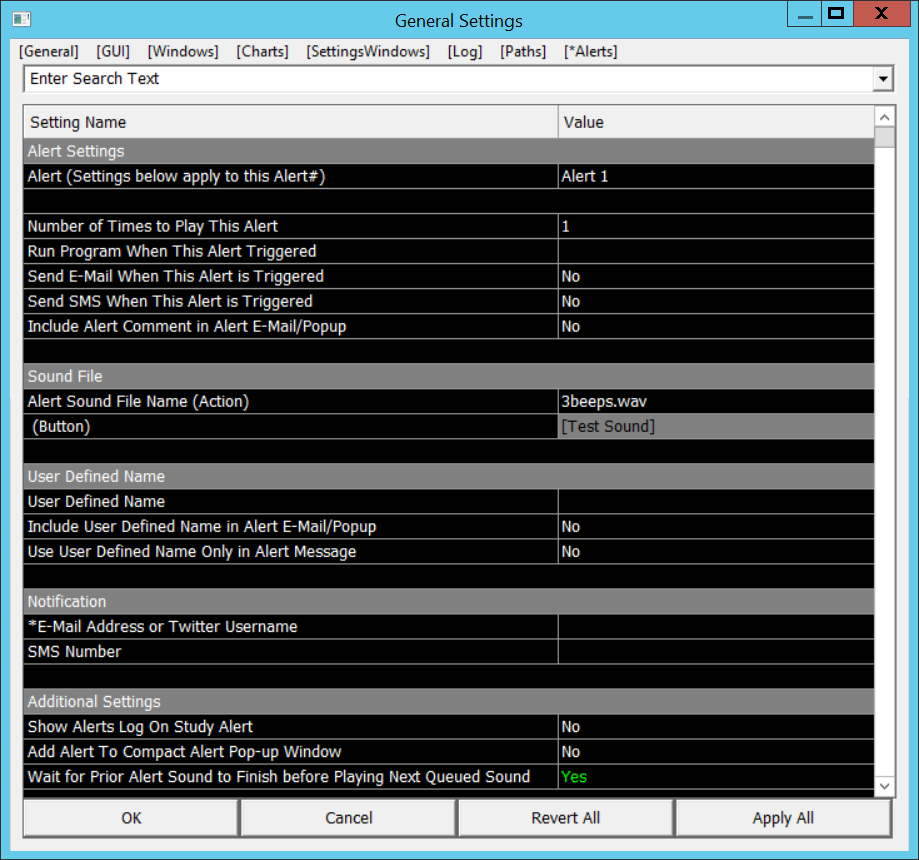
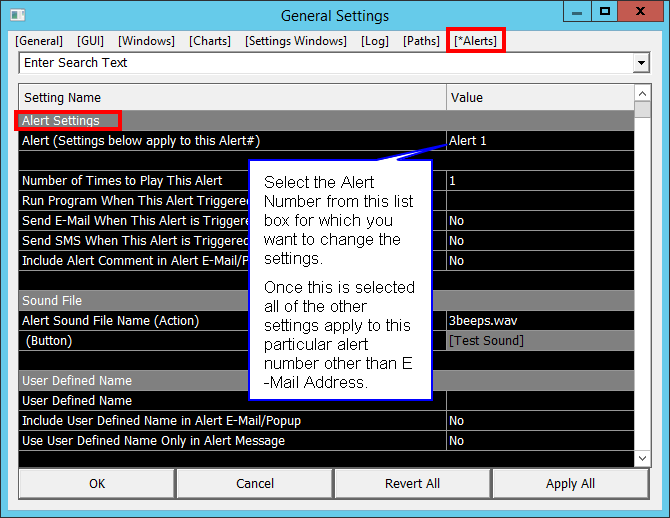
Alert Number (Global Settings >> General Settings >> Alerts >> Alert Settings)
Select the specific Alert Number from the list for which the rest of the settings on this tab will apply.
You will know a particular setting applies to the selected Alert Number, because to the right side of the setting name you will see (for Alert #). Where the # is the selected Alert Number.
Number of Times to Play This Alert (Global Settings >> General Settings >> Alerts >> Alert Settings)
This setting specifies the number of times to play the sound file associated with the selected Alert Number. This can be set to 0 to not play the sound file if you just want a text message only.
Run Program When This Alert Triggered (Global Settings >> General Settings >> Alerts >> Alert Settings)
Enter the complete path and filename to a program to run when the alert is triggered. This program will be run every time the alert is triggered.
The program is run using the cmd.exe command prompt program. The following are the parameters passed on the command line:
- /Number: The alert number.
- /Type: The alert type.
- /Source:"" The alert source within the quote marks.
- /Message:"" The alert message within the quote marks.
- /DateTime:"" The Date-Time including milliseconds of the alert within the quote marks.
Text to Play When This Alert Triggered (Global Settings >> General Settings >> Alerts >> Alert Settings)
Entering text into this field will play the text as speech when the alert is triggered.
This speech is played instead of any entered sound file for this alert.
This is different from the Text to Speech Wave File Creation and the Text to Speech Converter that are available. More information on these is in the Text-To-Speech Alerts section.
Send Alert as Chat Message When This Alert is Triggered (Global Settings >> General Settings >> Alerts >> Alert Settings)
Setting this option to Yes will have alert information for this alert number, send to the Sierra Chart Chat program when the alert is True. Otherwise, no alert notifications are sent to the chat program.
It is also necessary for the chat program to be setup to receive notifications and for the Chat Identifier or Chat Name for Alerts to be entered.
The instructions for setting this up are in the Using Chat for Remote Alert Notifications.
Chat Identifier for Alert (Global Settings >> General Settings >> Alerts >> Alert Settings)
Chat Identifier for Alert allows for the entry of the numeric chat identifier of a particular chat in the Chat List in the Chat Window (File >> Open Chat Window). See image below.
When a valid Chat Identifier is set in this field and the option for Send Alert as Chat Message when this Alert is Triggered is set to Yes for the particular Alert Number there is an alert triggered for, then the alert information will be sent to the chat with that identifier. Normally this will be a Group Chat that only you are the member of.
The Chat Identifier for Alert setting is specific to each individual Alert Number. So you can use different Chats for different Alert Numbers. There is also a global Chat Identifier setting applying to all Alert Numbers. Refer to Chat Identifier or Chat Name for Alert. When Chat Identifier for Alert for specific Alert Number is set to a nonzero number, it takes precedence over the global setting.
Capture Chart Image on Alert for Chart (Global Settings >> General Settings >> Alerts >> Alert Settings)
When this option is set to Yes, then when an alert that uses the set Alert Number is True, then an image of the chart that contains this alert is saved in the Images folder under the main Sierra Chart Installation folder.
Otherwise, when this option is set to No then when an alert that uses the set Alert Number is true, no image will be saved.
When an image is captured, it is uploaded to your account on the Sierra Chart web services server. There is a limit of the number of uploaded images. As of this writing the limit is 500 images. When you reach this limit, the chart image will no longer be uploaded or sent to the particular Chat it is set to be sent to. In this case, go to the Bulk Image Deletion page to delete images.
Capture Chart Image On Trade Order Event (Global Settings >> General Settings >> Alerts >> Alert Settings)
When this option is set to Yes then when a Trade Order Event occurs that uses the set Alert Number, then an image of the chart that contains this alert is saved in the Images folder under the main Sierra Chart Installation folder.
Otherwise, when this is set to No then when a Trade Order Event occurs that uses the set Alert Number, no image will be saved.
When an image is captured, it is uploaded to your account on the Sierra Chart web services server. There is a limit of the number of uploaded images. As of this writing the limit is 500 images. When you reach this limit, the chart image will no longer be uploaded or sent to the particular Chat it is set to be sent to. In this case, go to the Bulk Image Deletion page to delete images.
Include Alert Comment in Alert Chat Message/Popup (Global Settings >> General Settings >> Alerts >> Alert Settings)
When this option is set to Yes then the Comment that is set in a Symbol Alert is included in the Chat Message or Alert Popup for the defined alert number
Otherwise, when this option is set to No then the Comment that is set in a Symbol Alert is not included in the Chart Message or Alert Popup for the defined alert number.
Add Alert to Compact Alert Popup Window (Global Settings >> General Settings >> Alerts >> Additional Settings)
When this option is set to Yes, the alert message is also added to the Compact Alert Popup Window. The Compact Alert Popup Window will automatically display when a new message is added to it.
When the Compact Alert Popup Window is closed, the lines of messages in the log are automatically cleared.
There is only one Compact Alert Popup Window per Sierra Chart instance. New alerts are just added to the existing list if it is already open.
Sound File (Global Settings >> General Settings >> Alerts)
This sub-section contains global settings related to the sound for alerts.
Alert Sound File Name (Global Settings >> General Settings >> Alerts >> Sound File)
This shows the currently active sound file for this alert. You can select the entry field in order to select a different file.
Test Sound (Global Settings >> General Settings >> Alerts >> Sound File)
Select the [Test Sound] button to play the sound defined by the Alert Sound File Name setting.
User Defined Name (Global Settings >> General Settings >> Alerts)
This sub-section contains global settings related to the User Defined Name for Alerts.
User Defined Name (Global Settings >> General Settings >> Alerts >> User Defined Name)
This field allows for a specific name to be given to an alert. When a User Defined Name is entered, then instead of the Alert Number the User Defined Name will be displayed.
Include User Defined Name in Alert Chat Message/Pop-up (Global Settings >> General Settings >> Alerts >> User Defined Name)
When this option is set to Yes, then the User Defined Name for the alert is included in generated alert chat messages and in the alert pop-up window.
When the User Defined Name is included in the chat and pop-up window, the format is: | Alert: [User Defined Name].
Use User Defined Name Only in Alert Message (Global Settings >> General Settings >> Alerts >> User Defined Name)
When this option is set to Yes, then the User Defined Name for the Alert will be used for the alert message text and no other text will be included.
This allows for customization of the alert by only including the User Defined Name.
Notification (Global Settings >> General Settings >> Alerts)
This sub-section contains global settings related to external notifications for alerts.
Chat Identifier or Chat Name for Alert (Global Settings >> General Settings >> Alerts >> Notification)
This field allows for the entry of the numeric chat identifier of a particular chat in the Chat List in the Chat Window (File >> Open Chat Window). See image below.
When a valid Chat Identifier is set in this field and the option for Send Alert as Chat Message when this Alert is Triggered is set to Yes for the particular Alert Number there is an alert triggered for, then the alert information will be sent to the chat with that identifier. Normally this will be a Group Chat that only you are the member of.
At this time, the Chat Name is not supported. Do not enter a Chat Name. It will be equivalent to a chat identifier 0 which will do nothing.
It is also supported to specify the Chat Identifier for a particular chat, for each individual Alert Number. This is controlled through the Chat Identifier for Alert setting for the selected Alert Number. When the Chat Identifier for Alert setting is set to a nonzero value, it overrides the global Chat Identifier or Chat Name for Alert setting.
Additional Settings (Global Settings >> General Settings >> Alerts)
This sub-section contains global settings for additional settings for alerts.
Show Alerts Log On Study Alert (Global Settings >> General Settings >> Alerts >> Additional Settings)
When a study Alert Condition Formula becomes TRUE, it will add an alert message to the Alerts Log.
When this option is set to Yes, the Alerts Log window will open when this message is added. Otherwise, it will not automatically open. To manually open the Alerts Log, select Window >> Alerts Manager on the menu.
This setting also applies to Time and Sales Window alerts and Chart Drawing Alerts.
If the Alerts Log opens even when this option is disabled, then this would indicate the message is being added by an Advanced Custom Study, which is causing the Alerts Log to always open. The custom study itself will need to be modified to prevent this.
Wait for Prior Alert Sound to Finish Before Playing Next Queued Sound (Global Settings >> General Settings >> Alerts >> Additional Settings)
When this option is set to Yes, then when multiple alert sounds are activated, then the sounds are queued and played in order in which the alerts occurred waiting for each one to finish before playing the next. Otherwise, all the alert sounds are played at the time of the alert and will play over each other if the one has not ended before the next one needs to start.
Remote Alerts (Global Settings >> General Settings >> Alerts)
This sub-section contains global settings related to remote alerts.
Enable Remote Alerts (Global Settings >> General Settings >> Alerts >> Remote Alerts)
When Enable Remote Alerts is set to Yes, any Sierra Chart instances that are connected via the DTC protocol to the server instance of Sierra Chart on which this setting is enabled will receive any alerts that originate on the Sierra Chart instance on which this setting is enabled.
It is important to understand that enabling this setting makes this Sierra Chart instance a Server with regards to the Alerts that are generated on this instance. These Alerts are then sent to the connected Client instances of Sierra Chart that are connected via the DTC protocol.
The particular alert sound and other related settings that occurs on the remote (client) Sierra Chart instances is determined by the setting Alert Number for Remote Alert as set on the client instances.
Alert Number for Remote Alert (Global Settings >> General Settings >> Alerts >> Remote Alerts)
The selected alert sound will play when a remote alert is received from another Sierra Chart instance that has Enable Remote Alerts enabled.
If the option No Alert Sound is selected, then no alert sound will play when a remote alert is received, but the alert will still be logged in the Alerts Manager.
It is important to understand that this setting only applies to the Client instances of Sierra Chart with regards to the Alerts that are generated on a Server instance of Sierra Chart which are sent to Client instances when that server has the Enable Remote Alerts setting enabled.
Other Alerts (Global Settings >> General Settings >> Alerts)
This sub-section contains global settings related to alerts for other connections.
Server Connected Alert (Global Settings >> General Settings >> Alerts >> Other Alerts)
This lets you set an alert to use when connected to the Data/Trading server. This alert will play a sound, add a message to the Alerts Log and can also send an E-mail message.
Select one of the Alert Numbers to trigger an alert when connected to the Data/Trading Service. Select No Alert to disable this feature.
To configure the actual sound and other Alert settings for the selected Alert #, refer to Alert Sound Settings.
Server Connection Lost Alert (Global Settings >> General Settings >> Alerts >> Other Alerts)
This lets you set an alert to use when the connection is lost to the Data/Trading server. This alert will play a sound, add a message to the Alerts Log and can also send an E-mail message.
Select one of the Alert Numbers to trigger an alert when disconnected from the Data/Trading Service. Select No Alert to disable this feature.
To configure the actual sound and other Alert settings for the selected Alert #, refer to Alert Sound Settings.
Chat Window New Message Alert (Global Settings >> General Settings >> Alerts >> Other Alerts)
When any alert option other than No Alert Sound is selected, then the sound and/or chat notification for that alert number will occur when there is a new message in the Chat window.
Chat Window Pending Message Alert (Global Settings >> General Settings >> Alerts >> Other Alerts)
When any alert option other than No Alert Sound is selected, then the sound and/or chat notification for that alert number will occur when there is a message pending in the Chat window.
Chat Window Edited Message Alert (Global Settings >> General Settings >> Alerts >> Other Alerts)
When any alert option other than No Alert Sound is selected, then the sound and/or chat notifications for that alert number will occur when there is an edited messsage in the Chat window.
Chat Window Message Read Alert (Global Settings >> General Settings >> Alerts >> Other Alerts)
When any alert option other than No Alert Sound is selected, then the sound and/or chat notifications for that alert number will occur when there is a message read in the Chat window.
Chat Offline Alert (Global Settings >> General Settings >> Alerts >> Other Alerts)
When any alert option other than No Alert Sound is selected, then the sound and/or chat nofictations for that alert number will occur when the Chat window does not have a connection to the Sierra Chart servers.
Text to Speech Wave File Creation (Global Settings >> General Settings >> Alerts)
This sub-section contains the global setting to create a speech wave file from entered text.
Text to Speech Wave File Creation (Global Settings >> General Settings >> Alerts >> Text to Speech Wave File Creation)
Enter a line of text in this field and select the Create button in the field in order to create a Microsoft .wav file of the entered text as spoken words. This file can then be used as an Alert sound.
The Text-To-Speech Alerts section gives full instructions on how to use this feature.
Additional Alert Information
Configuring Alert Number Instructions
To set up the specific alert sound file to be played and also set up an e-mail alert for a particular Alert Number follow these steps:
- SelectGlobal Settings >> General Settings.
- Select the Alerts tab.
- Select an Alert Number in the Alert drop down list. All of the settings in the Notifications section and below, apply to the currently selected Alert Number.
- The settings for each Alert Number set in the General Settings >> Alerts tab, correspond to the Alert Sound >> Alert Number set on a study or on a chart, and the Alert Number in Global Settings >> General Trade Settings for order related alerts.
- Press the Select button in the Alert Sound File Name field to choose the wav sound file to play. The sound file can be located in any folder.
- Number of Times to play this alert: This setting specifies the number of times to play the sound file associated with the selected Alert Number. This can be set to 0 to not play the sound file if you just want a text message only.
- You have the ability to rename the selected Alert Number by entering a more descriptive name in the User Defined Name field. Wherever you normally would see the particular Alert Number listed in Sierra Chart, instead you will see your user-defined name.
- Repeat steps 3 through 8 above to set the settings for each Alert # you are using.
- Press OK.
Alerts During Back Testing
During back testing, Alert sounds are suppressed. Only Alert Messages added to the Alerts Log are allowed. At the end of the Alert Message in the Alerts Log you will see the following text: "No alert sound".
Playing Alert Sound Multiple Times
In the Number Of Times This Alert Sounds box for the selected Alert, enter the number of times you want to have the wav file played when the Alert Number is triggered.
In the case of a trade order alert, when using sub-instances of Sierra Chart, if the same trade order alert is configured in the sub instance, then it will be played there as well since order related messages are sent through to sub-instances. This is something to keep in mind when you hear an alert play more than once even though Number Of Times This Alert Sounds is set to 1. You may want to set the sub-instances to not use order alerts as a solution.
Text-To-Speech Alerts
It is supported to enter a text phrase and use that as an alert sound. The text is converted to speech.
Enter a phrase in the Text-To-Speech Wav File Creation field and select the Create button. The file will automatically be put in the AlertSounds folder under your Sierra Chart installation folder.
If you wish to generate a Text-to-Speech file using a specific voice style or speed option, then you can use the Text to Speech Generator webpage. This page can be accessed by selecting Help >> Account Control Panel within the Sierra Chart software and then selecting the menu item for Account Panel >> Text to Speech Converter. Files created on this page require a download and then placement in the AlertSounds folder.

Sampling/Testing Sound Files
If you want to hear what a sound file contains, then after configuring the Alert Sound file for a particular Alert Number, refer to Configuring Alert Number Instructions, press the Apply button, then select that particular Alert Number and press the Test Sound button on the Alerts tab of the Global Settings >> General Settings window.
Make sure the audio on your computer system is not muted and the audio volume on your computer system is set high enough.
Default Sound
If a sound file for an Alert Number is not specified, but the Alert Number is used wherever Alert Numbers are supported, the default operating system beep will be played.
Time Delay Between Sounds
When there are multiple alert sounds to be played because of various events triggering the alert sounds, the alert sounds by default will be played one after another. When one sound stops, the next one will be quickly started in less than a second. If you notice more of a delay than this between sounds, then most likely this is the result of a sound file being longer in time than you expect. You need to shorten your sound files as short as possible. You may be surprised to find out the actual time of them is longer than you realize.
Another solution to this is to set the option for Global Settings >> General Settings >> Alerts >> Wait for Prior Alert Sound to Finish before Playing Next Queued Sound to No. When this option is set to No, then as soon as an alert event occurs and there is a sound file to be played for the particular Alert Number set for the event, it will be played immediately.
However, whether it is immediately played or not, is dependent upon the operating system, since the operating system plays the sound file through the supported audio device.
Clearing the Alert Sound Queue
If there are many sounds in the queue that are waiting to be played, you can clear the current queue by selecting Global Settings >> Clear Alert Sound Queue.
Troubleshooting for Alert Sounds That Do Not Play
Follow the below steps to troubleshoot a condition where an Alert Sound does not play when you expect that it should.
- Select Window >> Alert Manager >> Alerts Log.
- Go to the bottom of the Alerts Log, assuming Sort >> Descending is not selected.
- Check to see if there is an Alert Message added for the particular alert event. Example: Alert - Chart: EURUSD 1 Min #2 | Formula: =C >1.0 is TRUE. | Last Price: 1.06814 | Bar Start Time: 2015-04-21 02:51:00 | Alert: AlertSound (1).
- The particular sound file which plays, is after the Alert: text. Directly after that in parentheses, the Alert Number associated with that sound file is displayed. If there is a user-defined name for the Alert Number which has been set, then the user-defined name will be displayed after Alert: instead of the sound file. Refer to the image below.
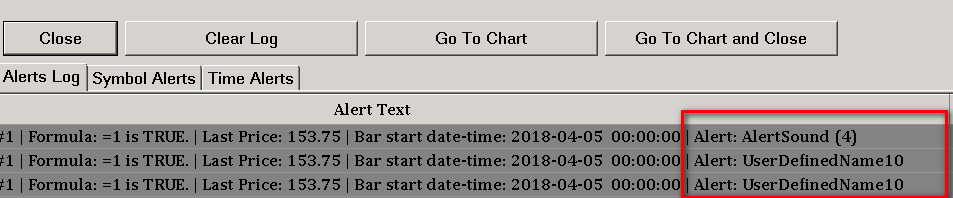
- If you do not see a message for the alert in the Alerts Log, then the problem is that the particular alert event which is triggering the Alert Sound/Message is not occurring to begin with.
If you are using a Simple Alert Condition Formula on a study, then you need to check on the Alert Condition Formula to make sure it is correct and does what you require. On the Alerts tab of the Study Settings window for the study, make sure the Enabled option is enabled in order to be sure an Alert Message will be added to the Alerts Log.
If you have enabled an Alert Condition on a Chart Drawing and it is not triggering when expected, then check the Chart Drawing Alert Settings.
If you are not getting the Alert Message in the Alerts Log, stop here because the particular alert event is not occurring to begin with. - Notice at the end of the alert message, where it has text like Alert: AlertSound (1). What this means is that the sound file named AlertSound is what has been played. As soon as the Alert message is added to the Alerts Log, the sound file is immediately played at that time. If there is a delay, then this delay is not coming from Sierra Chart.
- If after Alert: text in the Alert message, it says | Muted, then this means the alert sounds are muted. To unmute them, remove the checkmark from Global Settings >> Mute All Alert Sounds. In this particular case, stop here.
- If at the end of the alert message it says | No alert sound, then this means for the particular study alert or chart alert, there is no Alert Sound set.
In this case go to the Study Settings window for the study. Refer to Adding/Modifying Studies. Select the Alerts tab. Set the Alert Sound setting to one of the available Alert Numbers(#).
In the case of when using the Spreadsheet System/Alert or the Spreadsheet System for Trading studies, the Alert Numbers are set with the Column K-Z Alert Input settings. - Select Global Settings >> General Settings >> Alerts. Make sure the particular Sound File you want played for the particular Alert Number the alert event is using, is set to what you want. If there is no file set, then the default beep sound will be used, assuming the /AlertSounds/AlertSound.wav file exists. For additional information, refer to the Alert Sound Settings section.
- If you continue to not hear the alert sound, then make sure the audio on your computer system is not muted and the audio volume on your computer system is set high enough. Try testing the sound file by following the Sampling/Testing Sound Files instructions.
- Another possible reason for not hearing the sound could be that in the Windows operating system Volume Mixer control panel, sounds for the Sierra Chart application have been muted, or the volume is too low.
Therefore, check the Windows Volume Mixer control panel to make sure that the volume is set high enough and sounds for Sierra Chart are not muted. Each instance of Sierra Chart you are running, will have a separate Volume control within this Volume Mixer.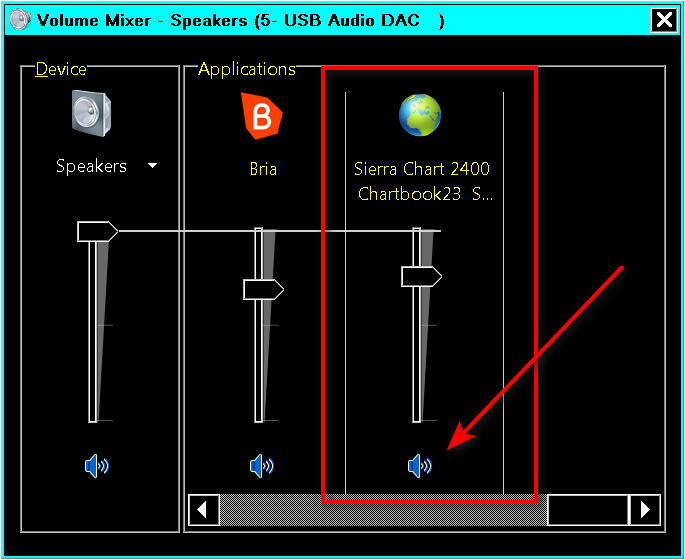
- Sierra Chart uses the Windows operating system PlaySound function to play sound files. This may help troubleshoot the issue if you have an understanding of that function.
Playing an Alert Sound Repeatedly Until Manually Stopped
There is a technique which can be followed to play an alert sound so many times until you manually stop it.
The first step is for a particular Alert Number, set it to play a large number of times. For instructions, refer to Playing Alert Sound Multiple Times.
When that particular Alert Number is triggered, then at the time it begins to play, when you want to stop it you just need to select Global Settings >> Clear Alert Sound Queue. You can also set up a Control Bar button for this particular command.
*Last modified Friday, 18th July, 2025.