Continuous Futures Contract Charts
- Introduction
- Using Continuous Futures Contract Charts
- Continuous Futures Contract Rollover Options
- Displaying Rollover Transition Times and Contract Months
- Automatically Rolling Over to Next Futures Contract Month
- Setting Rollover Time to Match Session Times
- Re-Downloading Continuous Futures Contract Data
- Basic Steps to Correct Invalid Back Adjust Amount for Most Recent Transition to New Contract Month
- Trade Order Fill Display Issues
- Incorrect Rollover Date
- Handling Specific Error Messages
- Preventing Error Messages by Reducing Days to Load in Chart
- Text Indicator Description Table
- Notes
- Continuous Futures Contract Charts with Skipped Month
- Controlling Rollover Amount for Back Adjustments
- Understanding Back Adjusted Price Data and Comparisons
- Verifying Correct Back Adjustment Amounts
- Using Date Rule Rollover or Volume Based Rollover?
- Forward Curve Charts
- Limitations
- Back Testing and Trading with Continuous Futures Chart
- Issues When Symbol of Chart is not Current Contract and Expires Later
Introduction
Effective with Sierra Chart version 2346, there is a change with how back adjustments are done for Continuous Futures Contract charts. The prior day settlement prices are now used rather than the current day open prices.
The Continuous Futures Contract Chart feature for Intraday charts is not supported when using Interactive Brokers, CQG or Rithmic data. You must be using the Denali Exchange Data Feed and pay for the corresponding exchange fee for the symbol that you are charting, to be able to get a Continuous Futures Contract chart.
This is necessary to receive the proper data for Continuous Futures Contract Charts.
It must be understood by you that the Continuous Futures Contract chart feature requires access to historical data for expired futures contracts, that there is no missing historical data, and that this data is delivered fast and reliably. No external Data service, can meet these requirements. They do not even come close to the historical data capabilities of the Sierra Chart provided data feeds (Denali Exchange Data Feed, Sierra Chart Historical Data Service).
In other words if you are using any external Trading service (Interactive Brokers, CQG or Rithmic), and you are not using the Denali Exchange Data Feed or the Sierra Chart Historical Data Service, the feature described on this page is either not going to work, or work very poorly and you therefore **absolutely** will have numerous issues with it.
As an alternative to the above listed Trading services, install another installation of Sierra Chart set to use the Sierra Chart Historical Data Service to have access to the full historical data for the Continuous Futures Contract Chart feature.
The Sierra Chart Continuous Futures Contract Chart functionality cannot be reliably used with the Rithmic because Rithmic uses single digit years in the symbols, instead of 2 or 4 digit years. This creates a severe limitation with the amount of historical data that can be accessed. Therefore, this feature must be considered unsupported when using Rithmic. The solution is to install another installation of Sierra Chart set to use the Sierra Chart Historical Data Service.
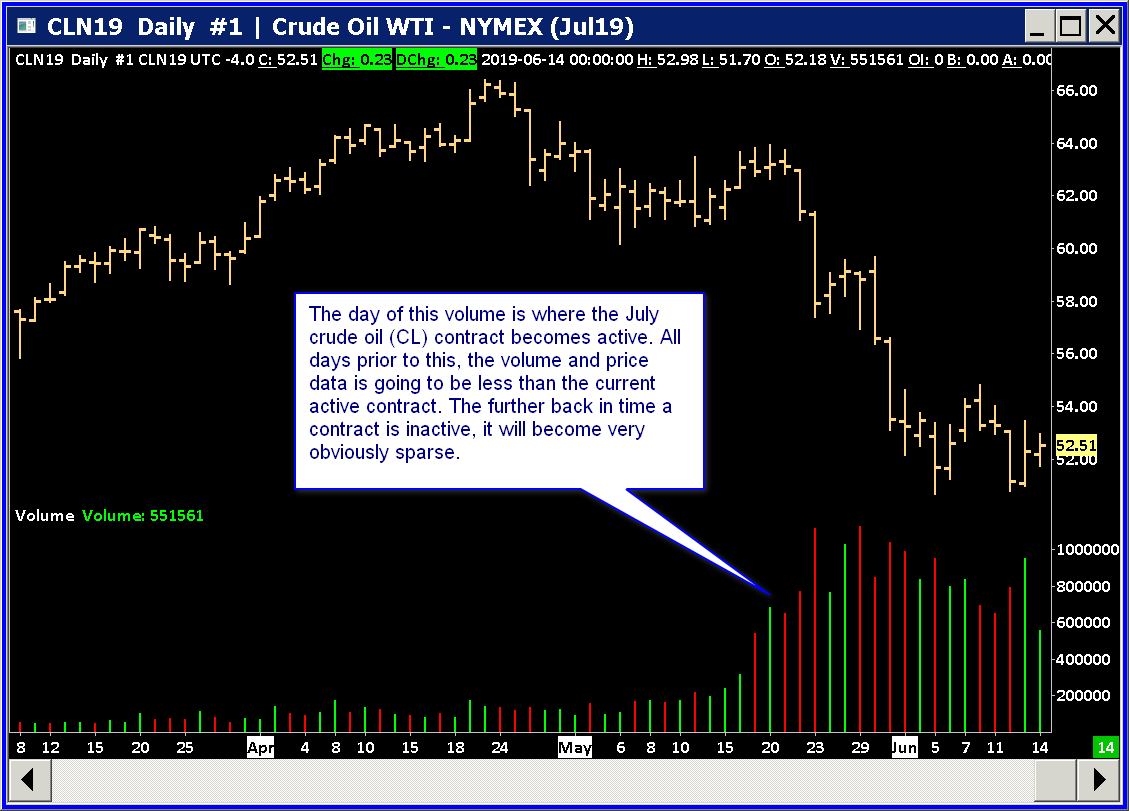
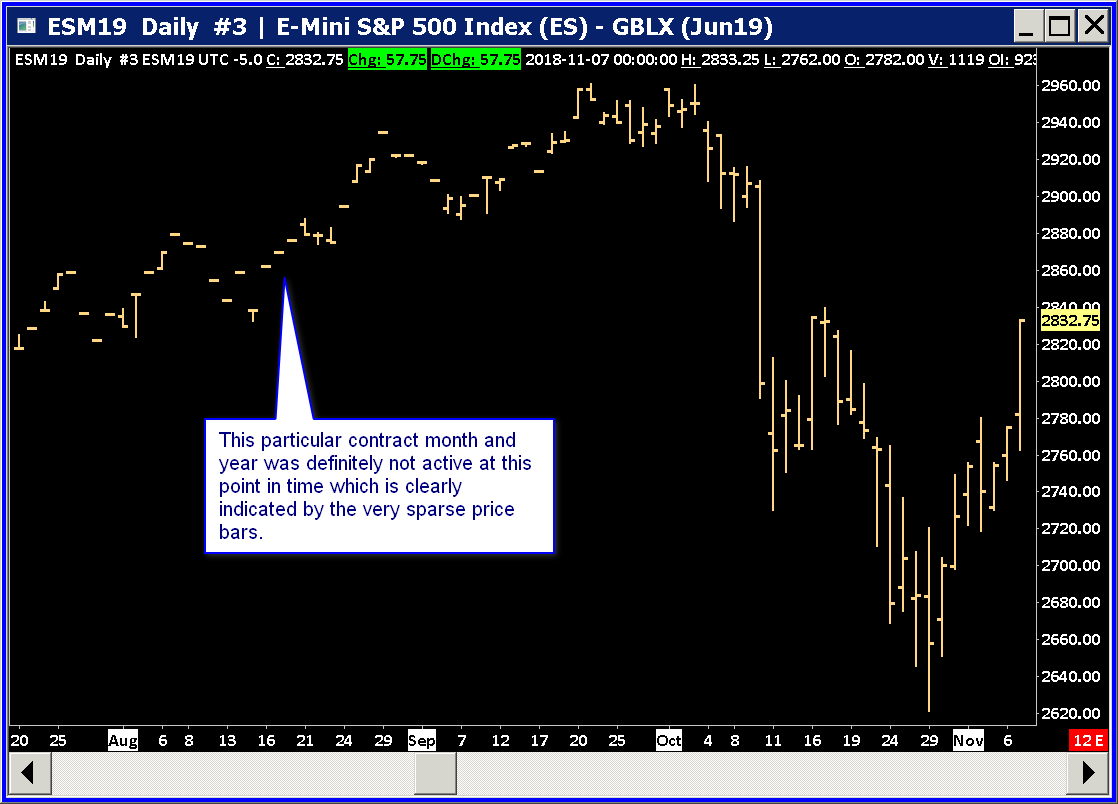
A standard futures contract symbol is for a specific delivery month and year. Example ESZ14 (S&P 500 mini futures for December 2014). Futures contracts have a limited life. A futures contract chart for a particular symbol, normally does not go back very far in time.
When you look at a futures contract chart back in time to a point where that particular delivery month and year was not the actively traded one, the bars usually will look incomplete (may look like dashes) and have low-volume. Refer to the below two screenshots indicating this.
The solution to have a futures contract chart that goes back far in time with complete bars at every point in time in the chart, is to use a Continuous Futures Contract chart which joins together multiple futures contracts. For every bar in this kind of chart, the data will be for the most actively traded delivery month and year at that moment in time.
Sierra Chart provides a very powerful feature to create Continuous Futures Contract charts. Automatic back adjustment of data is supported.
It is fully supported to replay Continuous Futures Contract charts.
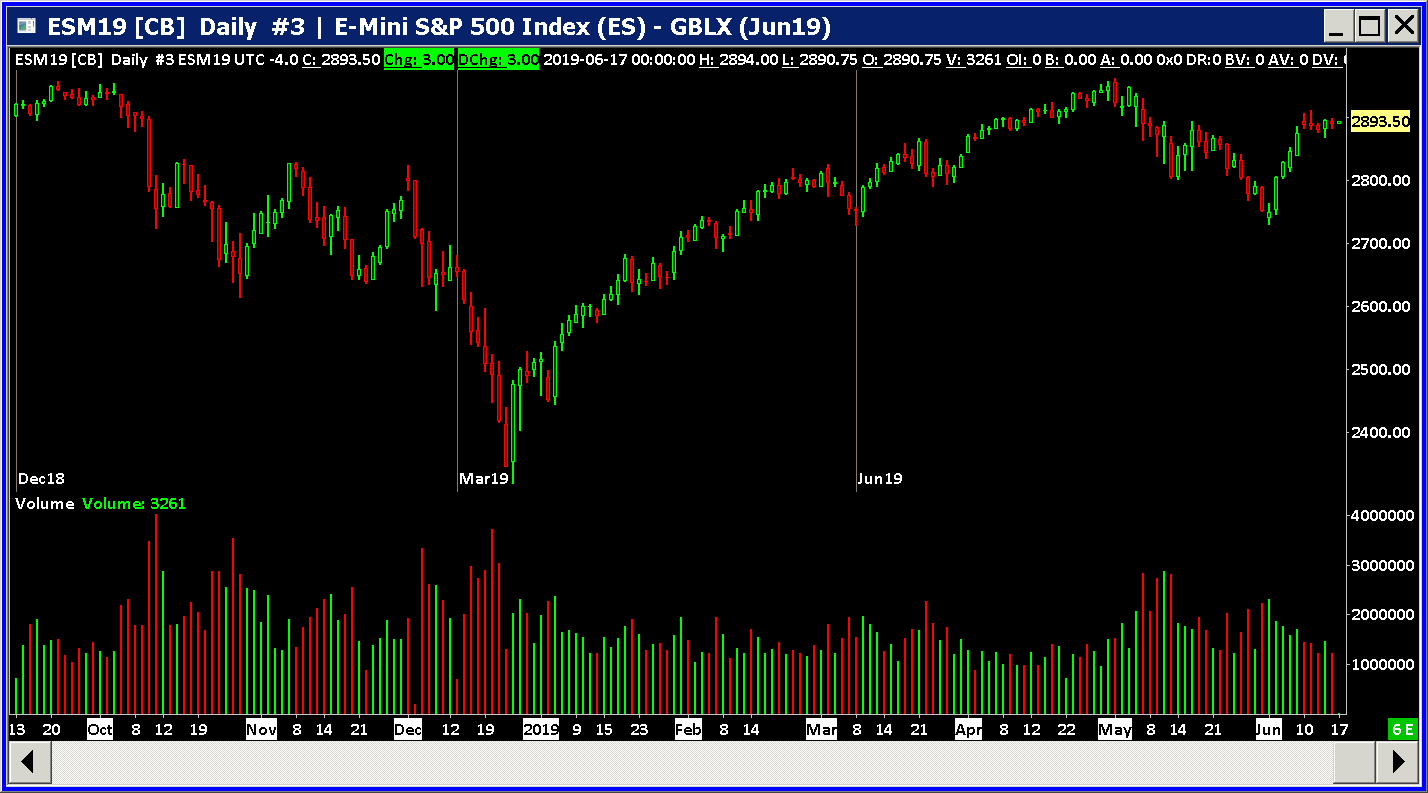
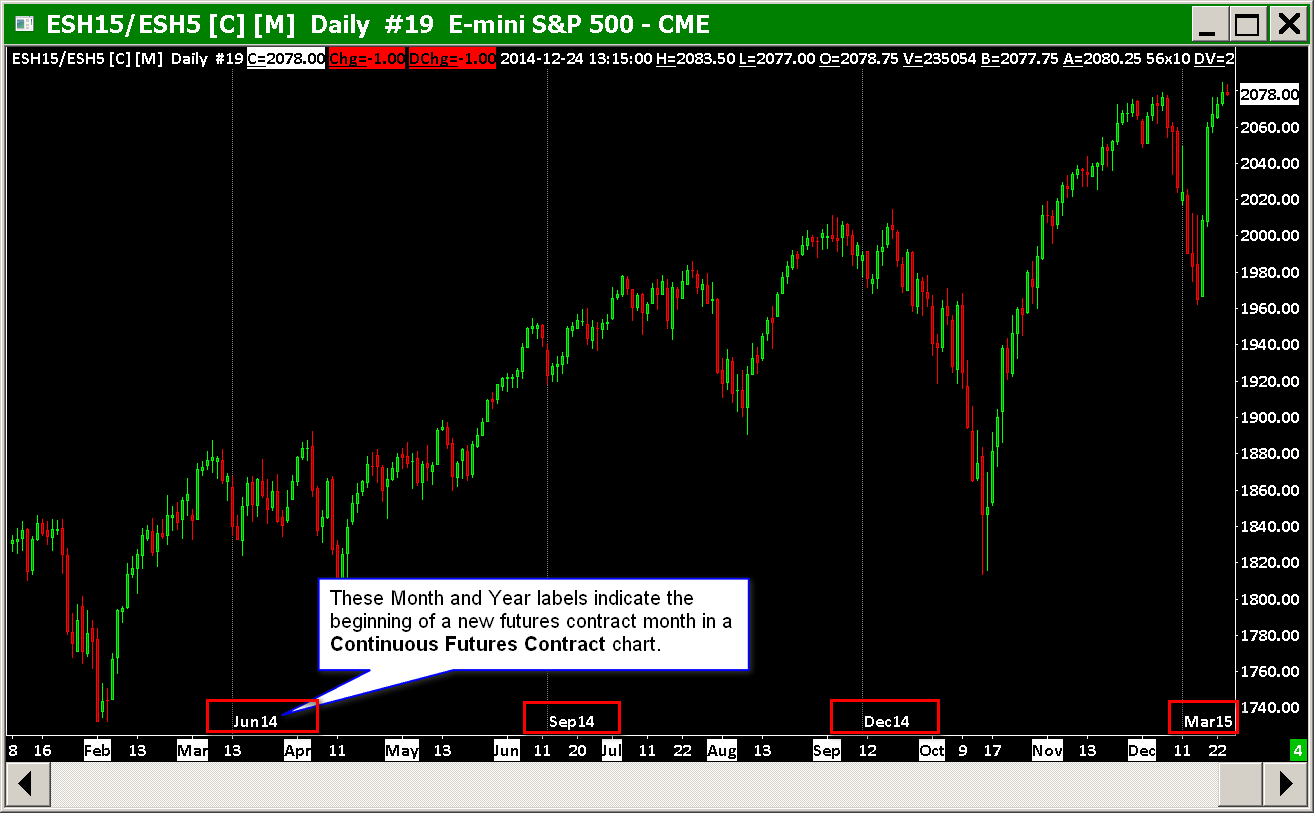
The following screenshot is an example of a Continuous Futures Contract chart.
Using Continuous Futures Contract Charts
The Continuous Contract options are a very powerful feature that activates the Continuous Futures Contract chart feature for both Historical and Intraday charts.
When one of the Continuous Contract options is selected other than None, the chart will load in historical futures contracts going back from the futures contract specified with the Symbol setting in the Chart Settings, and based upon the Use Number of Days to Load or Use Date Range Load Data Limiting Method Chart Setting.
Automatic back adjustment of data is supported.
The Continuous Futures Contract Chart feature is only for futures contracts. It is not for any other kind of market. It will not have any effect with stock, cash index, or market statistics symbols. Therefore, do not use it with these symbols because it is completely unnecessary and adds unnecessary messages to the Message Log.
Step-By-Step Instructions
- To use this feature you should be running a current version of Sierra Chart. To update Sierra Chart, refer to the Fast Update instructions.
- The Continuous Futures Contract chart feature requires a reliable historical data service with the particular Data or Trading service you are working with. If you are using a Sierra Chart provided data feed, then this will be a reliable service and provide the necessary data for the Continuous Futures Contract chart feature.
- To make sure the necessary futures contract rollover settings needed for the construction of Continuous Futures Contract charts exist, update the Global Symbol Settings as explained in the Update Symbol Settings section. This step only needs to be performed once.
- Set Global Settings >> Data/Trade Service Settings >> Common Settings >> Download Total Volume for All Contracts for Futures Daily Data to No. This is essential!.
- Connect to the data feed if Sierra Chart is not already connected. Select File >> Connect to Data Feed on the menu.
- Open or go to either a Historical or an Intraday chart. If you do not have a chart open, open one with File >> Find Symbol. With a Historical chart, you can look at Daily, Weekly, Monthly, Quarterly, and Yearly time frames per bar.
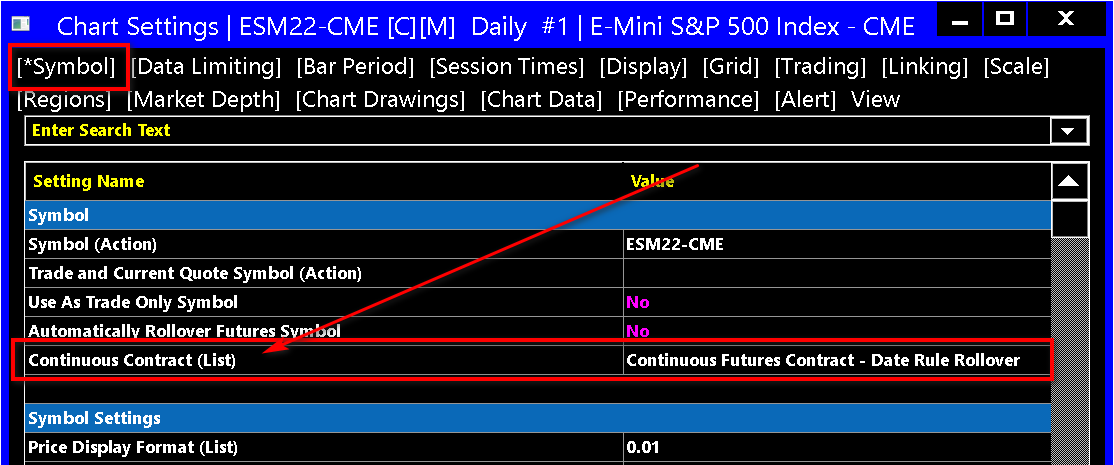
- To enable this option, select Chart >> Chart Settings >> Symbol. Select one of the Continuous Contract options. Refer to the image below.
- Choose one of the Continuous Futures Contract Rollover Options in the Continuous Contract list.
- Select the Symbol tab.
- You must use a standard futures contract symbol for the chart. For example: ESM23-CME. Make certain the Symbol is not a continuous contract symbol. Do not use a symbol with a # in it.
- Make certain the Symbol is set to the current futures contract month assuming that you want the latest contract month at the end of the chart. If the Symbol is set to a further forward futures contract symbol that is not currently actively traded, then this can cause a problem with the construction of the chart.
- Set Data Limiting >> Days to Load for Historical/Intraday Chart Data Type sufficiently high enough to see the number of days that you want in the chart. Keep in mind the higher this number, the longer the chart will take to load in historical data.
It can be a disadvantage to increase this number too large. It takes longer to download the data and increases the possibility of historical data ddownloading errors because data may be requested for older contracts for which there is no data. Related to this: Preventing Error Messages by Reducing Days to Load in Chart. - Press OK to close the Chart Settings window. The necessary chart data will be downloaded if needed, and the chart will be created. You will see Downloading Continuous Contract Data displayed on the chart during the downloading process.
- If there any missing contract months in the chart, missing Daily or Intraday data, the back adjusted prices are incorrect, or a rollover date is significantly off from where it should be, then Re-download the Continuous Futures Contract Data in the chart since there is missing, incomplete or inaccurate data necessary to build the Continuous Futures Contract chart.
Continuous Futures Contract Rollover Options
The descriptions of the available Chart >> Chart Settings >> Symbol >> Continuous Contract rollover options are as follows:
None
The Continuous Futures Contract feature for the chart is disabled. This should be the setting for symbols that are not futures contracts or if you do not want to use this feature.
Continuous Futures Contract - Date Rule Rollover
This option will create a Continuous Futures Contract chart. The transition date from one futures contract to the next is determined by a specific rollover rule defined for the symbol. This works very well for stock index futures. This method is a little faster than Volume Based Rollover because there is slightly less time involved because there does not have to be an analysis of the volume across futures contracts loaded in the chart to determine the rollover dates.
The rollover rules are programmed in the Global Symbol Settings. It is not recommended to change the rollover rule for a symbol unless you specifically have a need to do so and you understand the changes you are making. If the rollover rule is not set correctly for a symbol, it might cause the building of the Continuous Futures Contract to not work properly.
Continuous Futures Contract - Volume Based Rollover
This option will create a Continuous Futures Contract chart and the transition date from one futures contract to the next is determined by when the daily volume, as determined from the historical Daily chart data for the symbol, becomes greater from one contract to the next at a particular day. At that particular day, the rollover occurs. This method is preferred for commodity futures which do not have a very definite calendar-based rollover rule and the rollover date can vary from one rollover to the next.
Continuous Futures Contract - Date Rule Rollover, Back Adjusted
This option is the same as Continuous Futures Contract - Date Rule Rollover, and in addition, prior futures contract months loaded into the chart are back adjusted.
When there is a rollover from one futures contract to the next, on the day of the rollover, the difference between the newer futures contract settlement price from the prior day and the prior futures contract settlement price from the prior day is calculated. This is the back adjustment amount between those two contracts.
At the very first rollover in the chart, the back adjustment amount is calculated for that rollover and all of the subsequent rollovers.
At each rollover, the back adjustment amount for that particular rollover and all of the rollovers forward from that rollover, are added together. This total amount is the amount by which the prior contract is adjusted by. This process continues itself going forward through the contract months.
The futures contract settlement prices from the prior day at the date of the rollover are determined from the historical Daily chart data for the symbol.
Continuous Futures Contract - Volume Based Rollover, Back Adjusted
This option is the same as Continuous Futures Contract - Volume Based Rollover, and in addition, prior futures contract months loaded into the chart are back adjusted. The method by which back adjustment is performed, is explained in the description for the prior option.
Continuous Futures Contract - Rollover Each Year. Same Month
This option means that the particular contract month used in the Continuous Futures Contract chart will be the same month as the current symbol of the chart set through Chart >> Chart Settings.
The rollover date, will be the standard rollover date for the particular contract month for the futures symbol.
So if the current symbol is a June contract, that means each of the prior years in the chart, will also be the June contract month but for those years.
Displaying Rollover Transition Times and Contract Months
When viewing a Continuous Futures Contract chart it is essential to understand where in the chart there is a transition from one futures contract month to the next and what the contract year and month is for a particular date in the chart.
One reason this is very important is because for a particular date, a futures contract for one delivery year and month will have different pricing compared to other contract months for the same underlying futures market.
This different pricing will cause differences in the price relationships from one contract month to the next especially if the chart bars are not back adjusted.
Another reason this is important is to clearly identify any problems where there is an incorrect transition from one contract month to the next.
In Intraday charts, transitions from one contract month to the next occur at the Chart >> Chart Settings >> Session Times >> Start Time set for the chart. In the case where the Session Times >> Start Time and Session Times >> End Time are reversed or when using the Evening Session times, this means that the rollover will occur in the prior trading day. For further information, refer to Session Times. It is important to be aware of this.
To view these transitions, as vertical lines with labels indicating the beginning of a specific contract month and year, go to the chart and enable Chart >> Show Rollover Dates.
Therefore, use this feature to understand where the transition occurs from one contract month to the next.
Refer to the image below for an example.
If there any missing contract months in the chart, the back adjusted prices are incorrect, or a rollover date is significantly off from where it should be, then Re-download the Continuous Futures Contract Data in the chart since there is missing, incomplete or inaccurate data necessary to build the Continuous Futures Contract chart.
In the case of the first bar loaded in a chart, this will always show a vertical line and the contract year and month at the bottom to indicate the contract year and month from that bar forward.
Current Day Always Uses Contract Month of Symbol of Chart
The chart bars for the current day in an Intraday Continuous Futures Contract chart from the Session Times >> Start Time for the chart, or the last bar in a Historical Daily chart, will always be for the symbol the chart is set to.
This is so you always see the current days data for the symbol of the chart even if it is not the most actively traded symbol at the current time.
Therefore, when the next day comes, and the chart is reloaded with Chart >> Reload and Recalculate, you reopen the Chartbook, or restart Sierra Chart, what was previously the current day is now the previous day and if the current symbol of the chart is not the actively traded contract, then that previous days chart bars will then change to the prior contract month.
This is something to be aware of because it will cause a change in values. The solution to this, is to not use the Continuous Futures Contract feature on a chart when you are looking at a futures contract symbol which currently is not the actively traded contract month.
However, if the contract month of the chart is the actively traded contract month and there is a significant difference in the rollover timing between a Date based rollover and the Volume based rollover, then make sure you are using the Volume Based Rollover setting for the Continuous Futures Contract option to eliminate the effect of what is described here.
Automatic Advancing of Chart Symbol for Unsupported Contract Month to Next Contract Month
For some commodity markets, there are certain contract months which are not actively traded. For example with Soybeans, the August contract is never an active futures contract month.
Therefore, this contract month will never be included in a Continuous Futures Contract chart. Only the next contract month which is November will be included. If the chart symbol is set to a contract month which is not part of the contract months used in a Continuous Futures Contract chart for the particular futures market, then it will be automatically advanced to the next supported month. Although the symbol of the chart will still show the entered symbol. However, the displayed data will be for the next supported contract month.
In this particular example August soybeans, will be internally advanced to November automatically. So the chart will display November data. This is something to be aware of.
Ongoing Effect of Back Adjustments
When using one of the Back Adjusted continuous futures contract options, as time goes by, the prices of the contract will change for a particular date and contract month.
For example, the current contract will have unadjusted prices but 10 years from now, if using back adjustments, it will have a very different price with all of the back adjustments applied cumulatively.
To avoid this problem do not use one of the Back Adjusted options.
Automatically Rolling Over to Next Futures Contract Month
The Continuous Futures Contract feature in Sierra Chart does not automatically roll forward the current futures contract symbol of the chart to the next contract when it expires or when the trading volume becomes higher in the next futures contract month (Chart >> Chart Settings >> Symbol).
This feature is used to load in historical futures contracts, if necessary, based upon the number of days of data loaded into the chart. The Rollover Options control the rollover from one contract to the next, for historical futures contracts within the chart. They have no effect upon automatically rolling over the current symbol of the chart.
To automatically rollover the futures contracts symbol of a chart, use the Automatically Rollover Futures Symbol setting in Chart >> Chart Settings. However, you need to understand that setting before using it.
Setting Rollover Time to Match Session Times
In newer versions of Sierra Chart the rollover from one contract month to the next in Intraday charts will be according to the Session Times set for the chart.
The rollover will be at the Session Times >> Start Time. If this is set to a time other than 00:00:00, then the rollover will occur at that time. If the Session Times are reversed, then the rollover will be in the prior trading day at that time.
Re-Downloading Continuous Futures Contract Data
- After the Continuous Futures Contract chart data loading is complete, if you notice missing data, price gaps (related to missing data), significantly invalid price values, out of order timestamps along the timescale at the bottom of the chart, incorrect transition Date-Times from one contract to the next, or the back adjustments are incorrect or do not occur in the chart, then you will need to re-download the data in the chart.
Incorrect Symbol Settings can also cause incorrect an transition Date-Time to the next contract month, missing data, and incorrect prices.
You can identify the specific contract months which may have missing data and exactly where the transition occurs from one contract month to the next in the chart, by enabling Chart >> Show Rollover Dates. When this option is enabled, then where a new contract month begins in the chart, there is a vertical line drawn and a Month and Year displayed at the bottom of the line.
Therefore, you will know specifically what contract month is being displayed at each bar in the chart. For further information, refer to Displaying Rollover Transition Times and Contract Months. - To make sure the necessary futures contract rollover settings needed for the construction of Continuous Futures Contract charts exist, update the Global Symbol Settings as explained in the Update Symbol Settings section. This step only needs to be performed once.
- Set Global Settings >> Data/Trade Service Settings >> Common Settings >> Download Total Volume for All Contracts for Futures Daily Data to No. This is essential!.
- Mandatory Step: This step is absolutely mandatory because it rules out any problems with incorrect Symbol Settings (rollover rules and price multiplier) which can cause various issues in Continuous Futures Contract charts. Select Global Settings >> Symbol Settings. Uncheck Use Custom Symbol Settings Values. Press OK.
- In the case of missing data, the first step is to go to the chart, and once it is active, select Chart >> Reload and Recalculate from the menu to see if that loads in the missing data. If that corrects the problem, and there are no price gaps (related to missing data), no significantly invalid price values, or out of order timestamps along the timescale of the bottom of the chart, then stop here.
- Select Chart >> Chart Settings >> Data Limiting. Set the Load Data Limiting Method: Days to Load >> Days to Load for Historical/Intraday Chart Data Type sufficiently high enough to see the number of days that you want in the chart.
Press OK. Keep in mind the higher this number, the longer the chart will take to load in historical data.
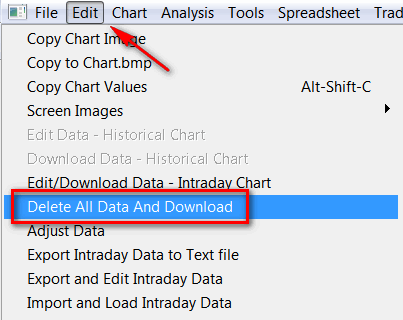
It can be a disadvantage to increase this number too large. It takes longer to download the data and increases the possibility of historical data ddownloading errors because data may be requested for older contracts for which there is no data. Related to this: Preventing Error Messages by Reducing Days to Load in Chart. - The next step is to select Edit >> Delete All Data And Download on the menu.
No longer applicable in current versions: If you are using a sub instance of Sierra Chart connected to a DTC Server, which will be the case if you started the instance of Sierra Chart you are currently using with File >> New Instance, then you must perform this step and the remaining steps in the main DTC Server instance of Sierra Chart. Once that is done, then perform these steps in the sub instance again. For additional information, refer to Historical Data and Missing Historical Data. - A Multiple Symbol Selection Window will be displayed listing all of the symbols loaded into the Continuous Futures Contract chart. Refer to the image below.
By default only the three most recent symbols are selected. Left click on a symbol to select or unselect it, or use the Select All or Unselect All buttons to select all the symbols or unselect all the symbols.
This way you can control whether you want to re-download data for a particular symbol, some of the symbols or all symbols.
Press the Select All button to select all of the symbols, if there is any uncertainty as to how much data you should download or you want to re-download data for all contract months.
Always select all of the symbols when there are significantly invalid price values in the chart. You can unselect a particular futures contract symbol if you are sure there is not any missing data for that symbol and the price values are correct for it.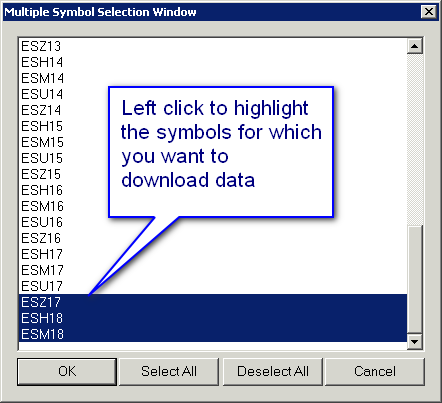
- In the case of an Intraday chart, if it requires Historical Daily chart data files which would be the case if it is back adjusted, then if you only want to re-download data for the Historical Daily chart data files, then enable the option Download for Daily Data Files Only. Otherwise keep this disabled.
- Press OK to re-download data for the selected symbols.
- To improve performance, while the historical data is being downloaded, it is recommended to close the Chartbooks with File >> Close All Chartbooks until the historical data downloading is complete. You can monitor the historical data download progress through the Window >> Message Log window.
Basic Steps to Correct Invalid Back Adjust Amount for Most Recent Transition to New Contract Month
Follow the basic instructions below to resolve an incorrect back adjustment amount at the most recent rollover for a chart which uses a Back Adjusted Rollover Option.
- Update to the current version. Refer to Fast Update. You will need version 2615 or higher.
- Set Global Settings >> Data/Trade Service Settings >> Common Settings >> Historical Daily Data >> Historical Daily Data Download Time to 17:55 US Eastern time.
- Update the Symbol Settings.
- Go to the chart. Set the Chart >> Chart Settings >> Symbol >> Continuous Contract option to one of the Volume Based Rollover options.
- From the top menu, select Edit >> Download Data from End of Chart. For more information, refer to Download Data from End of Chart.
- Once the downloads complete, the chart will be automatically reloaded. At this time the problem should be resolved.
Trade Order Fill Display Issues
In the case of a Continuous Futures Contract chart, it is essential to understand for each day in the chart, what contract month is it. To do this, refer to Displaying Rollover Transition Time and Contract Months.
Order fills are loaded for the current Symbol of the chart. When order fills are loaded for the current symbol of the chart, and when they are displayed on a prior contract month which is a different symbol than the symbol of the fill, they will not be aligned to the prices of the chart bars.
There are two solutions to this problem. One solution is to enable the Load Order Fills for Multiple Futures Contracts setting in the Chart Settings window.
Another solution is to use the Order Fills Start Date-Time settings and set those to prevent loading order fills for Dates which are earlier than the days loaded in the chart for the current symbol of the chart in a Continuous Futures Contract chart.
Incorrect Rollover Date
There can be different reasons, why the transition from one futures contract month to the next in a Continuous Futures Contract chart may be incorrect or seemingly incorrect.
- The first thing to do is to make sure the Symbol Settings are correct for Date based rollovers. And to disable the use of Custom Symbol Settings Values. To do this, follow the Update Symbol Settings section. After this is done, reload the chart with Chart >> Reload and Recalculate.
If you have changed the Rollover Method settings for the symbol pattern of the chart in the Global Settings >> Symbol Settings, then remove those unless you are certain the settings you have used are correct. - Make sure there is no missing data in the chart or in the Historical Daily data used in the background, if there is, then refer to Re-Downloading Continuous Futures Contract Data.
- When you have changed the symbol of the chart to the next or other forward futures contract month but that is not the active a month based upon trading volume and you are using a volume-based rollover Continuous Contract setting, then the chart will rollover according to the Date based rule instead in this circumstance. This can make it look like the rollover, is not correct based on volume.
Or instead the rollover date may not be be correct for other reasons.
In either case, the solution in this case, is to change the symbol of the chart, back to the active contract month.
Handling Specific Error Messages
This section explains the steps to follow when receiving specific error messages for a Continuous Futures Contract chart in the Sierra Chart Window >> Message Log, like the following:
ZNU16 [CBV] Daily #3 | Error while getting daily settlement price with date 2014-12-22 from file. C:\SierraChart\Data\ZNH15.dly. Error: Date not found.
For the above error message, re-download the data for the mentioned symbol and contract month, following these instructions:
However, if the problem is that there is not enough historical data available for the particular contract, then refer to the Preventing Error Messages by Reducing Days to Load in Chart instructions instead. Be sure to follow those instructions and reduce the Days to Load setting in the chart to prevent error messages from occurring every time the chart is loaded.
 Unable to determine transition date based on volume from files: ZBU14.dly, ZBZ14.dly
 The ZBZ14.dly symbol may not be the active contract month.
For the above error message, re-download the data for the mentioned symbols/contract months, following these instructions:
ZNU16 [CBV] Daily #14 | Limiting the number of years to download historical data for to 10 years for the continuous futures chart. Reason: Account limitation
For the above error message, select Chart >> Chart Settings>> Data Limiting. Set the Load Data Limiting Method: Days to Load >> Days to Load for Historical/Intraday Chart Data Type to a value less than the number of days in 10 years.
TSLA [CB-D] 15 Min #11 | No contract months found for symbol. Unable to build continuous futures contract chart. | (Date-Time)


TSLA [CB-D] 15 Min #11 | There are no continuous futures contract symbols. Loading data normally. | (Date-Time)
Some symbols do not support Continuous Futures Contract charts. In this case you will see [CB-D] displayed after the symbol. Set the Chart >> Chart Settings >> Continuous Contract setting to None.
Preventing Error Messages by Reducing Days to Load in Chart
If you see a large number of messages like the following in the Window >> Message Log, then this is likely because the Chart >> Chart Settings >> Data Limiting >> Load Data Limiting Method: Days to Load >> Days to Load for Historical/Intraday Chart Data Type is set too high and beyond the available historical data for the symbol.
Remember that some futures contracts are relatively new like micro contracts and they have a limited amount of historical data.
[symbol] [CB] Daily #2 | File [symbol].dly has a volume of 0 at (Date). | (Date-Time)

Unable to determine transition date based on volume from files: [symbol], [symbol].dly | (Date-Time)
The [symbol].dly symbol may not be the active contract month. | (Date-Time)


[symbol] [CB] Daily #2 | Error while getting daily settlement price with date (Date) from file. C:\SierraChart\Data\[symbol].dly. Error: Date not found | (Date-Time)

[symbol] [CB] Daily #2 | Error while getting daily settlement price with date 0 from file. C:\SierraChart\Data\[symbol].dly. Error: No Data for read. End of file. | (Date-Time)
 Unable to determine transition date based on volume from files: [symbol].dly, [symbol].dly | (Date-Time)
 The [symbol].dly symbol may not be the active contract month. | (Date-Time)
The solution is to reduce the Chart >> Chart Settings >> Data Limiting >> Load Data Limiting Method: Days to Load >> Days to Load for Historical/Intraday Chart Data Type setting to the number of days which there is historical data available for the symbol, and the amount of data that you require.
This is something that you must do to prevent these excessive messages displayed in the Message Log repeatedly when charts are loaded. For example, for these new CME micro stock index futures contracts, the Days to Load setting cannot be before the starting date for these contracts.
There is a very real and detrimental data storage and performance impact, from loading a large amount of data in a Continuous Futures Contract Chart. Keep the number of days loaded to the absolute minimum.
Text Indicator Description Table
When the Continuous Contract option is set to one of the Continuous Futures Contract options, a [C], [CB], [CV], or [CBV] is displayed after the symbol of the chart in the Region Data Line and on the title bar of the chart window.
Refer to the table below for descriptions.
| C = Continuous. |
| B = Back adjusted. |
| V = Volume-based rollover. |
| CV-D. D means disabled. When the Continuous Futures Contract feature has been disabled on a chart, like in the case where there are not Symbol Settings for the symbol, a -D will be displayed after the other text indicators. |
Notes
- Unlike some Data services which use continuous futures contract symbols (for example @ES# for IQ Feed), the Continuous Futures Contract feature in Sierra Chart dynamically joins together individual futures contracts which exist as separate files.
The advantage of this is that if you are back adjusting the data, you do not have to re-download the entire historical data for the chart at the time of a futures contract rollover to get updated back adjusted data. Since the back adjustment is done dynamically in memory. The original prices are also preserved and never modified in the chart data file.
Therefore, any changes to back adjustment calculations can be dynamically done without actually modifying data.
To recalculate the back adjustments and update the chart, simply select Chart >> Reload and Recalculate. It is that easy.
Additionally, you are also able to modify the rollover dates by changing the General Settings >> Symbol Settings >> Rollover rules for the symbol.
The method used by Sierra Chart to create the Continuous Futures Contract charts and do back adjusting, has no additional overhead compared to Continuous Futures Contract data on the server. And rather than having one large data file for a Continuous Futures Contract chart, there are multiple files which are easier to manage.
Now that this feature has been in use for more than 2.5 years, we can unequivocally say that it is far more efficient, orderly, and flexible to generate Continuous Futures Contract charts on the client-side from individual futures contract files rather than maintaining the data on a server. - When transitioning from one futures contract to the next, the transition from the current futures contract being processed will only occur within the last two months of that particular contract month.
- The transition point from one contract month to the next in a Historical Daily, Weekly, Monthly, Quarterly chart occurs at the particular date according to the date rollover rules or volume depending upon the particular Continuous Futures Contract option you have selected.
- The transition point from one contract month to the next in an Intraday chart occurs at the particular date according to the Date rollover rules or Volume depending upon the particular Continuous Futures Contract option you have selected. In Intraday charts, transitions within a particular Date from one contract month to the next occur at the Session Times >> Start Time which is controlled by the Session Times in the chart.
- In the case of a Continuous Futures Contract chart and Weekly bars, a Weekly bar will contain data from two different contracts around the point of rollover.
- Back Adjustments of Historical Futures contracts in Chart: If the current symbol of the chart is not considered the current futures contract based upon the Date rules or Volume rollover rules, then the back adjustments for the Continuous Futures Contract chart will not be correct because they cannot be completely calculated. Therefore, in order to use the back adjustment options, the current symbol of the chart must be the active futures contract month based upon the Date rules or Volume rollover rules.
Continuous Futures Contract Charts with Skipped Month
Some futures markets have contract months which are not actively traded. For example, in the case of CBOT Soybeans, the listed contract month letters are as follows: FHKNQUX. Although in the case of when building a Continuous Futures Contract chart, only the following contract months are included: FHKNX in that chart.
When the symbol of the chart is set to a contract month which is not one of the ones included in a Continuous Futures Contract Chart, then that month will not be included but the following month will be instead.
Controlling Rollover Amount for Back Adjustments
When using one of the Back Adjusted Continuous Futures Contract options, when there is a rollover from one futures contract to the next, on the day of the rollover, the difference between the newer futures contract Settlement price from the prior day and the prior futures contract Settlement price from the prior day is calculated.
This is the back adjustment amount between those two contracts. The settlement prices come from Historical Daily data for the futures contracts, not from Intraday data.
The closing/settlement prices cannot be used because those are calculated by the exchanges using certain algorithms and will not produce correct price differences between one futures contract to the next. While using settlement prices may seem like the correct method in certain futures markets, the problem is this is certainly not a universally reliable method to compute the back adjustment amounts. Overall it is inherently unreliable because the settlement is not the final trade price of the day.
The settlement prices are the only accurate method of doing this. The reason for the price difference between one futures contract month to the next relates to the cost of carry which also includes interest rates.
Furthermore, we must make it clear that the exchanges do not provide any official data about what is the correct back adjustment amount from one futures contract to the next since this concept is not something, to our knowledge, accepted by exchanges.
Below is an example of what you will see in the Sierra Chart Message Log for the back adjustment calculations. To see these calculations displayed, follow these instructions:
- Enable Global Settings >> General Settings >> Log >> Detailed Continuous Futures Contract Chart Logging.
- Press OK.
- Go to the Continuous Futures Contract chart and reload it by selecting Chart >> Reload and Recalculate.
- Select Window >> Message Log to open the Message Log if it is not already open.
- Scroll to the bottom of the Message Log.
- You will see messages like the following:
ZWH16 [CBV] Daily #2 | Symbols used for continuous contract chart: |
 ZWZ15 |
 ZWH16 |
ZWH16 [CBV] Daily #2 | Checking for volume based rollover dates. |
ZWH16 [CBV] Daily #2 | Volume based rollover from ZWZ15 to ZWH16 occurs at 2015-11-17 |
ZWH16 [CBV] Daily #2 | Performing continuous futures contract back adjustment calculations. |
ZWH16 [CBV] Daily #2 | ZWZ15 Settlement price on 2015-11-17 is 493.5. |
ZWH16 [CBV] Daily #2 | ZWH16 Settlement price on 2015-11-17 is 493.5. |
ZWH16 [CBV] Daily #2 | ZWZ15 price difference to ZWH16 is 0. |
ZWH16 [CBV] Daily #2 | Back adjust amount for symbol ZWZ15 is 0. |
These messages can be generated at any time for a Continuous Futures Contract chart by selecting Chart >> Reload and Recalculate.
For both Historical Daily charts and Intraday charts, the Settlement prices are determined from the Historical Daily chart data files.
Instructions for Entering Settings for Controlling Rollover Amount
In the particular example Message Log above, if you wanted to adjust the actual back adjustment amount for the transition from the ZWZ15 futures contract symbol to the ZWH16 contract, then follow the instructions below for this.
- Before following these instructions, it is a good idea to re-download the data for the two contract months where you want to adjust the back adjustment amount between those contract months. Refer to Re-Downloading Continuous Futures Contract Data. This may correct any error with the back adjustment amount. If it does, then stop here.
- Select Global Settings >> Symbol Settings.
- In the list of Symbols, select the symbol or symbol pattern that you want to adjust the back adjustment amounts for.
- In the list of Symbol Settings, select the Custom Continuous Contract Back Adjustment Amounts setting.
- In the Custom Continuous Contract Back Adjustment Amounts edit box, you will want to enter the futures contract symbol and amount as an actual price value, to add to the existing back adjustment amount already calculated by Sierra Chart for the particular futures contract month just before the rollover to the next contract. The symbol and the amount need to be separated by an equals (=) sign. To subtract, use a negative value.
For example, in the case of the rollover from December wheat to March wheat, if you want to add .5 to the existing back adjustment amount then you would enter ZWZ15 = .5. Additional back adjustment amounts can be entered by separating them with a comma (,) character. Refer to the image below for an example. The image below shows an adjustment to GC June gold.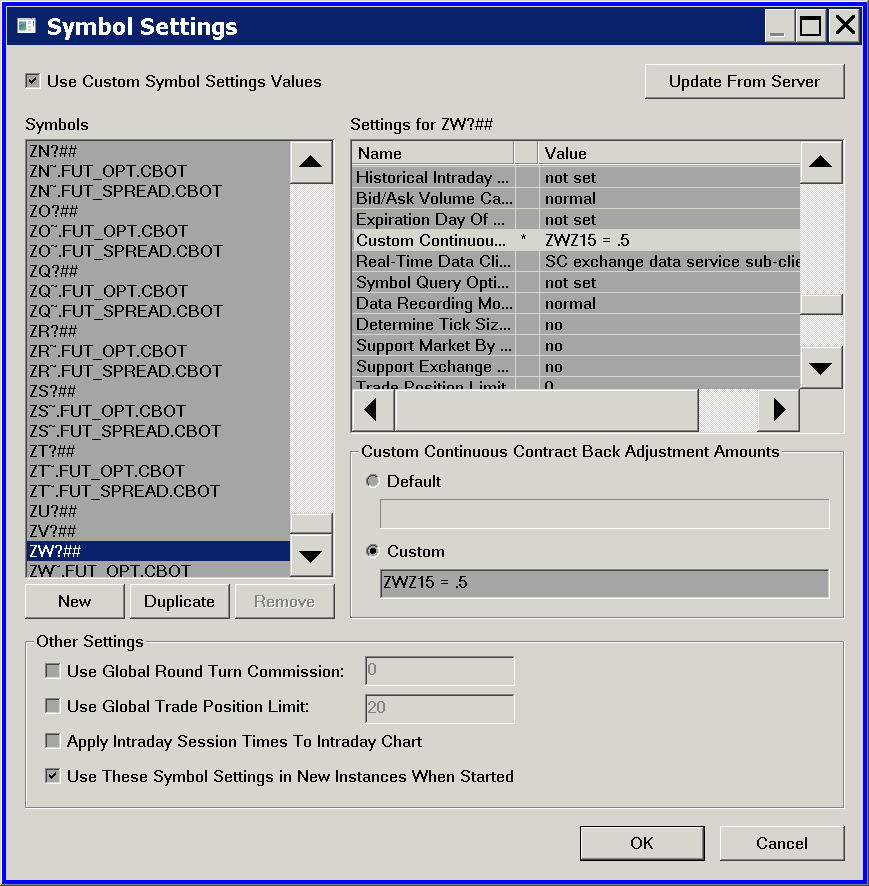
- Enable the Use Custom Symbol Settings Values option.
- Press OK to close Global Symbol Settings window.
- Go back to the chart and select Chart >> Reload and Recalculate.
Understanding Back Adjusted Price Data and Comparisons
Continuous Futures Contract charts which use back adjustments will have price data for prior contract months adjusted either up or down relative to the price difference to the next contract month in the chart. The most recent contract month in the chart is not adjusted. For information about how the calculations are done, refer to Continuous Futures Contract Rollover Options.
These adjustments are going to cause differences when comparing to a chart within Sierra Chart that does not use back adjustments. Or when you are comparing to a chart from a completely different service which uses a different method of back adjusting. This is important to understand.
It is also important to understand what particular contract month you are looking at, at each bar in the chart. For information about this, refer to Displaying Rollover Transition Times and Contract Months.
You also have the ability to adjust the price adjustment amount at each transition from one contract month to the next. For instructions, refer to Controlling Rollover Amount for Back Adjustments.
Finally, if there is an inaccuracy with the back adjustment price amount between contract months in the chart, then re-download the data from one month before the first contract month in the chart which is not accurate, all the way to the last contract month loaded in the chart. To do this, refer to Re-Downloading Continuous Futures Contract Data.
Verifying Correct Back Adjustment Amounts
Follow the instructions below to verify the correct back adjustment amounts, when using one of the Back Adjusted Continuous Contract options.
- Follow the instructions to Update Symbol Settings. Be sure to disable the Use Custom Symbol Settings Values setting in the Global Symbol Settings. The step is necessary to avoid any problems with user changed rollover settings which cause incorrect transition dates or back adjustment amounts.
In this case it is recommended to use a Historical Chart and not Intraday. - Follow the instructions to set up a Continuous Futures Contract chart if this has not already done.
- Enable Chart >> Show Rollover Dates. For more details, refer to Displaying Rollover Transition Times and Contract Months.
- Set Global Settings >> General Settings >> Log >> Detailed Continuous Futures Contract Logging to Yes.
- Set the Continuous Contract option in the Chart Settings to Continuous Futures Contract - Date Rule Rollover, Back Adjusted.
- Select Window >> Message Log to open the message log.
- Scroll to the bottom of that log if not already.
- You will see messages like the following in the log:
ESM22-CME [CB][M] Daily #1 | ESH22-CME Settlement price on 2022-03-09 is 4275.25. ESM22-CME [CB][M] Daily #1 | ESM22-CME Settlement price on 2022-03-09 is 4266.75. ESM22-CME [CB][M] Daily #1 | ESH22-CME price difference to ESM22-CME is -8.5. ESM22-CME [CB][M] Daily #1 | Back adjust amount for symbol ESH21-CME is -43.75. ESM22-CME [CB][M] Daily #1 | Back adjust amount for symbol ESM21-CME is -34. ESM22-CME [CB][M] Daily #1 | Back adjust amount for symbol ESU21-CME is -24.5. ESM22-CME [CB][M] Daily #1 | Back adjust amount for symbol ESZ21-CME is -15.25. ESM22-CME [CB][M] Daily #1 | Back adjust amount for symbol ESH22-CME is -8.5. - You can now see the back adjustment amount for each contract month loaded in the chart. And you can see in the chart, where each contract month begins and ends from the vertical lines at the transition Date and the Month and Year displayed at the bottom of the vertical line. For details, refer toDisplaying Rollover Transition Times and Contract Months.
- If these back adjustment amounts are not correct, then refer to Controlling Rollover Amount for Back Adjustments.
- These back adjustment amounts are added to the Open, High, Low and Close values of each chart bar. If the back adjustment amount is negative, then the Open, High, Low and Close values become lower.
- Set the Continuous Contract option in the Chart Settings to Continuous Futures Contract - Date Rule Rollover.
- Manually add the back adjustment amounts to some of the chart bars Open, High, Low, and Close values to verify that the correct adjustments are performed. When we say manually add the back adjustment amounts, we simply mean use like a spreadsheet program or something to do the calculations separately and be able to reference them in the next step.
- You can verify the correct adjustments are performed by making a note of these new adjusted values and setting the chart Continuous Contract option in the Chart Settings to Continuous Futures Contract - Date Rule Rollover, Back Adjusted and seeing that you have the same results.
Using Date Rule Rollover or Volume Based Rollover?
For Continuous Futures Contract charts, Sierra Chart provides two methods to determine when to rollover from one futures contract month to the next in a chart.
Each of them is described below along with an explanation as to when you should use one instead of the other.
- Date Rule Rollover: When using this rollover method, there are specific date-based rules which is used to determine when to rollover from one contract month to the next in the chart. These are set on the Rollover tab in Global Settings >> Symbol Settings for the symbol pattern.
Use this method, when you want a very definite and specific rollover date. Using a date rule rollover is going to be faster than a volume-based rollover and avoids any issues caused by inaccurate volume data. In the case of Intraday charts, there is no reliance on the volume data in a Historical Daily chart data file when using this rollover method. - Volume Based Rollover: This is the method to use for commodity futures and more recently stock index and currency futures (ES, NQ, YM, RTY, 6E, 6B). Since these usually do not have a very definite date-based rule for when the volume transitions from one futures contract month to the next. Sometimes there can be slight variations by a day or two. For a description of how this option works in more detail, refer to the Rollover Options description.
Forward Curve Charts
Follow the steps below to create a Forward Curve chart.
- Open a Historical Chart through File >> Find Symbol >> [select symbol] >> Open Historical Chart. This needs to be a futures contract symbol. This feature will not work properly with Intraday charts. Only Historical Daily Charts.
- It is imperative, that you are using the correct symbol and only use the symbols listed in File >> Find Symbol. If the symbol is not correct, then the Forward Curve chart functionality cannot work. Check to make sure you are using the correct symbol.
- Select Chart >> Chart Settings >> Data Limiting.
- Set Load Data Limiting Method: Days to Load >> Days to Load for Historical/Intraday Chart Data Type to the number of days forward that you want a forward curve chart for. Do not set this too high.
Only set it to what is necessary because the futures contracts for forward months all have to be downloaded and will update every time Sierra Chart is restarted. Generally it is not recommended to set Days to Load higher than 365. - Set the Historical Chart Bar Period to Days and the value beside it needs to be 1. You cannot use a higher timeframe per bar than this.
- Select the Symbol tab.
- Set the Continuous Contract option to Continuous Futures Contract - Forward Curve.
- Press OK.
- To see a line only, select Chart >> Graph Draw Types >> Line On Close.
- Select Chart >> Show Rollover Dates to see which bar is which contract month.
- You have the ability to alter what particular contract months are used in a Forward Curve chart. This is done through the Global Symbol Settings. Set the Continuous Contract Months setting to the particular months you want to be included.
Limitations
- For Historical Daily charts which use 2 or more digit years in the futures contracts symbols, the maximum years back for Continuous Futures Contract charts is 50 years. For single-digit years it is 5 years.
It is important to be aware of these limits and to adjust the Chart >> Chart Settings >> Data Limiting >> Days to Load for Historical Chart Data Type setting to be well within this stated limit. The limits are less if the historical data for a particular symbol has less number of years available. - For Intraday charts which use 2 or more digit years in the futures contracts symbols, the maximum years back for Continuous Futures Contract charts is 15 years. For single-digit years it is 5 years.
- To be able to access more than 5 years of historical Intraday data in a Continuous Futures Contract Chart when the particular Trading service you are using only supports single-digit years in the futures symbols (like Rithmic), then follow these instructions:
- Install another copy of Sierra Chart following the Step-By-Step Instructions to Install Multiple Copies of Sierra Chart instructions.
- Set that installation to use the Delayed Exchange Data Feed.
- There is also a limit on the number of Historical Daily data downloads that can be done within a single calendar month. When the limit is reached, this will prevent all or some historical data for a Continuous Futures Contract Chart from being complete and will result in missing data and Message Log errors.
This is the error message which will be displayed in the Window >> Message Log:Max downloads per month exceeded. Downloads = ###. Monthly Limit: #####.
For complete details, refer to Daily Data Download Limit.
After increasing the limit, you will need to re-download the data for any symbol that is missing Historical Daily data. Once the data is downloaded, it does not need to be downloaded again.
Back Testing and Trading with Continuous Futures Chart
When performing trading from a Continuous Futures Contract chart, whether Trade Simulation Mode is enabled or not, and the chart is not replaying, the symbol for the orders will always be the current symbol of the chart.
When performing a Back Test or Chart Replay at any Date-Time in the chart, the symbol for the orders will always be the current symbol of the chart completely irrespective of the Date-Time of the chart bar the order is submitted at during the Back Test or a Chart Replay.
Therefore, when looking at the trading activity related to the trading from the chart, in the Trade Activity Log, you need to select the Symbol in the Trade Activity Log which matches the symbol of the chart, in order to see the trading activity related to the trades made from the chart. It will always be the same symbol completely irrespective of the Date-Time of the chart bar the order was submitted at.
Issues When Symbol of Chart is not Current Contract and Expires Later
When the Continuous Contract option is set to an option other than None and when the Symbol setting for the chart is not set to the current active contract month and is instead set to a contract month that is further forward in time, then this may/will result in that contract month from not being included in the chart.
To determine if this is the case, set the chart to Display Rollover Dates. You can see in the chart what is the last contract month included.
If the last contract month included in the chart is not the active contract month, and it is a Historical Daily or higher timeframe chart, then the current quote data (High/Low/Close) for the symbol of the chart, will also be included in the last bar in the chart and can cause a longer chart bar.
If the last contract month included in the chart is not the active contract month, and it is an Intraday chart, then the current data being added into the chart for the symbol of the chart, will start at the moment of the chart updating and will not correspond to the prior loaded data.
There can also be months skipped near the end of a Continuous Futures Contract chart, when using a symbol that is multiple months forward from the current contract.
In general the solution in this case is to set the Continuous Contract option for the chart to None.
*Last modified Wednesday, 08th January, 2025.