Chart Session Times
- Session Times
- Start Time
- End Time
- Use Evening Session (optional)
- Evening Start
- Evening End
- Why Reverse Session Times?
- Starting Trading Day in Prior Day
- Why Use Evening Session Times?
- Why Enabling or Disabling Use Evening Session Does Not Affect Chart Bars
- Quick Switching between the Full Session and Day Session
- Time Range of Session Times
- Always Allowing Session Times to be Set
- Load Weekend Data Setting
- Automatically Setting Session Times
- Creating Daily Bars with Custom Session Times
- Understanding Hours, Minutes, Seconds Places
- Bar Starting Times
- Start and End Times Relative to Time Zone Setting
- To Chart Only the Day Session in an Intraday Chart
- Day Session Only Daily Chart Bars
- Day Session Only Weekly Chart Bars
- Day Session Only Monthly Chart Bars
- Weekly Bars Created From Intraday Data Starting at a Particular Day of the Week
- To Chart Data That Falls Within Specific Time Ranges
- Linking Session Times Between Charts
- Session Times Automatically Changing Unexpectedly
- Session Times to Include Only the Main/Primary Trading Hours
- Filtering Out Friday Evening Data
- Understanding Trading Day Dates Based on Session Times
Session Times
This section documents setting the Session Times for Intraday charts.
To set the Session Times for a chart, go to the chart and select Chart >> Chart Settings >> Session Times. Refer to the image below.
It is not possible to change the Session times for Historical Daily, Weekly, Monthly, Quarterly and Yearly charts. For additional information about this, refer to Historical Daily Bars Session Times and Evening Session Trading.
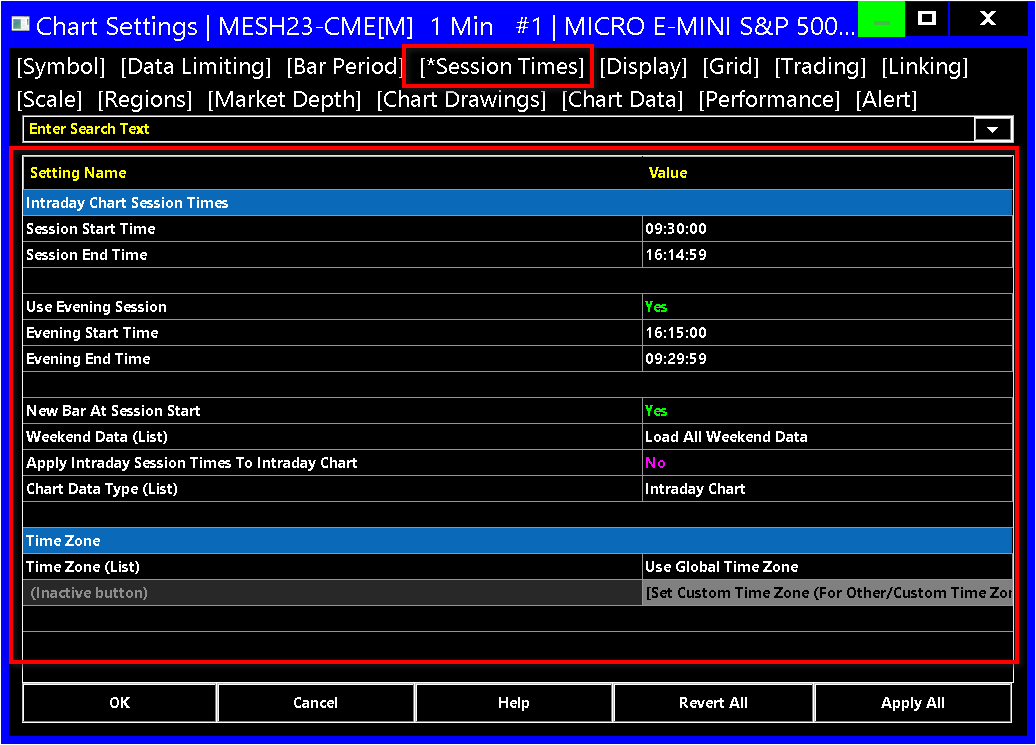
All of the Session Times settings for a chart are relative to the global Time Zone setting you have set in Global Settings >> Data/Trade Service Settings or to the chart specific Time Zone setting in Chart >> Chart Settings >> Session Times.
The chart Session Times can either be manually set as explained here or automatically set from the Global Symbol Settings.
Start Time (Chart >> Chart Settings >> Session Times)
This setting applies only to Intraday charts. This sets the starting time of data within each day to include in the chart.
The time needs to be entered in 24 hour format. Example: 09:30:00.
It is possible to reverse the times. For example, you can use a start time of 17:00:00 and an end time of 16:00:00. All data will be included, except for the time period from 16:00:01 to 16:59:59. When you reverse the times, the start time is considered to be in the prior day.
End Time (Chart >> Chart Settings >> Session Times)
This setting applies only to Intraday charts. This sets the end time of data within each day to include in the chart.
The time needs to be entered in 24 hour format. Data up to and including this time is used, therefore the time entered should be the last second in which data will be accumulated for the last bar of the session. For example: 09:29:59.
Note: the times displayed in the Time Scale area at the bottom of the chart, the Chart Values Window or the Tool Values Window, are the bar's or column's starting time.
A particular second in the End Time, like 59, always implies all milliseconds and microseconds up to .999999 (Example 59.999999). So there is no need to specify milliseconds. Those will always be included.
Use Evening Session (optional) (Chart >> Chart Settings >> Session Times)
When the Use Evening Session option is enabled, you can then specify a second time range of data to include in the chart. This is normally going to be evening session data.
If you want to include all 24 hours of data in the chart, then there is no need to enable this option. Just use the Start Time and End Time controls and set them to 00:00:00 and 23:59:59 respectively or whatever the appropriate session times that you require. The standard Session Times can be reversed to include a trading day that starts in the prior day.
If you want to include data that covers a specific period of time without interruption, then also use just the Start Time and End Time controls only. An example of this would be just showing the day session only or showing the day session and the evening session without any interruption or only one period of time excluded.
Here is an example for using the Evening Session times: If a market has a day session from 09:30:00 to 16:14:59 and an evening session from 16:30:00 to 09:29:59 the next day, then these day session times would be entered in the Start Time and End Time boxes and these evening session times would be entered into the Evening Start and Evening End boxes.
The Chart >> Use Evening/Full Session command on the main menu enables and disables the Use Evening Session option.
There is a shortcut key combination that can be used to enable and disable the Use Evening Session option. It is displayed after the Chart >> Use Evening/Full Session command. It can be changed through Global Settings >> Customize Keyboard Shortcuts.
There is a Control Bar button to enable and disable the Use Evening Session option as well.
Evening Start Time (Chart >> Chart Settings >> Session Times)
This setting applies only to Intraday charts. Sets the Evening Session Start Time of data to include in the chart.
The time needs to be entered in 24 hour format. Example: 16:30:00.
The format is Hours:Minutes:Seconds.
When using the Evening Session times, it is the Evening Start Time which is considered the start of the trading day rather than the standard Start Time setting. However, the standard Start Time and End Time are still used to control what time range of data is included in the chart in addition to the Evening Start Time and Evening End Time.
Evening End Time (Chart >> Chart Settings >> Session Times)
This setting only applies to Intraday charts. Sets the evening session End Time of data to include on the chart. Data up to and including this time is used.
This time can either be greater or less than the Evening Start time. If it is greater, then it is the ending time of data to include for the very same day. If it is less, then it is the ending time of data to include from the next day of data.
The time needs to be entered in 24 hour format. Data up to and including this time is used, therefore the time entered should be the last second in which data will be accumulated for the last bar of the session. For example: 09:29:59.
The format is Hours:Minutes:Seconds.
A particular second in the End Time, like 59, always implies all milliseconds and microseconds up to .999999 (Example 59.999999). So there is no need to specify milliseconds. Those will always be included.
Why Reverse Session Times?
The reason for reversing the Session Times (where the Start Time has a time setting which is greater than the End Time) is so that trading day begins in the prior day.
This can be useful when creating chart bars like 24-hour bars that start in the prior day.
If you were to set the period per bar to 1 Day, then the starting time of the chart bars will begin at the Evening Start time if Use Evening Session is enabled, or the Start Time if not using the evening session times. The bars will begin in the prior day and run all the way up to and include the day session End Time into the next day.
Another reason for reversing Session Times is so that studies which depend on Session Times, start their calculations in the prior day and go through into the next day and finish with the end of the day session (End Time).
For additional information, refer to Understanding Trading Day Dates Based on Session Times.
Starting Trading Day in Prior Day
To set the Session Times of the trading day to begin in the prior day, it is necessary to reverse the Session times. Refer to Why Reverse Session Times.
Even when using reversed Session Times, the timescale at the bottom of a chart will always show the true Date-Time of each bar and the true Day of Week for that chart bar.
It is important to understand that when using long-duration timeframe chart bars in an Intraday chart, like 1 Day, and when there are reversed Session Times, then the start of each chart bar will be in the prior day. For example, if the Start Time is 18:00:00 and the End Time is 17:59:59, then each chart bar will begin at 18:00:00 in the prior day. However, the trading day date of those chart bars will be in the next day.
Why Use Evening Session Times?
The following are the reasons why you would want to use a separate Evening Start and Evening End times for the evening session.
For example, how is it different than using just the regular Start Time and End Time boxes set to 09:30:00 and 09:29:59 respectively?
Studies like the Volume by Price and TPO Profile Chart studies can use the separate session times to create two separate profiles during a 24-hour period of time.
You are able to quickly switch the evening session data in and out of the chart. In other words, you can quickly switch from regular trading hours to the full 24 hours of trading. Refer to Quick Switching between the Full Session and Day Session.
The chart can be set to skip over 2 separate continuous periods of time where there is no trading to filter out data that should not be displayed on the chart.
Why Enabling or Disabling Use Evening Session Does Not Affect Chart Bars
If you enable the Use Evening Session option, apply it to the chart, and then disable the Use Evening Session option and the displayed chart bars do not change in any way on the chart, then this indicates the following possibilities:
The Start Time and End Time already are covering the Evening Start to Evening End time range. Check these to make sure they are set correctly.
The time range that Evening Start and Evening End span is a time range where there is no data available in the chart data file. If this is not correct, you may want to re-download the data in the chart with Edit >> Delete All Data and Download.
Another possibility is that the Time Zone in Sierra Chart is not set correctly relative to the Session Times you are using. Refer to Time Zone.
Quick Switching between the Full Session and Day Session
To quickly switch from the Full Session and the Day Session you first need to setup Evening Session times using the controls explained in the Use Evening Session section.
To perform the switch, select Chart >> Use Evening/Full Session on the menu.
With your keyboard you can use a shortcut key combination. The particular shortcut key combination is displayed after the Chart >> Use Evening/Full Session menu command.
On the Control Bar there is a corresponding button available. Select Global Settings >> Customize Control Bar to add it.
Time Range of Session Times
It needs to be understood that the Time Range of the Start and End session times is inclusive of the very last second of the End Time. For example, the time range from 08:00:00 to 10:00:00 is two hours and 1 second. The time range for 08:00:00 to 09:59:59 is two hours exactly. Keep this in mind when setting the times.
Always Allowing Session Times to be Set
Session Times can only be set for Intraday Charts.
If you always want to be able to set the Session Times for a particular chart, then set the Chart Data Type setting to Intraday Chart Only.
Load Weekend Data Setting (Chart >> Chart Settings >> Session Times)
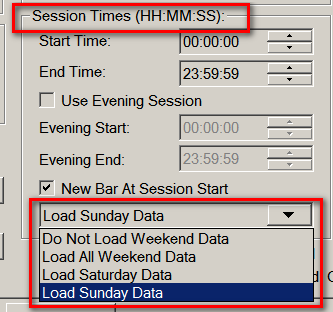
The Load Weekend Data Setting consists of four options. They are documented below.
A weekend day is considered Saturday or Sunday.
However, for any particular time on a Saturday or Sunday where that time is associated with Friday's or Monday's trading will not be considered part of the weekend. This occurs when the Session Times are reversed. For example, in the case when the Session Times are reversed and the Start Time is 17:00:00 and the End Time is 16:59:59, then the beginning of the trading day is in the prior day. Therefore, trading at 17:000:00 on Sunday is considered part of the Monday trading day data, and that data will be included in the chart even when Do Not Load Weekend Data is selected.
When Session Times are not reversed, then any time from 00:00:00 to 23:59:59 on Saturday or Sunday is considered a weekend.
All Session Times are relative to the Time Zone setting.
All of the above is very important to understand.
Do Not Load Weekend Data
Saturday and Sunday data is not loaded into the chart. However, the above rules apply when Session Times are reversed. This also applies to real-time chart updating. Therefore, when using this setting Sunday night trading is blocked from the chart unless the Session Times are reversed.
Load All Weekend Data
Saturday and Sunday data is loaded into the chart.
Load Saturday Data
Only Saturday data is loaded into the chart and not Sunday.
Load Sunday Data
Only Sunday data is loaded into the chart and not Saturday.
Automatically Setting Session Times
The chart Session Times can either be manually set as explained in the Session Times section, or you can define Session Times for a particular symbol or symbol pattern through the Global Symbol Settings.
Therefore, whenever you open a chart for that symbol or the symbol matches the symbol pattern, the Session Times will be automatically set as you have specified.
The Session Times will also be applied to an Intraday chart from the Global Symbol Settings when you change the symbol of the chart or it is changed automatically from a symbol rollover, if Global Settings >> Symbol Settings >> Apply Intraday Session Times to Intraday Chart is checked. Or if Chart >> Chart Settings >> Session Times >> Apply Intraday Session Times to Intraday Chart is set to Yes.
If you do not want this to occur, then refer to Setting of Intraday Chart Session Times for instructions to disable this.
Follow the instructions below to set the preset Session Times from the Global Symbol Settings for the symbol of the current chart:
- Set Chart >> Chart Settings >> Session Times >> Apply Intraday Session Times to Intraday Chart to Yes.
- In the Chart >> Chart Settings window press the Symbol >> Global Symbol Settings >> Apply Global Symbol Settings button.
- Press OK.
Creating Daily Bars with Custom Session Times
To create Daily bars that have a specific Start and End time that you require, then follow the instructions below. Intraday chart data is required and these charts will also include Bid Volume and Ask Volume per bar as well.
- Open an Intraday chart by selecting File >> Find Symbol >> [select symbol] >> Open Intraday Chart.
- Select Chart >> Chart Settings.
- Set the Chart Data Type to Intraday Chart Only. This control is located just above the Intraday Chart Bar Period frame.
- Set the Intraday Chart Bar Period >> Bar Period Type to Days-Minutes-Seconds.
- Set the control under Days-Minutes-Seconds to 1-0-0. This will set the chart bars to 1 day per bar. For weekly bars, refer to Day Session Only Weekly Chart Bars.
- Set the Start Time and the End Time controls in this window to what you require. For more information, refer to Session Times.
- Press OK to close the Chart Settings window.
Understanding Hours, Minutes, Seconds Places
When entering the Start Time, End Time, Evening Start, Evening End Session Times, the format is Hours: Minutes: Seconds. Refer to the image below
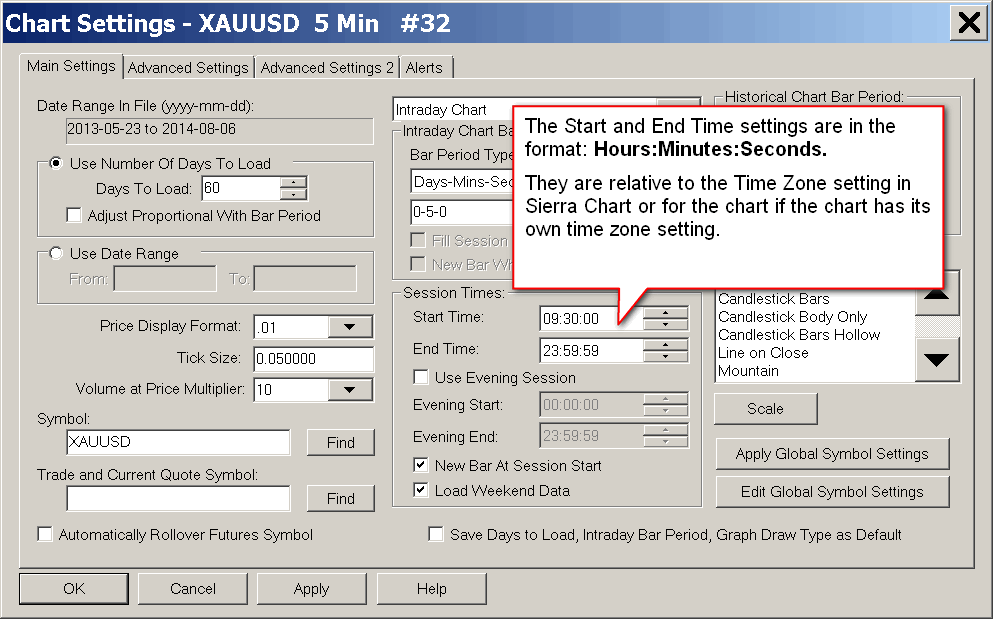
The Session Times are always relative to the time zone setting in Sierra Chart or to the chart specific time zone setting if you have set a time zone within the chart to override the global time zone. For complete documentation on setting the time zone, refer to Time Zone.
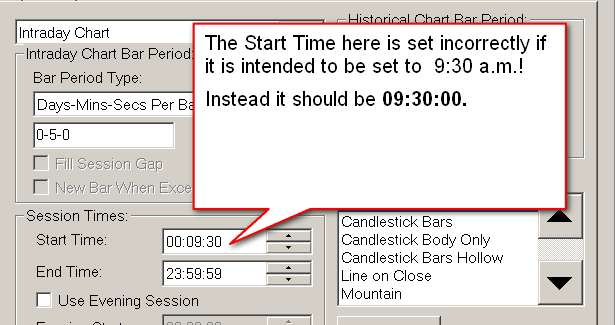
A possible mistake that may be made is that the hours is specified in the minutes field and the minutes is specified in the seconds field. Check for this kind of mistake if you have a problem with your session times. Refer to the image below.
Bar Starting Times
The starting time for each bar in a chart can be determined with the Chart Values tool. When using the Chart Values tool, you will see the bar starting time in the Window >> Tool Values Window. Therefore, the displayed time for each chart bar is its starting time.
The Time Scale at the bottom of the chart shows the starting times for the particular chart column/bar that the Date-Time is for. For additional information, refer to Time Scale.
In the case of Intraday chart bars which are based upon a fixed amount of time, for example 5 minutes, the starting time of the bar is aligned to the Session Times >> Start Time in Chart >> Chart Settings.
If Session Times >> Use Evening Session is enabled, then Session Times >> Evening Start Time is the start time which is used for bar starting time alignment.
However, when Session Times >> Use Evening Session is enabled and when Session Times >> New Bar at Session Start is enabled, then for the chart bars which are within the Session Times >> Start Time to Session Times >> End Time time range, those bars will have their starting time be aligned to the Session Times >> Start Time instead. Although this will not be the case, when the Chart Setting Include Columns with No Data is enabled. In this case, the bar starting time will still be aligned to the Session Times >> Evening Start Time.
For example, if the Session Times >> Start Time is 09:35:00, and the chart bars are 10 minutes each, then the first bar would start at 09:35:00 and the next bar would start at 09:45:00, and so on. By default, if there is no trading for a particular period of time, then there will not be any chart bar at that time. This behavior can be changed with Include Columns with No Data.
For example, if the Session Times >> Start Time is 09:30:00, a 60 minute chart bar for the trading day will start at 09:30:00 and end at 10:29:59 and the next bar will start at 10:30:00.
In the case of Intraday chart bars which are not based upon a fixed amount of time, for example Range Bars, the time shown for a bar is its starting time and they are not aligned to the Session Times >> Start Time. The starting time of the bar will be the time of the first trade of the bar.
In the case of Intraday charts, the displayed starting Date-Time will be the starting time of the bar and this can be in the prior day in the case of bars with a time length of 1 day per bar or higher, if the trading day starts in the prior day. For more information, refer to Why Reverse Session Times.
For additional information about this subject, refer to Time Scale.
At the top of the chart in the Region Data Line, the Time field displays the last trade time of the chart bar.
Starting Time Does Not Represent Actual Start Time of Data Within Chart Bar
As explained in the Bar Starting Times section above, the starting time for a chart bar indicates the chart bar starting time.
However, that is not necessarily the exact Date-Time of the first trade or other data contained within that chart bar. The first trade can be seconds, minutes or even hours later.
For example, in the case when Intraday chart bars have a timeframe of 1 Day each, the starting Date-Time for a chart bar could be hours earlier than the very first trade within that chart bar.
Start and End Times Relative to Time Zone Setting
When setting the Start Time and End Time session time settings as explained below, these are relative to the Time Zone setting in Sierra Chart.
To Chart Only the Day Session in an Intraday Chart
Select Chart >> Chart Settings on the menu. Set the Start Time and End Time to cover the day session only. Press OK. See the Session Times section on the Chart Settings documentation page for more information on these settings.
Day Session Only Daily Chart Bars
Typically Historical Daily charts, opened with File >> Find Symbol >> Open Historical Chart, provide Historical Daily bar data which covers the full 24 hours of trading for a symbol.
This is the function of the Data or Trading service you are using Sierra Chart with. The time period of the Historical Daily bar data, cannot be changed. In the case of the Sierra Chart Historical Data Service, the data for a Daily bar is for 24 hours of trading. This data comes from the exchange.
However, if you want to have the Historical Daily chart bars display only the Day trading session, then follow these instructions. Intraday chart data is required and these charts will also include Bid Volume and Ask Volume per bar as well.
- Open an Intraday chart for the same symbol with File >> Find Symbol >> [select symbol] >> Open Intraday Chart.
- Select Chart >> Chart Settings on the menu.
- Set the Days - Mins - Secs setting for the Intraday chart to 1-0-0 (1 Day) to create Daily bars.
- Set the Start Time and End Time to cover the Day Session only.
- Make sure Use Evening Session is unchecked.
- Refer to Session Times for more information on these settings.
- Set the list box for the Chart Data Type to Intraday Chart Only (above the Intraday Chart Bar Period frame).
- Press OK to close the Chart Settings window.
Day Session Only Weekly Chart Bars
To create chart bars that are a timeframe of 1 Week each, start on Sunday or Monday if there is no Sunday trading, and only consist of data from the Day trading session, then follow these instructions:
- Open an Intraday chart for the same symbol with File >> Find Symbol >> [select symbol] >> Open Intraday Chart.
- Select Chart >> Chart Settings on the menu.
- Set the Days - Mins - Secs setting for the Intraday chart to 7-0-0 (1 Week) to create Weekly bars.
- Set the Start Time and End Time to cover the Day session only.
- Make sure Use Evening Session is unchecked.
- Refer to Session Times for more information about the Session Times settings.
- Set the list box for the Chart Data Type to Intraday Chart Only (above the Intraday Bar Period frame).
- Enable Use Date Range the option. In the Use Date Range frame, set the From date to a Sunday in the past where you want the chart to begin at. The To date box needs to be blank.
- Press OK to close the Chart Settings window.
Day Session Only Monthly Chart Bars
To create chart bars that are a timeframe of 1 Month each, from the 1st day of the month to the last day of the month, then follow these instructions:
- Open an Intraday chart for the same symbol with File >> Find Symbol >> [select symbol] >> Open Intraday Chart.
- Select Chart >> Chart Settings on the menu.
- Set the Bar Period Type setting for the Intraday chart to Monthly Bars.
- Set the Start Time and End Time to cover the Day session only.
- Make sure Use Evening Session is unchecked.
- Refer to Session Times for more information about the Session Times settings.
- Set the list box for the Chart Data Type to Intraday Chart Only (above the Intraday Bar Period frame).
- Press OK to close the Chart Settings window.
Weekly Bars Created From Intraday Data Starting at a Particular Day of the Week
To create chart bars that are a timeframe of 1 Week each and start at a day other than Sunday, then follow these instructions:
- Open an Intraday chart for the same symbol with File >> Find Symbol >> Open Intraday Chart.
- Select Chart >> Chart Settings on the menu.
- Set the Days - Mins - Secs setting for the Intraday chart to 7-0-0 (1 Week) to create Weekly bars.
- Set the Start Time to 00:00:00 and the End Time to 23:59:59. Or whatever Session Times you require.
- Make sure Use Evening Session is unchecked.
- Set the list box for the Chart Data Type to Intraday Chart Only (above the Intraday Bar Period frame).
- Enable Use Date Range the option. In the Use Date Range frame, set the From date to a Monday in the past where you want the chart to begin at. Or whatever day of week you want the bars to start on. The To date box needs to be blank.
- Press OK.
To Chart Data That Falls Within Specific Time Ranges
To chart data that falls within specific time ranges, select Chart >> Chart Settings on the menu.
In the Session Times frame, set the Start Time and End Time controls for both the primary and Evening Session as required. Press OK.
Refer to Session Times for more information on these settings.
Linking Session Times Between Charts
Session Times can be set for a symbol or symbol pattern in the Global Symbol Settings and automatically applied to the chart with a matching symbol. For complete information about this, refer to Setting of Intraday Chart Session Times.
It is also supported to use the Chart Linking feature and link the Session Times so that when the Session Times are changed in one chart, charts with the same Link Number and also have Chart >> Chart Settings >> Linking >> Chart Linking >> Session Times enabled, will have their Session Times set to be the same as the chart they are being changed on.
For complete information, refer to Chart Linking.
Session Times Automatically Changing Unexpectedly
There are 3 conditions which will cause the chart Session Times and the related settings like Use Evening Session to change in a chart. These are explained below.
- When the symbol of a chart is changed, the Session Times and related settings may be automatically changed to the Session Times specified in the Global Symbol Settings for the symbol or symbol pattern. For further details and instructions on how to prevent this, refer to Setting of Intraday Chart Session Times.
- The Session Times will be automatically changed in a chart when the Session Times are changed in another chart that has the same Chart >> Linking >> Number of the chart they have been automatically changed in, and the chart that they have been automatically changed in has the Chart Linking >> Session Times option enabled. For further details, refer to Linking Session Times Between Charts.
- When using a study that references another chart like the Overlay (Bar) or the Difference (Bar) study, then these studies will change the Session Times of the chart they are referencing to the same Session Times of the chart they are applied to.
To see if a chart is being referenced by another chart select Chart >> Chart Settings. You will see the references displayed on the title bar of the Chart Settings window. Example: Ref. by: .
One way to avoid this problem is to use the Study/Price Overlay study instead of the Overlay (Bar) study.
When using the Difference(Bar) study, also use the Study/Price Overlay study to overlay the main price graph from another chart on to the destination chart where the Difference study is located and then set the Difference study to reference the Study/Price Overlay study on the same chart it is on.
Session Times to Include Only the Main/Primary Trading Hours
- Enable Global Settings >> Symbol Settings >> Apply Intraday Session Times To Intraday Chart.
- To make sure you have the Symbol Settings, follow the procedure to Update the Symbol Settings.
- Go to the chart and select Chart >> Chart Settings.
- Press the Apply Global Symbol Settings button.
- Uncheck the Use Evening Session option.
- Press OK.
Filtering Out Friday Evening Data
In an Intraday chart, chart bars with a date on Friday and are part of the evening session based on the Session Time settings in the chart when using Reversed Session Times or using the Evening Session Times, will have a Trading Day Date of Saturday.
For an understanding of this, refer to Understanding Trading Day Dates Based on Session Times.
To not load this Friday evening data in the chart, you need to select Chart >> Chart Settings. In the Session Times frame, there is a list box with several Weekend data options. In that list box, select Load Sunday Data.
Understanding Trading Day Dates Based on Session Times
The trading day for a symbol is a period of 24 hours whether the symbol trades for the full 24 hours or not. The trading day has a single Date associated with it.
A new trading day begins at the start of the evening trading session which begins after the end of the day trading session. For example, the start of the evening session begins at 18:00:00 US Eastern time for the CME S&P 500 futures.
Many studies for Intraday charts rely on 24 hour/Daily calculations. These calculations begin at the start of the trading day which is the start of the evening session, if used. Refer to the Session Times set for the chart to see if there is an Evening Session used or there are reversed session times which will also cause the trading day to start in the prior day.
The following are the rules to determine the trading day Date for any bar in the chart. This information is essential to understand what trading day a particular bar in the chart belongs to according to the Session Times when using a particular study that relies upon calculations which occur over a 24-hour/Daily period.
These rules also apply to calculations which are based on weekly or monthly calculations because the trading day at the start of a week or the start of the month, can start in the prior day before the week or month actually literally begins.
Look at the timestamp of the bar. This is the bar beginning time. The timestamp has both the Date and the Time. This is known as the Date-Time of bar.
Each bar in the chart belongs to a particular trading day Date. All bars that belong to the same Date will be part of a study calculation which requires a 24 hours range of data.
"Use Evening Session" Enabled
When the Use Evening Session is enabled, then the Evening Start time is the start of the trading day. If the Evening Start is greater than the Evening End time, then the Evening Start is in the prior trading day.
In this particular case if the time of a chart bar is greater than or equal to the Evening Start time, then its Date needs to be incremented by 1 and that gives you the true trading day Date for the bar.
If the time of a chart bar is less than the Evening Start time, then its Date is correct and does not need to be adjusted.
Example: Evening Start is set to 18:00:00 and bar Date-Time is 2016-04-01 18:30:00, then the Trading day date of this bar is 2016-04-02. Which actually places it on a Saturday.
In the case where the Evening Start time is less than Evening End time, then there is never an adjustment to the trading day date of the bar.
"Use Evening Session" Not Enabled
When the Use Evening Session is disabled, then the Start Time is the start of the trading day. If the Start Time is greater than the End Time, then the Start Time is in the prior trading day.
In this particular case if the time of a chart bar is greater than or equal to the Start Time, then its Date needs to be incremented by 1 and that gives you the true trading day Date for the bar.
If the time of a chart bar is less than the Start Time, then its Date is correct and does not need to be adjusted.
In the case where the Start Time is less than End Time, then there is never an adjustment to the trading day date of the bar.
Based upon the above explanations, if a particular Date-Time based on the Session Times settings is considered to be a Saturday or Sunday, then you need to consider whether that Date-Time is going to be filtered out from the chart and not loaded based on the Load Weekend Data Setting. This is important to understand since it can result in data getting filtered out from the chart unexpectedly if Saturdays and Sundays are not loaded.
*Last modified Monday, 11th March, 2024.