Home >> (Table of Contents) Studies and Indicators >> How to Overlay a Study or Main Price Graph From One Chart Onto Another Chart with a Different Timeframe per Bar or Symbol (Study/Price Overlay Study)
Study/Price Overlay Study
- Using the Study/Price Overlay Study
- Study/Price Overlay Study
- Skipped and Changing Values in Destination Chart
- Aligning Data from Source Chart to Latest Corresponding Bar in Destination Chart
- Including the Latest Bar from Source Chart in Destination Chart Which Does not Have Corresponding Bar Yet
- Study Inputs
- Study to Overlay
- Match Source Bars to Destination Bars
- Data Copy Mode
- Bar Time Matching Method
- Copy Source Data to Latest Corresponding Destination Bar
- Fill Blanks with Last Value
- Multiplier
- Draw Zeros
- Full Synchronization of Source Chart to Destination
- Use Subgraph Name/Value Related Display Settings from Source Study
- Use Colors from Source Study
- Use Styles and Widths from Source Study
- Always Use Short Names from Source Study
- Use Multicolumn Rectangle Style for Price Bars
- Copy Extension Lines from Source Study
- Study/Price Overlay Study Updating and Timing of Calculations Between Source and Destination Charts
- Overlaying Results from Color Bar/Background Based on Alert Condition Study
- Overlaying Study/Price Overlay Study in Chart Region Containing Another Graph
- Overlaying a Study on Another Chart that Uses Different Session Times
- Controlled Order Chart Updating
- Inconsistent Dependent Results Between Full Calculation and Real-Time Updating
- Data Changing at Chart Bars Earlier Than Being Referenced in Source Chart
- Resolving Issue Where Subgraphs from Source Chart Are Not Visible
Using the Study/Price Overlay Study
This page documents the Study/Price Overlay study. Follow the instructions below to overlay a study or main price graph from one chart onto another chart with a different Bar Period, Session Times or Symbol as compared to the original source chart.
If you need to overlay the main price graph from another chart that has the same chart Bar Period which is based on a fixed amount of time (Example: 5 Minutes per bar and not Number of Trades ), and the same Session Times as the chart you are overlaying to, then it is best to use the Overlay (Bar) study. It is more efficient.
However, if the source chart bars that you want to overlay on a destination chart, has periods of time where there is no trading compared to the destination chart, then you should use the Study/Price Overlay study instead to avoid duplicate bars from appearing.
Each bar/column in the destination chart, will only match with one bar/column in the source chart. Multiple destination columns cannot match with the same source chart column unless the Fill Blanks with Last Value Input is set to Yes. In this case the source column mapped to a particular destination column will repeat until the next destination chart column matches with a different source chart column.
The Volume by Price and the Market Depth Historical Graph studies cannot be overlaid to another chart. Chart Drawings like text drawings added by a study also cannot be overlaid to another chart.
- Open or go to the source chart that will be overlaid on another chart. This can be either a Historical or Intraday chart of any Bar Period or Symbol. To open a chart, select File >> Find Symbol. Existing charts can be accessed through the CW menu.
- Add the study you want on the source chart, such as a Moving Average - Simple. This is only an example study. You can use any study that you require.
- Open or go to the chart where you want to overlay the study from the source chart. This chart can be any Bar Period or Symbol. This is known as the destination chart. It would make sense for it to be of a different Bar Period or Symbol compared to the source chart. For example, the source chart could be a 1 hour Bar Period and the destination chart could be a 1 minute Bar Period.
- Select Analysis >> Studies on the menu. Add the Study/Price Overlay study to this second chart.
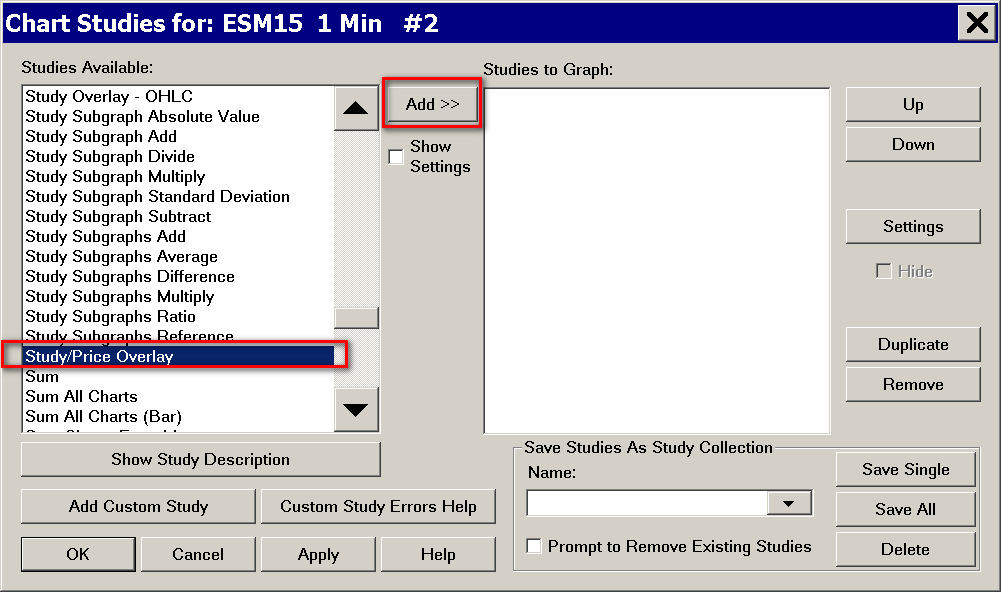
For complete instructions, refer to the Adding/Modifying Studies section. - Press the Settings button to open the Study Settings window. Set the inputs as explained below:
- Study to Overlay: This Input is for selecting the specific study overlay from another chart within the same Chartbook. The other chart must be within the same Chartbook.
From the list of charts with this Input, select the chart that you want to overlay a study from. The next step is to select the specific study from the list of studies with this Input. The study must be on the chart that was selected from the list of charts. If it is not, you will not see it listed. - Match Source Bars to Destination Bars: Set this to Yes. Setting this to Yes will make the Study Subgraph values for a particular chart column on the source chart match up with the corresponding Date-Time on the destination chart.
- Fill Blanks With Last Value: Set this to Yes. This will make sure the values will display up to and including the last bar on the destination chart.
- Chart Region: If you have set Study to Overlay to the <Main Price Graph>, then you may want to set the Chart Region setting to 1 if you need the main price graph you are overlaying from the source chart, on the main price graph of the destination chart.
In this case, you may need to also press the Scale button and set the scale to Independent if the prices are different between the source and destination chart bars which would be the case if they are for different symbols.
- Study to Overlay: This Input is for selecting the specific study overlay from another chart within the same Chartbook. The other chart must be within the same Chartbook.
- Press OK to close the Study Settings window.
- Press OK to close the Chart Studies window.
- Next time you open the Chart Studies window, you will see that the Study/Price Overlay study has its name changed to match the name of the chart (including chart number) or the name of the study it is overlaying.
- For complete information about the Study/Price Overlay study, refer to Study/Price Overlay section on this page.
The following studies cannot be overlaid from one chart to another with the Study/Price Overlay study:
- Volume by Price
- TPO Profile Chart
- Numbers Bars
- Countdown Timer
- Market Depth Historical Graph
- (studies which display text only)
Study/Price Overlay Study
This section contains the detailed documentation for the Study/Price Overlay study.
The Study/Price Overlay study overlays a study or price graph from another chart onto a chart. Multiple Study/Price Overlay studies can be added to a chart to overlay more than one study or price graph on a chart.
The purpose of this study is to overlay a study or price graph from another chart with a different time period per bar, different Session Times, or a different symbol.
There are 2 charts involved with this study. They are called the Source chart and the Destination chart. The study is applied to the Destination chart and obtains data from the specified Source chart using the Study to Overlay Input.
The study uses the timestamps of the chart bars to determine what specific bar/column of the study or price data from the Source chart to overlay on the corresponding bar/column on the Destination chart. Each Destination chart column covers a specific time range.
The latest or earliest bar/column from the Source chart, depending upon the Data Copy Mode input, within or nearest the Destination chart bar time range is overlaid on the Destination chart.
For example, if on the Destination chart there is a chart bar with the time range of 10:00:00 through 10:04:59, then the study or price data from the Source chart with a time of 10:04:59, or nearest to it, but not greater, is then used on the Destination chart if the Data Copy Mode is set to Use Latest Value from Corresponding Timeframe.
If the Data Copy Mode is set to Use Earliest Value from Corresponding Timeframe, then the study or price data from the Source chart with a time of 10:00:00 is then used on the corresponding bar on Destination chart.
In the case where there are repeating timestamps in the Source Chart, the study or price data from the rightmost chart column with the same timestamp will be overlaid in the Destination chart. In the case where the Destination chart has repeating timestamps, the overlaid study or price data from the corresponding Source chart column will repeat at each Destination chart column that has the same timestamp when Fill Blanks with Last Value is set to Yes.
Using with Volume by Price study: It is not supported to overlay the Volume Profiles from the Volume by Price study by using the Study/Price Overlay study. The Volume Profiles will not be displayed on the destination chart. Only the Point of Control, Value Area High and Low, and Volume Weighted Average Price lines will be.
Skipped and Changing Values in Destination Chart
The chart that contains the Study/Price Overlay study is the Destination chart.
The study Subgraphs which are being overlaid from the Source chart at each Destination chart bar/column, may not contain values if there are not chart bars with a corresponding Date-Time in the Source chart which match with every Destination chart bar Date-Time.
An example of this problem is overlaying a study from a 5 minute per bar chart, to a 1 minute per bar chart. To solve this problem, set the Fill Blanks with Last Value Input to Yes.
Additionally, the Subgraph values of the Study/Price Overlay study for each of the bars in the Destination chart, starting from the last bar in the Destination chart, which map to the last bar in the Source chart based upon the Date-Time of the chart bars, will change in value as the Subgraph values at the last bar in the Source chart are changing. This is normal. This can have a complex side effect when using the Study/Price Overlay study in other calculations. So it is something to be aware of.
Aligning Data from Source Chart to Latest Corresponding Bar in Destination Chart
To align data for the bar/columns of the Source chart to the latest corresponding bar/columns in the Destination chart, set Copy Source Data to Latest Corresponding Destination Bar to Yes.
Including the Latest Bar from Source Chart in Destination Chart Which Does not Have Corresponding Bar Yet
If at the last bar/column in the Source chart, the Date-Time of that bar does not have a corresponding Date-Time in the Destination chart, then the study data from the Source chart at the last bar/column will not be drawn in the Destination chart.
This is regardless of how the Data Copy Mode or the Bar Time Matching Method Study/Price Overlay Inputs are set to.
Study Inputs
Study to Overlay
This Input specifies the Source study to overlay from another chart within the same Chartbook. From the list of charts with this Input, select the chart that you want to overlay a study from.
The next step is to select the specific study from the list of studies listed using this Input.
If you want to overlay the <Main Price Graph> from another chart that has the same Bar Period as the Destination chart you are overlaying to, then normally it will be best to use the Overlay (Bar) study instead.
Match Source Bars to Destination Bars
In almost all cases the Match Source Bars to Destination Bars input needs to be set to Yes to match the study or price graph data from the chart referred to by the Study to Overlay Input (source chart), to the corresponding column Date-Times on the chart the Study/Price Overlay study is applied to (destination chart).
When this input is set to Yes, the following Inputs apply:
- Fill Blanks with Last Value
- Data Copy Mode
- Bar Time Matching Method
- Copy Source Data to Latest Corresponding Destination Bar
When this input is set to No, then the above Inputs do not apply and the way that mapping of graph data for each bar/column in the source chart to destination chart works is as follows:
At the last bar/column in the destination chart, the graph data from the last bar/column in the source chart is overlaid onto the destination. At the column prior to last column in the destination chart, the graph data from the column prior to the last column in the source chart is overlaid onto the destination. This continues until there are no more source graph columns to overlay or there are no more available destination columns available.
In other words, the source graph is overlaid towards the end of the destination chart.
Data Copy Mode
You can choose to copy the data from the earliest bar/column in the corresponding timeframe in the source chart onto the destination chart. Or, you can copy the data from the latest bar/column in the corresponding timeframe in the source chart onto the destination chart.
When this is set to Use Latest Value from Corresponding Timeframe, then the very latest bar/column in the Source chart that corresponds to a particular destination chart bar/column will be copied.
When this is set to Use Earliest Value from Corresponding Timeframe, then the earliest bar/column in the Source chart that corresponds to a particular destination chart bar/column will be copied.
In the case where the destination chart bars are a non-fixed timeframe, which will be the case when bars are based upon Volume, Number of Trades, Range, Reversal, Renko, Delta Volume, Price Changes, Point & Figure, then you will want to choose Use Earliest Value from Corresponding Timeframe. This is going to be necessary when performing back testing and the source chart is not being replayed.
If the source chart is replaying, or the source and destination charts are both updating in real time, then set Data Copy Mode as required. It does not need to be set toUse Earliest Value from Corresponding Timeframe in these cases.
Bar Time Matching Method
This input can be set to either Nearest Match or Containing Match. The meaning of these settings is explained below.
When Nearest Match is used, then the data from the nearest matching bar/column Date-Time in the source chart compared to the destination chart bar/column Date-Time, is used. After this the Data Copy Mode Input setting is applied to determine the corresponding bar.
When Containing Match is used, then the data from the earliest bar/column Date-Time in the source chart that is equal to or greater than the destination bar/column Date-Time, is used on the destination chart, except if it exceeds the time range of that destination column. In which case the prior source chart column data is used. After this the Data Copy Mode Input setting is applied to determine the corresponding bar.
When overlaying a study from a Historical Daily chart to an Intraday chart, if a new day has begun in the Historical Daily chart which you can tell from the date at the top of the chart, then when using Containing Match, the data for the prior day in the Historical Daily chart which contains the Date-Time of the corresponding Intraday bar will be used instead of the most recent data. Check the Time Zone setting in the Historical Daily chart and make sure it matches the Intraday chart and as an alternative create Daily bars from Intraday data.
Copy Source Data to Latest Corresponding Destination Bar
This input setting is ignored if Fill Blanks with Last Value is set to Yes. When this input is set to Yes, then when there is more than one bar/column in the destination chart which corresponds to a source chart bar/column based on Date-Times, then the source chart Subgraph data is copied to the latest Date-Time corresponding destination chart bar/column.
Fill Blanks with Last Value
When you are overlaying a study or price graph from a chart that has a higher time period per bar compared with the chart this study is applied to, then you will have chart bar columns in the study with zero values because there is no corresponding data. In the destination chart, when a chart column maps to the same source chart column as the destination chart column before it, the source chart data is not repeated if this Input is set to No. These zero values or blanks can be filled in with the study value just before the zero/blank chart column by setting this Input to Yes.
Multiplier
The values of this study are multiplied by this number. By setting this to -1, you can invert a study.
Draw Zeros
When this Input is set to Yes, then zero values from the source study are drawn along the study Subgraphs. Otherwise, if it is set to No, then zero values are not drawn along the study Subgraphs.
Full Synchronization of Source Chart to Destination
Normally this Input should be set to No. This is going to be the usual operating mode in almost all cases.
When this input is set to Yes, the relevant chart data related Chart >> Chart Settings of the source chart will be set to be the same as the destination chart.
This is not usually what should happen and is the reason why this Input should be set to No unless there is a specialized reason why this is necessary.
Use Subgraph Name/Value Related Display Settings from Source Study
When this Input is set to Yes, then the Subgraph Name and Value Labels, Display Name and Value in Chart Values Windows, Display Name and Value in Region Data Line settings from the source study are applied to the instance of the Study/Price Overlay study which is overlaying that source study.
Therefore, changes to these particular settings must be made on the source study. When this Input is set to No, then it is possible to change these settings for all of the Subgraphs directly within the instance of the Study/Price Overlay study which is overlaying the source study.
Use Colors from Source Study
If this Input is set to Yes, the default, then the color settings from the source study set with the Study to Overlay Input are used to color the study on the chart the Study/Price Overlay study applied to.
If the source study is using Auto Coloring, then the colors as they exist at the chart bars in the source chart and are copied to the destination chart as set by the Auto Coloring function, are used.
If this Input is set to No, then you are able to change the color settings on the Subgraphs tab of the Study/Price Overlay study to control the colors of the overlaid study Subgraphs.
There is one condition where setting this Input to No, will still use the colors for a study Subgraph from the source study. This will happen if the source study individually colors the Subgraph elements by using the ACSIL sc.Subgraph[].DataColor array on the study Subgraph.
Use Styles and Widths from Source Study
When this Input is set to Yes, then the Draw Style and Width for all the Subgraphs from the source study are applied to the instance of the Study/Price Overlay study which is overlaying that source study. Therefore, changes to these particular settings must be made on the source study. When this input is set to No, then it is possible to change the Draw Style and Width for all the Subgraphs directly within the instance of the Study/Price Overlay study which is overlaying the source study.
Always Use Short Names from Source Study
When this Input is set to Yes, then the Short Name, if set, for all the Subgraphs from the source study are applied to the instance of the Study/Price Overlay study which is overlaying that source study.
Therefore, changes to the Short Name must be made on the source study.
When this input is set to No, then it is possible to change the Short Name for all of the Subgraphs directly within the instance of the Study/Price Overlay study which is overlaying the source study.
Use Multicolumn Rectangle Style for Price Bars
In the case where the Main Price Graph is being overlaid from a source chart with higher timeframe per bars onto a destination chart with shorter time frame per bars, then setting Use Multicolumn Rectangle Style for Price Bars to Yes will then draw the higher timeframe bars as a rectangle spanning the corresponding bars on the destination chart.
The exact corresponding bars which the rectangle spans depends upon the setting of the Data Copy Mode and the Bar Time Matching Method Inputs.
When setting this input the Yes, you will also need to set the Chart Region study setting to 1.
You will also want to enable the Draw Study Underneath Main Price Graph study setting to cause the rectangles to be drawn underneath the chart bars.
Copy Extension Lines from Source Study
When this Input is set to Yes, then standard implemented extension lines from the source study will be copied to the destination chart.
An example of an extension line would be for example extension lines drawn by the Numbers Bars study. Certain types of extension lines are not copyable. For example, extension lines from the Volume by Price or TPO Profile Chart studies cannot be copied.
Study/Price Overlay Study Updating and Timing of Calculations Between Source and Destination Charts
The Study/Price Overlay study overlays the study Subgraphs from a source chart study, to a destination chart where the Study/Price Overlay study is added.
Each chart is updated and calculated independently from each other. If both the source and destination charts, are the same symbol, the exact moment in time in which they are calculated, will differ slightly.
When the symbol of the charts trades, and the destination chart is first calculated before the source chart, then the destination chart is going to get the study data from the source chart, but this study Subgraph data will not be up-to-date with the latest trade because the source chart has not yet been calculated.
When the source chart is calculated after the destination chart which has been calculated, it tags the destination chart to calculate itself again. At that time, the destination chart will get the current study data from the source chart again which now will be up-to-date because it includes any changes resulting from the most recent trade. All of this process is fully automatic. However, it is important to understand the timing of this in case there any subtle issues which arise out of this based upon any custom ACSIL or Spreadsheet programming you are doing.
Overlaying Results from Color Bar/Background Based on Alert Condition Study
When you want to overlay the results of the Color Bar Based on Alert Condition or the Color Background Based on Alert Condition study from a source chart to a destination chart with a different timeframe per bar, it is necessary to instead use the Study Overlay-OHLC Study to accomplish this and not the Study/Price Overlay study.
Otherwise, there is the likely possibility based upon the differing time frames of the source and destination chart bars, that signals from some source chart bars have no corresponding destination chart bar and those signals will not get overlaid to the destination chart.
Overlaying Study/Price Overlay Study in Chart Region Containing Another Graph
Follow the instructions below to properly scale the Study/Price Overlay study graph in a Chart Region which contains another graph which uses a different scale.
- Set the Study/Price Overlay study to be displayed in the Chart Region where you require it.
- Open the Scale Settings window for the Study/Price Overlay study.
- Set the Scale Range to Independent .
- Press OK to close the Scale Settings window. Press OK to close the Chart Studies window.
- Enable the Use Left Side Scale option in Chart >> Chart Settings >> Scale for the chart. For further information, refer to Use Left Side Scale.
- Press OK to close the Chart Settings window.
Overlaying a Study on Another Chart that Uses Different Session Times
If you want to overlay a study on a chart, from another chart that has different session times, follow these steps below. For example, you could have a study on an Intraday chart based upon a full 24 hour session and then overlay that on an Intraday chart that only displays the Day session, or vice versa.
If you want a study based upon a particular session time range in the chart and do not need to see trading outside of those session times, then just simply adjust the Session Times to that particular time range. There is no need to follow the instructions below.
- Setup the source chart with the Session Times that you require, in Chart >> Chart Settings. This is the chart that will contain the study that you will overlay on the destination chart.
- Add the study or studies to the source chart and configure it.
- Setup the destination chart as you require. Including setting the Session Times in Chart >> Chart Settings.
- Add the Study/Price Overlay study to the destination chart. Configure it to overlay the study on the source chart, following the Using the Study/Price Overlay Study instructions.
Controlled Order Chart Updating
When using the Study/Price Overlay study and overlaying charts or studies from other charts to a destination chart, you may want to have the charts updated in an order according to dependency if you have a requirement for this. This should only be done if you know that you require it. Otherwise, do not do this because it can make Sierra Chart less responsive.
For further information, refer to Use Controlled Order Chart Updating.
Inconsistent Dependent Results Between Full Calculation and Real-Time Updating
When the main price graph or a study is overlaid to a destination chart, and this overlay is referenced by another study (dependent study), it is essential that the dependent study is calculated after the Study/Price Overlay study is calculated. Otherwise, the dependent study is going to be referencing old data or no data at all.
This creates a problem where not only is the dependent study referencing old data, but there is going to be a difference in the results of the dependent study between when a chart is fully recalculated and when there is real-time updating. During a full recalculation, like during a chart reload (Chart >> Reload and Recalculate / Recalculate), the dependent study normally is going to be referencing arrays with zero values if it is calculated before the Study/Price Overlay study.
To solve this problem requires changing the calculation order. Refer to Study Calculation Precedence And Related Issues for instructions.
Data Changing at Chart Bars Earlier Than Being Referenced in Source Chart
A problem that can be experienced with the Study/Price Overlay study relates to when it is referencing a study in the source chart that changes its values at chart bars earlier than the last bar in the chart, or earlier than the prior last bar and any new bars added to the chart, during normal chart updating.
What happens in this particular case is that the changes in the source study at chart bars earlier than the last bar or earlier than the prior last bar and any new bars added to the chart, are not reflected by the Study/Price Overlay study on the destination chart.
A good example of a study that changes its values at chart bars earlier than the last bar in the chart is the Zig Zag. There are other studies as well that do this. For example, the Arithmetic studies could do this.
In the case of the Zig Zag study and some other Sierra Chart studies (Zig Zag Cumulative Volume, Daily OHLC, Weekly OHLC, Depth of Market Data, Swing High and Low, High/Low for Time Period, Initial Balance, all of the Arithmetic studies) there is automatic management of this kind of issue so it causes no problem with the output of the Study/Price Overlay study because the Study/Price Overlay study automatically references data as early as is necessary from the source chart study based upon what chart bar the data changed at in the source chart study.
However, this can be a problem with other studies where there is not this special management. If you are certain you are encountering this problem and the Study/Price Overlay is referencing a built-in study that is changing at earlier chart bars, then let Sierra Chart Support know about this to see if we can implement special management for that particular study.
If you have developed your own custom study, and it changes its data at chart bars earlier than the last bar in the chart, at times when there is not a full recalculation, then for the Study/Price Overlay study to be aware of those changes use the sc.EarliestUpdateSubgraphDataArrayIndex variable.
Resolving Issue Where Subgraphs from Source Chart Are Not Visible
Follow the below procedure to solve a problem where the Subgraph lines from the source study do not display on the destination chart where the Study/Price Overlay study is added.
- Verify there are nonzero values using the Chart Values Tool for the Study Subgraphs of the Study/Price Overlay study and to see what the values are. If the values are outside the range of visible prices in the chart, increase the range of prices with Interactive Scale Range.
- Set Fill Blanks with Last Value Input to Yes.
- Check the Study Subgraph Draw Styles in the source study. Make sure they are not Hidden or Ignore.
You may want to set Use Styles and Widths from Source Study to No, and set the Draw Styles directly on the Study/Price Overlay study on the Subgraphs tab. - Check the Scale Range setting on the study. Normally it should be Automatic.
- Check the Scale Range for the main price graph. Normally it should be Automatic.
*Last modified Thursday, 29th February, 2024.