Home >> (Table of Contents) Studies and Indicators >> Technical Studies Reference >> Volume by Price
Technical Studies Reference
- Technical Studies Reference
- Common Study Inputs (Opens a new page)
- Using Studies (Opens a new page)
Volume By Price Study
- Introduction
- Step By Step Instructions
- Example Chart Images
- Volume by Price Input Settings
- Draw Mode
- Number Of Periods Back To Reference
- Ticks Per Volume Bar
- Volume Graph Period Type
- Visible Bars
- Multiple Profiles Based on Bar Count
- Multiple Profiles Based on Fixed Time
- One Period at End of Fixed Time Length
- Based on TPO Chart
- From Start Date-Time To End
- From Start Time To End
- From Start Date-Time + Fixed Time Length
- From Start Date-Time To End Date-Time
- One Period Based On Bar Count
- From Session Start Time to End
- One Period from Start Time to End Time
- Multiple Profiles from Start Time to End Time
- One Period from Most Recent Period Start to End
- All Bars in Chart
- Specified Volume
- One Period at End of Fixed Time Length - Auto-Skip Empty Days
- Trading Day Start Time to End - Reset at Day Session
- Set as Independent Volume Profile for TPO Chart
- Time Period Type for 'Fixed Time'
- Time Period Length for 'Fixed Time'
- Number of Bars for 'Based On Bar Count'
- Volume per Profile for 'Specified Volume'
- Number of Days To Calculate Volume Profiles
- Start Date
- Use Different Start Time
- Start Time
- End Date
- End Time
- Use Separate Profile for Evening Session
- Exclude Evening Session Profiles Except for Last Day
- Maximum Volume Bar Width Type
- Maximum Volume Bar Width Percentage
- Right Align Volume Bars
- Display Volume in Bars
- Volume Text Threshold
- Always Display Last Profile Within View
- Volume Bar Calculation Method
- Value Area, POC, Peak and Valley Based on Total Volume Always
- Bid Volume and Ask Volume Coloring Method
- Draw Outline When Coloring Bid Volume And Ask Volume
- Draw Difference of Bid and Ask Volume Using Percent of Max Bar
- Difference of Bid and Ask Volume Coloring Percentage of Maximum Bar
- Use Transparent Draw Style
- Transparency Level
- Highlight Value Area
- Extend Value Area
- Value Area Percentage
- Highlight Point of Control
- Extend Point of Control
- Future Intersection Method
- Extend Volume Weighted Average Price
- Align Volume Numbers to Base of Volume Bars
- Volume Bars Draw Method
- Allow Side-By-Side Profiles on Right Side
- Use Defined Width for Side-By-Side Profiles on Right
- Draw Profile Outline Enclosing Bars
- Draw Peaks and Valleys
- Peaks and Valleys Sensitivity
- Include High/Low in Peaks and Valleys
- Align to Far Right
- Do Not Overlap DOM Graph
- Extend Peaks and Valleys
- Highlight Value Area High and Low Only
- Calculate Developing POC and Value Area
- Color Code Volume Bars Based on Percentage of POC
- Number of POC Ranges to Color
- #%-#% POC Color
- Display Data in Chart Values Window
- Show Chart Values On Profile
- Chart Values Position on Profile
- Text Font Size
- Chart Value# (1-4) To Be Displayed On Profile
- Calculate Mean Price and Standard Deviation Bands
- Volume Bar Minimum Width in Chart Bars
- Include Fill Space in Developing Period Width
- Use Large Number Display Formatting
- Minimum Time Period % for Reference Days Back
- Volume Profile Bars Length Relative to All Visible Profiles
- Number of Custom Intraday Sessions
- Custom Intraday Session# (1-5) Begin Time
- Custom Intraday Session# (1-5) End Time
- Examples of Input Settings for Different Volume Profiles
- 1 Day Volume Profiles Across Entire Chart
- 1 Week Volume Profiles Across Entire Chart
- 1 Day Volume Profiles Across Entire Chart Based on Session Times Different than Chart
- 1 Day Volume Profile At End of Chart
- 1 Day Volume Profiles Showing Prior Day
- Current Month Volume Profile at End of Chart
- 1 Hour Volume Profile At End of Chart
- 30 Minute Volume Profile at End of TPO Profile Chart
- One Volume Profile at End for Day Session
- One Volume Profile at End for Evening Session
- One Volume Profile at End Covering Three Days
- One Volume Profile per Chart Bar
- One Volume Profile for Multiple Bars
- Outline Only with Volume
- 20 Day Point of Control at End of Chart Based on 24 Hour Session
- 1 Day Total Volume with Bid Ask Delta on Right
- Controlling the Study Display Order Relative to the Price Graph Bars and Other Studies
- Color and Width Settings
- Point of Control (SG2)
- Value Area High Value (SG3)
- Value Area Low Value (SG4)
- Volume Weighted Average Price (SG5)
- Bid Volume and Ask Volume Colors (SG6)
- Volume Numbers Text Color and Size (SG7)
- Volume Bars Outline and Fill Colors (SG8)
- Value Area and Outline (SG9)
- Evening Session Volume Bars Outline and Fill Colors (SG11)
- Trade Weighted Mean Price (SG12)
- Mean Price + Std Dev (SG13)
- Mean Price - Std Dev (SG14)
- Mean Price + 2 * Std Dev (SG15)
- Mean Price - 2 * Std Dev (SG16)
- Volume Profile Enclosing Outline (SG17)
- Volume Peaks (SG18)
- Volume Valleys (SG19)
- Value Area BidVolume and AskVolume Colors (SG20)
- PointOfControl BidVolume and AskVolume Colors (SG21)
- Extension Line Labels
- Volume Value Area
- Right Aligning Profiles with Space on Right Side
- Single Volume Profiles At End of Chart
- Single Bar Volume Profiles with Bid Volume and Ask Volume
- Displaying Separate Profiles for Day and Evening Sessions
- Displaying Single Separate Profiles for Day and Evening Sessions
- Calculating and Displaying Developing Point of Control, Value Area High/Low, Volume Weighted Average Price Lines
- Displaying Mean Price and Standard Deviation Lines
- Viewing Volume Profile Text Information
- Volume at Price Calculations
- Volume Profile Differences
- Basic Volume Profile Troubleshooting Procedures
- How Volume at Price is Calculated for Historical Daily and higher Timeframe Charts
- Draw Volume Profile
- Description
- Tool Usage
- Step by Step Instructions to Configure the Draw Volume Profile Tool
- Manually Drawn Volume Profiles That Automatically Extend to the Last Bar
- Modifying Manually Drawn Volume Profile
- Erasing Drawn Volume Profiles
- Draw Volume Profile Tool Related Settings
- Drawing Tool Configuration
- Programmatically Accessing Volume at Price Data
Introduction
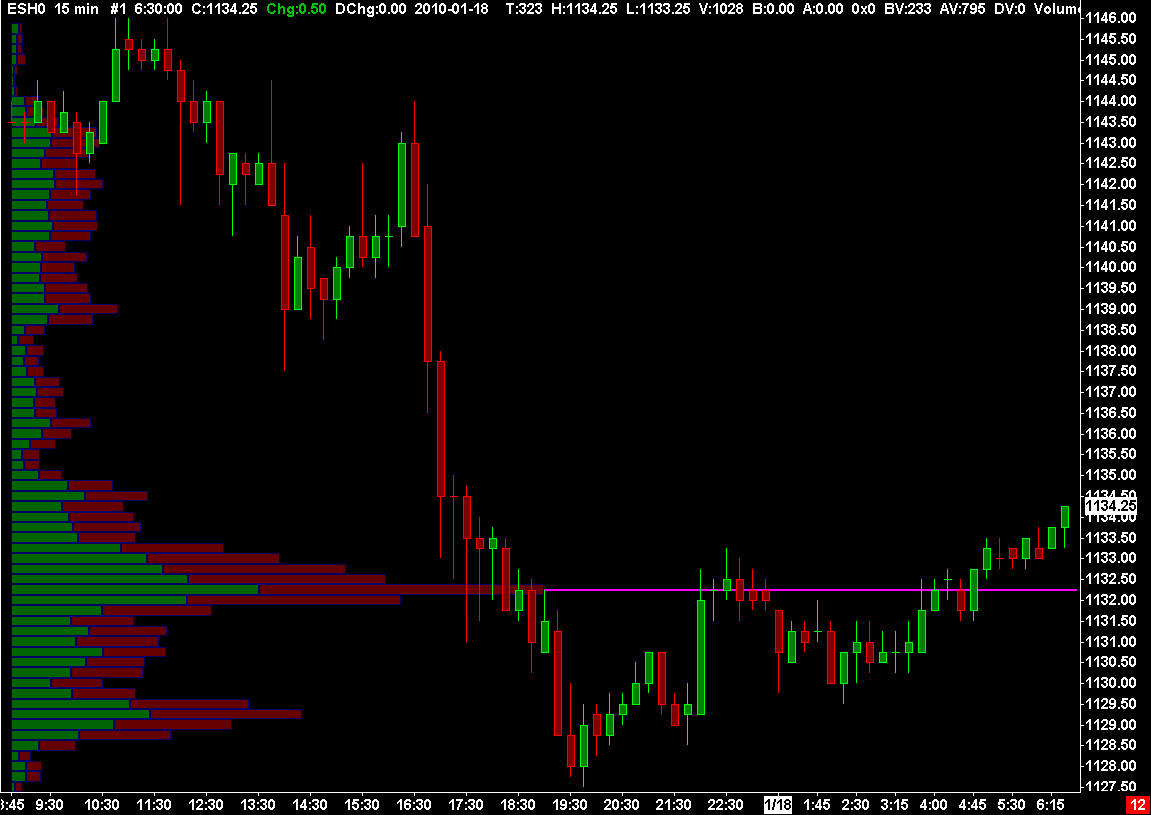
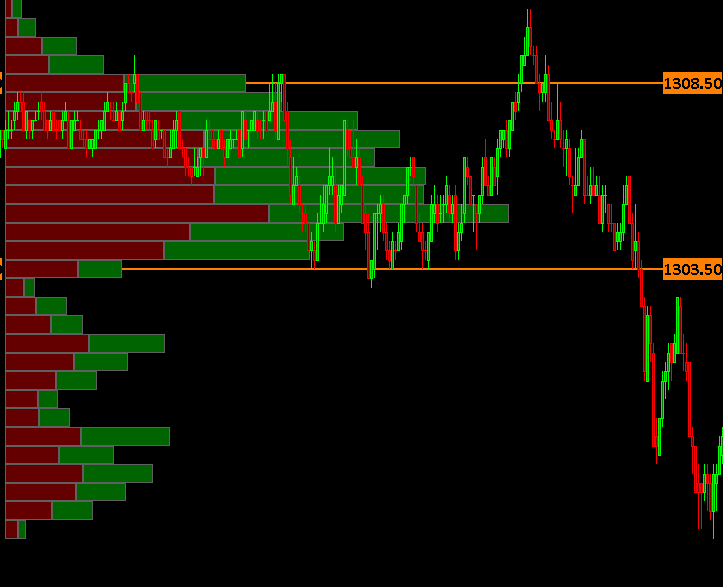
The Volume by Price study overlays a Volume Profile graph for each period onto a bar chart. The cumulative volume at each price increment over a specified period of time are displayed as horizontal bars in the background of a bar chart. Refer to the image at the top of this page for an example.
The Volume by Price study is included with Sierra Chart package 3. Sierra Chart package 5 also includes the Draw Volume Profile drawing tool (explained below).
Step By Step Instructions
- Open a chart if one is not already open. Refer to Open Chart.
- Select Chart >> Chart Settings. Make sure the Tick Size is set correctly. The Tick Size is the minimum increment that a symbol trades in. If the Tick Size is too small, then it will take a long time to load chart data from the symbol data file and will increase CPU usage. If the Tick Size is too large, then this study will not be very accurate with its volume profiles.
If the Tick Size is not a multiple of the actual Tick Size, then this may also reduce the accuracy of the Volume Profiles by causing volume to not always be mapped to the correct price levels. - In the case of Historical Charts (Daily, Weekly, Monthly charts), you may need to set the Volume at Price (VAP) Multiplier to a value higher than 1 to improve performance and reduce memory. This is true if the Tick Size is relatively small compared to the chart values. For stocks, you may want to set the VAP Multiplier to somewhere between 5 to 10.
For cash indexes in the hundreds or thousands, you may need to set the VAP Multiplier to 10 or 100. If it takes a long time to load chart data for Historical charts, the interface of Sierra Chart freezes occasionally, or the memory use is high, then increase the VAP Multiplier.
In almost all cases the VAP Multiplier for Intraday charts needs to be set to 1. - Press OK.
- You need to have data records in the Intraday chart data file for the symbol that are 1 Tick or 1 Second when using the Volume by Price study for good accuracy. To change the related settings, refer to Tick by Tick Data Configuration.
When the data records in an Intraday chart data file are not 1 Tick, and are of a larger timeframe per record, the volume for a price level within the price range of a data record is the average volume per price based upon the price range of the data record and the total volume of that data record. The average volume per price is calculated by dividing the total volume by the number of prices in the price range. The number of prices is based upon the chart Tick Size. - Select Analysis >> Studies on the menu.
- In the list of Studies Available select Volume By Price.
- Press the Add button. The Volume By Price study can be added multiple times to the chart if you require different Volume Profile configurations.
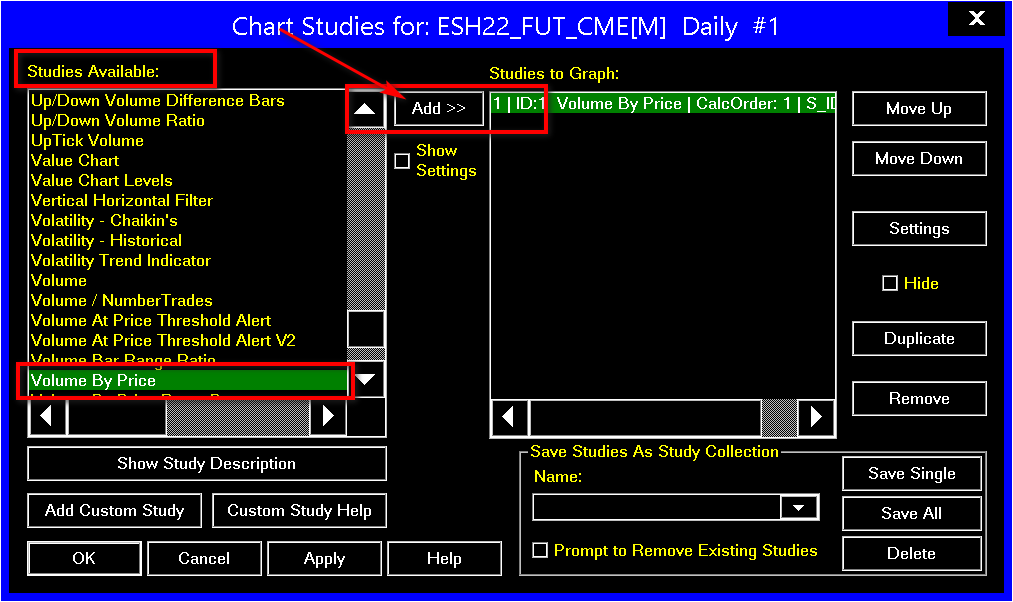
- If the Study Settings window did not automatically open, then press the Settings button to open the Study Settings window.
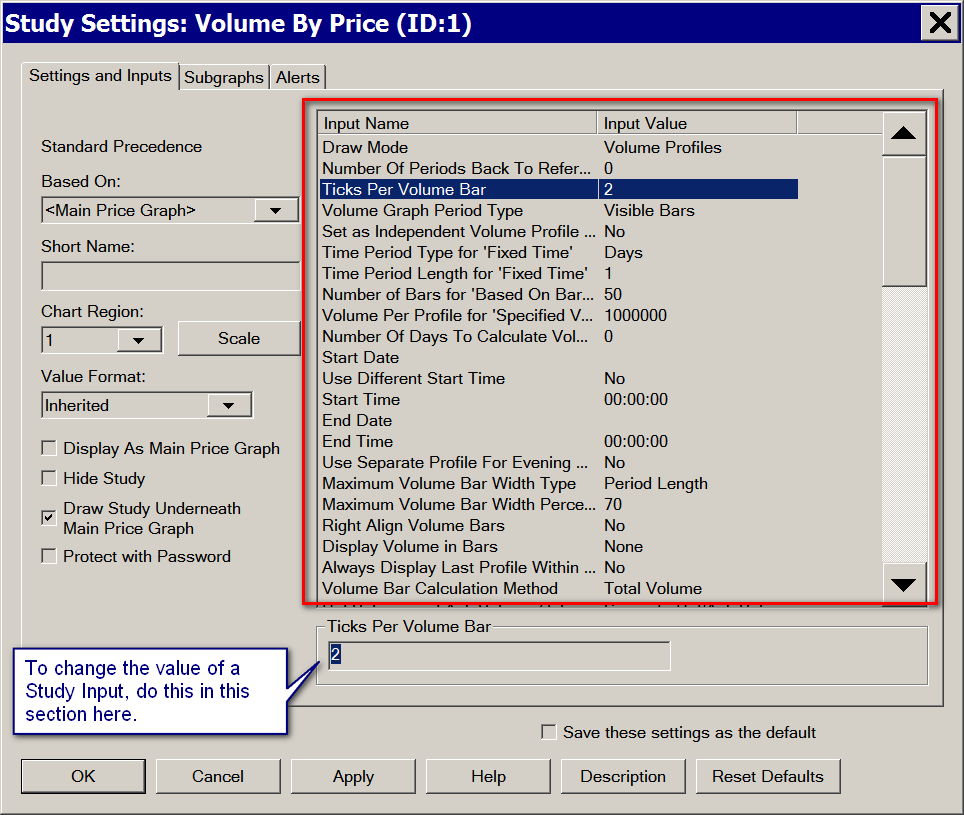
- Select the Settings and Inputs tab. Set the study Input settings as you require. For a complete description for each of the Inputs, refer to the Volume by Price Input Settings section.
- Set the Ticks Per Volume Bar Input setting. This should be set to 1 or 2. In the case when you are using the Volume by Price study on a Daily, Weekly or Monthly Historical chart, we do not recommend setting this to 1. You should use a higher value somewhere between 4 to 10. Otherwise, CPU load could increase significantly.
- Set the Volume Graph Period Type Input setting to what you require. This is the most important setting and controls the time length of the Volume Profiles and whether there are multiple Volume Profiles or one of them.
In the case where you want to have Volume Profiles which are 1 Day each, set Volume Graph Period Type to Multiple Profiles Based on Fixed Time. Set the Time Period Type for 'Fixed Time' input to Days and set the Time Period Length for 'Fixed Time' input to 1. Refer to the image below.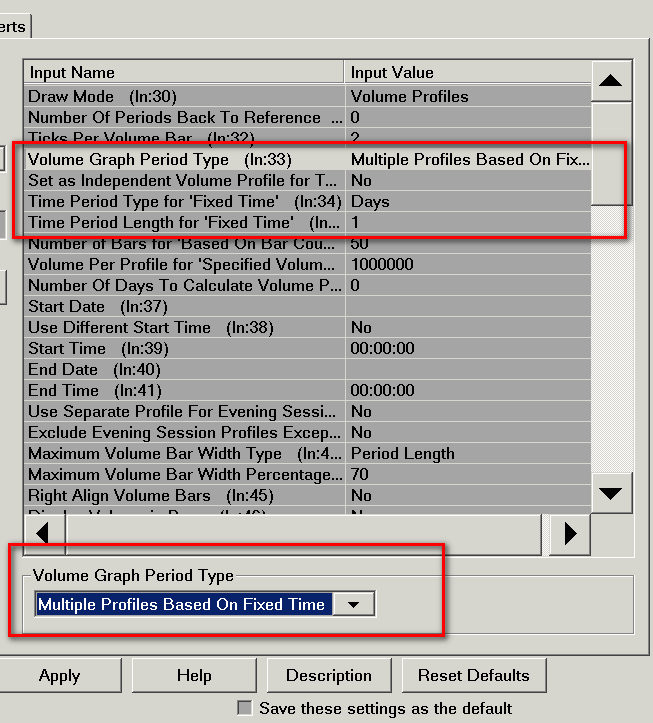
- Select the Subgraphs tab, and set the colors as you require. The Outline and the Fill color of the volume bars are set with Subgraph SG16. If you have the input Color Bid Volume and Ask Volume set to Yes, then those colors are set with Subgraph SG13. For more information, refer to the Color Settings section.
- Press OK.
- Press OK.
- When you first add the Volume by Price study to the chart, the chart may reload its data from the symbol data file in order to load the necessary volume data from the symbol data file that is required by this study, if the volume data has not already been loaded by another study that requires it.
Example Chart Images
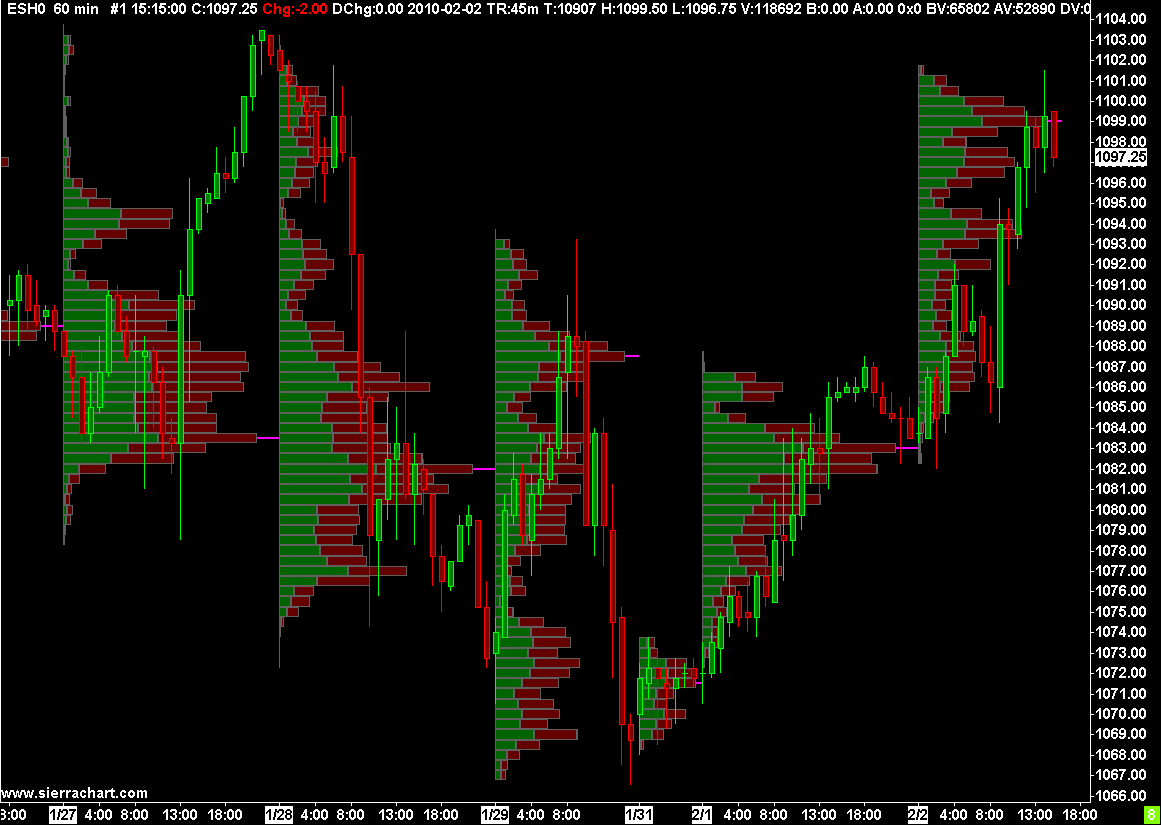
This image shows a Volume by Price graph with the Volume Graph Period Type set to Visible Bars and where each volume bar represents a single price tick. The volume number for each volume bar is also shown.
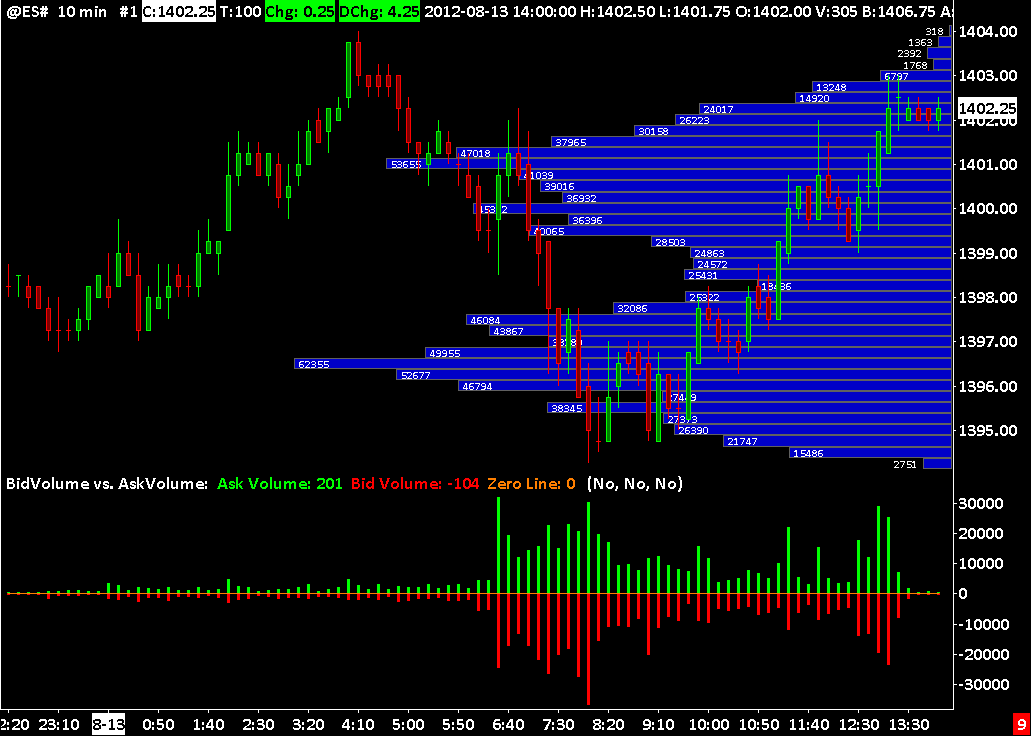
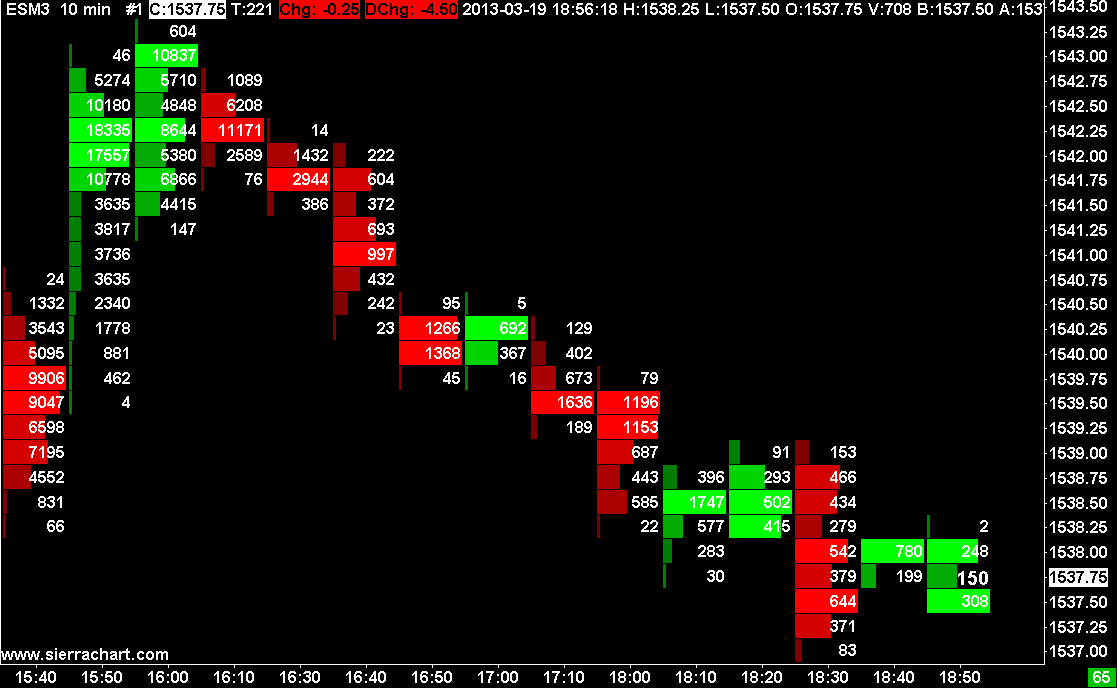
This image shows 1 Day Volume Profiles on an Intraday chart. Each volume bar also is color-coded to indicate the Bid Volume and Ask Volume component of the bars.
This image shows a Volume by Price study set to 1 Bar for each profile and combined with the Numbers Bars study.
Volume by Price Input Settings
- To open the Volume by Price Input settings window, select Analysis >> Studies on the menu.
- Select the Volume by Price study in the Studies to Graph list.
- Press the Settings button.
- Select the Settings and Inputs tab of the Study Settings window. The inputs are displayed on this tab.
Draw Mode
The following are the descriptions of the different Draw Mode settings.
- Volume Profiles: This setting specifies that only Volume Profiles and other related drawings like extension lines are drawn.
- POC, VAH, VAL Lines Only: This setting specifies that the Point of Control, Value Area High, Value Area Low and Volume Weighted Average Price study Subgraph lines are drawn only.
In this case the Value Area High Value and Value Area Low Value Subgraphs on the Subgraphs tab must be set to a Draw Style other than Ignore or Hidden, to be visible.
In this particular mode, the study Subgraphs containing the Point of Control, Value Area High, Value Area Low and Volume Weighted Average Price data are drawn only. The Volume Profiles and any related drawings like extension lines are not drawn.
The primary reason for this Draw Mode allows the Volume by Price study to function identically to the Volume Value Area Lines study and take advantage of the additional Period Types available. - Volume Profiles & POC, VAH, VAL Lines: This setting specifies that both the Volume Profiles and Point of Control, Value Area High, Value Area Low and Volume Weighted Average Price study Subgraph lines will be displayed on the chart.
For additional information related to Draw Mode, refer to Calculating and Displaying Developing Point of Control, Value Area High/Low, Volume Weighted Average Price Lines.
With this setting in the Volume by Price study, the Volume Value Area Lines study is considered an older out of date study because Volume by Price can display lines only and has a lot more functionality. However, the Volume Value Area Lines study can still be used for efficiency if it meets your requirements, since it is faster.
Number Of Periods Back To Reference
This setting only applies when the Volume Graph Period Type Input setting is set to Multiple Profiles Based on Bar Count or Multiple Profiles Based on Fixed Time. It does not apply to any other Volume Graph Period Type.
When this is set to 0, then a Volume Profile is based upon the chart bars where it is drawn.
When this is set to a nonzero value, then a Volume Profile references the specified number of periods back relative to where it is drawn.
For example, if this is set to 1, and the Volume Profiles have a Time Period Length and Type of 2 Days, then the prior two days will be used in the calculation of the Volume Profile for a particular time period.
If there is insufficient data found at the period back being referenced, then the prior period will be used. The skipping of a period continues until a period of time is found with sufficient data. The setting that controls what is considered a sufficient amount of data is the Minimum Time Period % for Reference Days Back Input.
This is calculated based upon the average time span of the bars in that time period and the time period required. For example, if this is set to 25 percent and the time period referenced needs to be 1 Day in Length, then it is considered sufficient if only 6 hours are in that period.
This calculation can still consider periods of time where there is no trading within a day if that period of time is not filtered out by the chart Session Times. This can occur at the end of the week where the time length of the last bar until the End Time exceeds the actual time length of the bar.
Ticks Per Volume Bar
The Ticks Per Volume Bar setting specifies how many price ticks, based upon the Tick Size setting in Chart >> Chart Settings, each horizontal volume bar includes.
This controls the grouping of prices that were traded at during the specified period of time for each Volume Profile. The default is 2. This is 2 price ticks. In this case, for every two adjacent prices traded, there will be one horizontal volume bar.
For the maximum amount of detail you will want to set this to 1.
When Ticks Per Volume Bar is set to 0, it will be automatically changed to 2.
There will only be a horizontal volume bar in a Volume Profile at a price level or for a group of prices (when using a Ticks Per Volume Bar > 1), if there is trading activity at that particular price level or prices during the time period that the Volume Profile displayed is for.
In the case when you are using the Volume by Price study on a Daily, Weekly or Monthly Historical chart, we do not recommend setting this to 1. You should use a higher value somewhere between 4 to 10. Otherwise, CPU load could increase significantly. Additionally for these types of charts, select Chart >> Chart Settings and set the Volume at Price Multiplier somewhere between 5 to 10 to decrease CPU load.
When the Chart >> Chart Settings >> Volume at Price Multiplier is set to a value other than 1, then the Ticks Per Volume Bar setting needs to match it or be a multiple of it. For example, if the Volume at Price Multiplier is set to 5, then set Ticks Per Volume Bar also to 5 or a higher even multiple like 10 or 15.
If you find that the Ticks Per Volume Bar setting changes from the value you set it at, this is because the Chart >> Chart Settings >> Volume at Price Multiplier is set to a value other than 1 and it is automatically being changed to a multiple of the Volume at Price Multiplier.
Volume Graph Period Type
This setting controls the time period for each Volume Profile. Or, specifies that one profile is to be displayed and based upon the specified time period.
When using the Volume by Price study on a Trading DOM, the only options that will work for this Input are One Period Based on Bar Count or From Session Start Time to End, otherwise this Input is automatically set to From Session Start Time to End.
Visible Bars
This defines a dynamic period based on the main price graph bars that are displayed/visible on the chart window. Only a single Volume Profile will be displayed.
When using Visible Bars, the Point of Control, Value Area High Value and Value Area Low Value study Subgraphs will have incomplete data across the visible bars when looking at these Subgraph values on a Sheet when using one of the Spreadsheet studies due to the fact that there is a delayed calculation in this case.
Multiple Profiles Based on Bar Count
This defines a fixed period for the Volume Profiles based on the number of price graph bars specified with the Number of Bars for 'Based On Bar Count' setting. Multiple Volume Profiles are drawn from the beginning of the chart.
Multiple Profiles Based on Fixed Time
This defines a fixed period for the Volume Profiles based on the Time Period Type for 'Fixed Time' and the Time Period Length for 'Fixed Time' settings. Multiple Volume Profiles are drawn from the beginning of the chart.
These Volume Profiles use the Session Times settings for the chart and the Volume Profiles will start at the Session Times >> Start Time or the Evening Start when using the Evening Session.
One Period at End of Fixed Time Length
This defines a single fixed Volume Profile period at the end of the chart of exactly the time length specified by the Time Period Type for 'Fixed Time' and the Time Period Length for 'Fixed Time' settings.
This Volume Profile is of the full specified time length counting back from the Date-Time of the last bar in the chart. For example, if the Time Period is 1 Day and the last bar in the chart has a time of 10:14:59, then the profile will begin at 10:15:00 in the prior day.
The Volume Profile is going to be fully recalculated when there is a new bar added to the chart. To increase the recalculation rate set the chart bars to a shorter time frame like 1 minute per bar.
In the case where the Volume Profile has a Time Period longer than 1 month, we recommend using From Start Date-Time To End for efficiency.
Based on TPO Chart
This defines Volume Profiles that are based upon the starting time and time length of the TPO Profiles in the chart. This is only valid when using the TPO Profile Chart study. This option is automatically set in this case.
From Start Date-Time To End
This defines one Volume Profile from the specified Start Date and Start Time settings to the end of the chart.
For Volume Profiles on Intraday charts where the Volume Profiles have a Time Period longer than 1 month, we recommend using this particular Volume Graph Period Type for efficiency.
From Start Time To End
This defines one Volume Profile from the specified Start Time in the last day in the chart, to the end of the chart. The Start Time is set through the Start Time Input.
From Start Date-Time + Fixed Time Length
This defines one Volume Profile from the specified Start Date and Start Time settings, that has a time length set by the Time Period Type for 'Fixed Time' and the Time Period Length for 'Fixed Time' settings.
From Start Date-Time To End Date-Time
This defines one Volume Profile from the specified Start Date and Start Time settings to the specified End Date and End Time settings.
One Period Based On Bar Count
This defines one Volume Profile at the end of the chart that is based upon the number of bars specified through the Number of Bars Based On Bar Count setting.
From Session Start Time to End
This defines one Volume Profile at the last day in the chart that starts at the Chart >> Chart Settings >> Session Times >> Start Time setting, until the last bar the chart. For additional information, refer to Session Times.
One Period from Start Time to End Time
This defines one Volume Profile at the last day in the chart that starts at the Start Time Input and ends at the End Time Input.
Multiple Profiles from Start Time to End Time
This will create multiple Volume Profiles across the entire chart that cover a shorter duration of time in the chart than specified by the Session Times you have set in Chart >> Chart Settings. Use the Start Time and End Time Input settings to set the starting and ending times.
One Period from Most Recent Period Start to End
This defines one Volume Profile which starts at the beginning of the most recent period defined by the Time Period Type for 'Fixed Time' and Time Period Length for 'Fixed Time' inputs, and goes to the last chart bar.
All Bars in Chart
This creates one single Volume Profile which includes the volume data for all of the bars loaded in the chart.
Specified Volume
This creates multiple Volume Profiles in the chart where a new Volume Profile is created when the specified volume is reached for that Volume Profile. The volume is specified with the Volume per Profile for 'Specified Volume' Input. The volume of each Volume Profile will be equal to or greater than the number specified. Most of the time it will be greater because a new Volume Profile will not be created until there is a new bar in the chart after the specified volume has been reached.
One Period at End of Fixed Time Length - Auto-Skip Empty Days
This is the same as One Period at End of Fixed Time Length except that when Time Period Type for 'Fixed Time' is set to Days, the Volume Profile will go back the specified number of Days and begin at the start of the trading day according to the Session Times. Empty days will be automatically skipped according to the Minimum Time Period % for Reference Days Back Input.
Trading Day Start Time to End - Reset at Day Session
This creates one Volume Profile at the end of the chart which starts at the trading day Start Time which is based on the Session Times, when not using the Evening Session Times.
When using the Evening Session Times, and the latest Date-Time in the chart is in the day session, than the volume Profile will start at the Session Times >> Start Time. When the Evening Session is encountered, then the Volume Profile will start at the Session Times >> Evening Start Time. So it always resets itself to the beginning of the current session within the overall trading day, when using the Evening Session Times.
Set as Independent Volume Profile for TPO Chart
This Input only applies to charts that use the TPO Profile Chart study.
When this Input is set to Yes, then it is possible to set the Volume Graph Period Type Input to a setting other than Based on TPO Chart. However, Visible Bars is not supported when Set as Independent Volume Profile for TPO Charts is set to Yes.
This allows for Volume Profiles which have a time period completely independent of the TPO Profiles.
When this Input is set to Yes, then the Right Align Volume Bars and Align to Far Right Inputs will both automatically be set to Yes.
Time Period Type for 'Fixed Time'
When the Volume Graph Period Type is set to one of the following:
- Multiple Profiles Based on Fixed Time:
- One Period at End of Fixed Time Length:
- From Start Date-Time + Time Length:
- One Period from Most Recent Period Start to End:
Then this input setting specifies the time period length for the Volume Profiles. It works with the Time Period Length for 'Fixed Time' setting. The setting can be one of the following:
- Seconds
- Minutes
- Days
- Weeks
- Months
- Years
In the case of Volume Profiles based on Weeks, Months or Years, the Volume Profiles will always start at the beginning of the Week, Month, and Year respectively. In the case of profiles which are based upon multiple Weeks, multiple Months, or Multiple Years, these are relative to January 1, 1950.
In the case where you want to have Volume Profiles which are 1 Day each, set Volume Graph Period Type to Multiple Profiles Based on Fixed Time. Set the Time Period Type for 'Fixed Time' input to Days and set the Time Period Length for 'Fixed Time' input to 1.
When Volume Profiles are set to be a 'Fixed Time', then for them to be 100% accurate and exactly based upon this fixed amount of time, it is necessary under some conditions for the time period of the underlying chart bars to evenly divide into this fixed amount of time. For example, if Time Period Length for 'Fixed Time' and Time Period Type for 'Fixed Time' are set to 60 Minutes, then the period of the underlying chart bars will need to evenly divide into this time.
For example, the chart bars can be 5 minutes, 10 minutes, 30 minutes or 60 minutes or any other time period which evenly divides into them. Therefore, using variable time period bars like those based upon Number of Trades or Volume, will result in Volume Profiles which are not always 60 Minutes and instead they would be based upon the overall time length of the chart bars which best fit into the 60 Minutes timeframe. This rule is not always absolute. For example, if the Volume Profiles are 1 Day, and Chart >> Chart Settings >> New Bar At Session Start is enabled, then the underlying bars can be any timeframe.
Similar to the above, if the Volume Profiles are set to be, for example, 60 minutes and the chart bars are 180 minutes each, then it is not possible for there to be 3 Volume Profiles per bar. There is only going to be one Volume Profile per bar and they will be a time length of 180 minutes which is equivalent to the bar time period.
Time Period Length for 'Fixed Time'
This works with the Time Period Type for 'Fixed Time' setting. It specifies the number of Seconds, Minutes, Days, Weeks, Months or Years.
Number of Bars for 'Based On Bar Count'
When Multiple Profiles Based On Bar Count or One Period Based On Bar Count is selected for the Volume Graph Period Type setting, this setting defines how many chart bars the Volume Profiles will be based on.
The chart bars are counted from the first bar in the chart and repeat after that.
Volume per Profile for 'Specified Volume'
This defines the volume amount to be used when the Volume Graph Period Type is set to Specified Volume.
The volume of each Volume Profile will be equal to or greater than the number specified in this input. Most of the time it will be greater because a new Volume Profile will not be created until there is a new bar in the chart after the specified volume has been reached.
Number of Days To Calculate Volume Profiles
The default for this Input is 0. When this is set to a nonzero number, this specifies the number of days in the chart that Volume Profiles are calculated for from the last date loaded in the chart. For example, if this is set to 10 and the chart has 100 days of data loaded, then Volume Profiles will only be calculated for the last 10 days in the chart.
When this is set to 0, then Volume Profiles are calculated for all days loaded in the chart.
This Input has no effect upon the time length of individual Volume Profiles in the chart, other than possibly the first one calculated. For example, if there is a Volume Profile which has a time length of 90 days and this Input is set to 10, then that Volume Profile will only consist of 10 days.
Start Date
This setting is used to specify a Start Date when the Volume Graph Period Type requires a Start Date.
Use Different Start Time
Set this option to Yes to specify a different Start Time for the Volume Profiles that differs from the Session Times in Chart >> Chart Settings. The time is set through the Start Time Input setting.
Start Time
This setting is used to specify a Start Time when the Volume Graph Period Type requires a Start Time.
This time setting is relative to the Time Zone setting you have set in Global Settings >> Data/Trade Service Settings.
End Date
This setting is used to specify an End Date when the Volume Graph Period Type requires an End Date.
End Time
This setting is used to specify an End Time when the Volume Graph Period Type requires an End Time.
This time setting is relative to the Time Zone setting you have set in Global Settings >> Data/Trade Service Settings.
Use Separate Profile for Evening Session
When this option is set to Yes and you have defined and enabled the Evening Session Times in Chart >> Chart Settings, then a separate Volume Profile will be displayed for the evening session. This means you will have 2 profiles for each day in an Intraday chart.
This option is only valid when the Volume Graph Period Type Input is set to Multiple Profiles Based on Fixed Time and the Time Period for the volume profiles is set to 1 Day.
You must also define and enable the Evening Session Times in Chart >> Chart Settings for this setting to work. Refer to Session Times for more information.
When this Input is set to Yes, the time period for chart bars must not be greater than the time span of either the main session or the evening session.
The color of the Evening Session Volume Profiles is controlled with the Evening Session Volume Bars Outline and Fill Colors Subgraph.
For step-by-step instructions to use this Input, refer to Displaying Separate Profiles for Day and Evening Sessions.
Exclude Evening Session Profiles Except for Last Day
When this input is set to Yes the Evening Session information is excluded from the calculation and placement of the Volume Profiles, except for the last day of chart data where the Evening Session information is included.
Maximum Volume Bar Width Type
This can be set to Period Length, Window Width, or Automatic.
This setting allows you to base the width (horizontal length) of the volume bar with the maximum volume in the Volume Profile to be based upon the width of the chart window (Window Width), the length of the Volume Profile period (Period Length), or automatically switch between Window Width and Period Length when you have selected Automatic.
When using Window Width, the width is based upon the overall width of the visible bars in the chart. If there is a blank area on the right side of the chart due to setting a Right Side Fill Space or not enough bars to fill up the chart, then that blank area is not considered in the calculation of the available space.
When using a setting of Automatic, the Length is used if it is less than the window width. Otherwise, the Window Width is used.
Also refer to the related setting Maximum Volume Bar Width Percentage.
Maximum Volume Bar Width Percentage
This percentage setting works with the Maximum Volume Bar Width Type setting and specifies the percentage of the Window Width or the Period Length that the maximum volume bar horizontal width will use of the total available width.
This input takes integer values between 1 and 100. Values entered outside of this range will be removed and the value set to the closest value of 1 or 100.
Right Align Volume Bars
Normally the Volume Profile bars are displayed at the beginning of each period with the base of the volume bars going from left to right. When the Right Align Volume Bars setting is set to Yes, the Volume Profile bars will be displayed at the right side of each period with the base the volume bars going from right to left. If you always want the very last displayed Volume Profile, to be aligned to the right side of the chart window beside the Values Scale, refer to Right Aligning Profiles with Space on Right Side.
When this setting is set to Yes, and the Bid Volume and Ask Volume portion of the volume bars are colored, then the Bid Volume will be on the right side of the volume bar and the Ask Volume will be on the left.
Display Volume in Bars
This setting lets you choose to display numerical data for each horizontal Volume Bar of any of the specified types:
- None: This displays no text information in the Volume Bar.
- Total Volume: This displays the total volume traded at the given price(s) for the specified period of time for each Volume Bar.
- Total Volume - POC Only: This displays the total volume traded at the given price(s) for the specified period of time for only the volume bar that is the Point of Control (the volume bar with the highest volume).
- Bid Volume x Ask Volume: This displays both the Bid Volume and the Ask Volume in the form of Bid Volume x Ask Volume for each Volume Bar.
- Ask Volume - Bid Volume: This displays the difference between the Ask Volume and Bid Volume for each Volume Bar.
- Number of Trades: This displays the number of trades that have taken place at the given price(s) for the specified period of time for each Volume Bar. When this is the setting used, the display will show the number of trades followed by a T - for example 2819T.
- Bid Volume - Ask Volume: This displays the difference between the Bid Volume and the Ask Volume for each Volume Bar.
- Ask Volume - Bid Volume, TotalVolume: This displays the difference between the Ask Volume and the Bid Volume along with the Total Volume for each Volume Bar. The values are shown in the form Volume Difference | Total Volume - for example 785 | 6783.
- Volume at High/Low: This displays the Total Volume only in the volume bars located at the highest price point and the lowest price point.
- Percent of Maximum Volume of Volume Bars: This displays a percentage for each volume bar. The percentage is determined by taking the volume in the given bar divided by the volume in the Point of Control bar (the bar with the highest volume). This results in the Volume Bar that is the Point of Control having a value of 100%.
- Percent of Total Volume: This displays a percentage for each volume bar. The percentage is determined by taking the volume in the given bar divided by the total volume from all volume bars within the given Volume Bars display. This results in the sum of all percentages to equal 100%.
- Ask Volume Bid Volume % of Total Volume: This displays the percentage values of the Ask Volume and the Bid Volume for each Volume Bar. The Ask Percentage is calculated as: Ask Percentage = Ask Volume / Total Volume in Bar. The Bid Percentage is calculated as: Bid Percentage = Bid Volume / Total Volume in Bar.
- Total Volume (Price): This displays the Total Volume and the associated price for each Volume Bar. The information is displayed as Volume (Price) - for example 4255 (2466.25), where 4255 is the total volume at price 2466.25.
- Diagonal Ask Vol Bid Vol Difference: This displays the diagonal difference between the Bid and Ask Volumes. The Bid Diagonal Difference Volume is defined as: Bid Diagonal Difference Volume = Bid Volume at Given Price - Ask Volume at Next Higher Price. The Ask Diagonal Difference Volume is defined as: Ask Diagonal Difference Volume = Ask Volume at Given Price - Bid Volume at Next Lower Price. The information is displayed as Bid Diagonal Difference Volume | Ask Diagonal Difference Volume - for example -51 | 530. Refer to Diagonal Comparison of Bid Volume and Ask Volume for more information on diagonal comparisons.
- Diagonal Ask Volume - Bid Volume: This displays the diagonal difference between the Ask Volume and Bid Volume. The calculation always uses the Ask Volume first, which results in the same values diagonally opposing instead of being negatives of each other as seen when using Diagonal Ask Vol Bid Vol Difference. The Bid Diagonal Ask Volume - Bid Volume is defined as: Bid Diagonal Ask Volume - Bid Volume = Ask Volume at Next Higher Price - Bid Volume at Price. The Ask Diagonal Ask Volume - Bid Volume is defined as: Ask Diagonal Ask Volume - Bid Volume = Ask Volume at Price - Bid Volume at Next Lower Price. The information is displayed as Bid Diagonal Ask Volume - Bid Volume | Ask Diagonal Ask Volume - Bid Volume - for example -51 | 530. Refer to Diagonal Comparison of Bid Volume and Ask Volume for more information on diagonal comparisons.
- Bid Volume: This displays the total bid volume for each volume bar.
- Ask Volume: This displays the total ask volume for each volume bar.
The Volume Numbers Text Color and Size Subgraph settings control both the color and font size of the text. The Color settings define the display color of Positive numbers (left color) and Negative numbers (right color). The Size setting controls the font size if it is set to a value other than 0. Otherwise, the font size is controlled automatically.
Volume Text Threshold
This Input setting only applies when the input Display Volume In Bars is set to display text information. Only values that exceed this input will be displayed on the volume bars. The default value is 0 which means all values are displayed on the volume bars.
When Display Volume In Bars is set to display more than one value, like Bid Volume x Ask Volume, text information is displayed only if all the values exceed this input value.
Always Display Last Profile Within View
When the Volume Graph Period Type is set to a value that consists of multiple Volume Profiles, the last profile can often go off the chart window and not be fully visible. When this option is set to Yes, the last Volume Profile is moved to the far right of its period and the bars will always be displayed within view on the chart window while that period is in view.
When none of the bars that are part of the last profile period are in view, the Volume Profile will not be visible.
Volume Bar Calculation Method
This input controls what value is used in the determination of the length of the bars in the Volume by Price study.
The profile bars lengths are determined relative to the position of the end of the bar with the maximum volume. The end point of the bar with the maximum volume is determined from the Maximum Volume Bar Width Type and the Maximum Volume Bar Width Percentage input settings.
The following options for this input setting are available:
- Total Volume: This uses the Total Volume for the calculation of the length of the bars.
- Bid Volume: This uses just the Bid Volume in the determination of the length of the bars. Note that if the setting of Bid Volume and Ask Volume Coloring Method is set to Separate Bid/Ask Volume Coloring or Dominant Bid or Ask Volume Coloring - Full Bar Color the bars will extend further out than what is set in the Maximum Volume Bar Width Type and Maximum Volume Bar Width Percentage due to the addition of the other volumes to the Bid Volume as a base.
By using this setting with the Bid Volume and Ask Volume Coloring Method set to None, the Volume by Price Profiles are displaying only the Bid Volume information. - Ask Volume: This uses just the Ask Volume in the determination of the length of the bars. Note that if the setting of Bid Volume and Ask Volume Coloring Method is set to Separate Bid/Ask Volume Coloring or Dominant Bid or Ask Volume Coloring - Full Bar Color the bars will extend further out than what is set in the Maximum Volume Bar Width Type and Maximum Volume Bar Width Percentage due to the addition of the other volumes to the Ask Volume as a base.
By using this setting with the Bid Volume and Ask Volume Coloring Method set to None, the Volume by Price Profiles are displaying only the Ask Volume information. - Ask Volume - Bid Volume: This uses the absolute value of the difference between the Ask Volume and the Bid Volume in the determination of the length of the bars. When using this calculation setting, the Bid Volume and Ask Volume Coloring Method can only be set to None or Difference of Bid and Ask Volume Coloring.
- Diagonal Ask Volume - Bid Volume: With this calculation method, the length of the bars is determined from either a Bid Diagonal Difference Volume or an Ask Diagonal Difference Volume. The Diagonal Bid Volume Difference is defined as: Bid Diagonal Difference Volume = Absolute Value(Bid Volume at Given Price - Ask Volume at Next Higher Price). The Ask Diagonal Difference Volume is defined as: Ask Diagonal Difference Volume = Absolute Value(Ask Volume at Given Price - Bid Volume at Next Lower Price). The choice of Bid Diagonal Difference Volume or Ask Diagonal Difference Volume is done according to the following rules:
- If the Bid Volume is exclusively dominant, then the Bid Diagonal Difference Volume is used for the calculation of the length of the bars. The Bid Side is exclusively dominant if the Bid Volume at the given price is greater than the Ask Volume at the next higher price point and the Ask Volume at the given price is less than the Bid Volume at the next lower price point.
- If the Ask Volume is exclusively dominant, then the Ask Diagonal Difference Volume is used for the calculation of the length of the bars. The Ask Volume is exclusively dominant if the Ask Volume at the given price is greater than or equal to the Bid Volume at the next lower price point and the Bid Volume at the given price is less than or equal to the Ask Volume at the next higher price point.
- If neither the Bid or the Ask is exclusively dominant (both the Bid and the Ask are dominant or both the Bid and the Ask are not dominant) then the Bid Diagonal Difference Volume is compared to the Ask Diagonal Difference Volume with the following rules:
- If the Bid Diagonal Difference Volume is greater than the Ask Diagonal Difference Volume, then the Bid Diagonal Difference Volume is used for the calculation of the length of the bars.
- If the Ask Diagonal Difference Volume is greater than or equal to the Bid Diagonal Difference Volume, then Ask Diagonal Difference Volume is used for the calculation of the length of the bars.
For more information on Diagonal Calculations refer to Diagonal Comparison of Bid Volume and Ask Volume.
Value Area, POC, Peak and Valley Based on Total Volume Always
When this Input is set to Yes then the total volume is used to calculate the Value Area, Point of Control, and Peaks and Valleys, instead of using the volume type set in the Volume Bar Calculation Method.
Otherwise, when this Input is set to No, then the volume defined in the Volume Bar Calculation Method is used to determine the Value Area, Point of Control, and Peaks and Valleys.
Bid Volume and Ask Volume Coloring Method
This Input setting allows you to color the Bid Volume and Ask Volume portion of the Volume Bars according to the selected method. The colors are specified through the Subgraphs tab of the Study Settings window for the Volume by Price study. Refer to the Color Settings section for descriptions for each of these color settings.
When the Input settings to highlight the Value Area and/or the Point of Control are enabled, then this option is ignored and Bid Volume and Ask Volume are not colored for those areas.
- None: When this option is selected, the bars are not colored using the Bid or Ask coloring. The Volume Bars Fill Color is used instead.
- Separate Bid/Ask Volume Coloring: With this coloring method, the portion of the Volume bar that represents Bid Volume is colored the Bid Volume color and the portion that represents the Ask Volume is colored the Ask Volume color.
The portion of the Volume bar that represents volume which is not considered Bid Volume or Ask Volume, will be colored the standard Volume Bars Fill color.
When there are bars in the chart which do not have Bid Volume or Ask Volume because this type of volume data is not provided by the historical data with the Data or Trading service you are using, then you will see portions of the Volume bars colored the standard Volume Bars Fill color. - Difference Of Bid And Ask Volume Coloring: With this coloring method, the difference between Ask Volume and Bid Volume is calculated and the portion of the Volume bar which represents this difference is colored the Ask Volume color if Ask Volume is greater, or the Bid Volume color if the Bid Volume is greater. The remaining portion of the bar is colored the Volume Bars Fill color (SG8).
- Dominant Bid or Ask Volume Coloring - Full Bar: With this coloring method, the entire Volume bar is colored a single color that is either the Bid Volume Color or the Ask Volume Color, depending on which volume is greater.
- Dominant Bid Or Ask Volume Coloring: With this coloring method, the portion of the Volume bar that makes up BidVolume or AskVolume is colored a single color and the color is either the BidVolume or AskVolume color, depending upon which volume is greater. The rest of the bar is colored the Volume Bars Fill color.
- Diagonal Difference of Bid and Ask Volume Coloring: With this coloring method, the Volume Bar color and length are determined from either a Bid Diagonal Difference Volume or an Ask Diagonal Difference Volume. The Diagonal Bid Volume Difference is defined as: Bid Diagonal Difference Volume = Absolute Value(Bid Volume at Given Price - Ask Volume at Next Higher Price). The Ask Diagonal Difference Volume is defined as: Ask Diagonal Difference Volume = Absolute Value(Ask Volume at Given Price - Bid Volume at Next Lower Price). The choice of Bid Diagonal Difference Volume or Ask Diagonal Difference Volume is done according to the following rules:
- If the Bid Volume is exclusively dominant, then the portion of the bar that represents the Bid Diagonal Difference Volume is colored the Bid Volume Color and the rest of the bar is colored the Volume Bars Fill Color. The Bid Side is exclusively dominant if the Bid Volume at the given price is greater than the Ask Volume at the next higher price point and the Ask Volume at the given price is less than the Bid Volume at the next lower price point.
- If the Ask Volume is exclusively dominant, then the portion of the bar that represents the Ask Diagonal Difference Volume is colored the Ask Volume Color and the rest of the bar is colored the Volume Bars Fill Color. The Ask Volume is exclusively dominant if the Ask Volume at the given price is greater than or equal to the Bid Volume at the next lower price point and the Bid Volume at the given price is less than or equal to the Ask Volume at the next higher price point.
- If neither the Bid or the Ask is exclusively dominant (both the Bid and the Ask are dominant or both the Bid and the Ask are not dominant) then the Bid Diagonal Difference is compared to the Ask Diagonal Difference with the following rules:
- If the Bid Diagonal Difference Volume (as defined above) is greater than the Ask Diagonal Difference Volume, then the portion of the bar that represents the Bid Diagonal Difference Volume is colored the Bid Volume Color and the rest of the bar is colored the Volume Bars Fill Color.
- If the Ask Diagonal Difference Volume (as defined above) is greater than or equal to the Bid Diagonal Difference Volume, then the portion of the bar that represents the Ask Diagonal Difference Volume is colored the Ask Volume Color and the rest of the bar is colored the Volume Bars Fill Color.
This color selection can only be used when the Volume Bar Calculation Method is set to Diagonal Ask Volume - Bid Volume. When the Volume Bar Calculation Method is not set to Diagonal Ask Volume - Bid Volume and the Bid Volume and Ask Volume Coloring Method is set to Diagonal Difference of Bid and Ask Volume Coloring, then when selecting OK or Apply, the Bid Volume and Ask Volume Coloring Method will change to a different selection based on the current setting for Volume Bar Calculation Method.
This setting is inferior to the Color Code Volume Bars Based on Percentage of POC input setting. Therefore, if the Color Code Volume Bars Based on Percentage of POC is set to Yes, then the bars will be colored using the color codes and not this input.
Draw Outline When Coloring Bid Volume And Ask Volume
When a Volume Bar Profile has a Bid Volume and Ask Volume Coloring Method other than None set and this option is set to Yes, the Volume Bars outlining is displayed around the portion of the bars that displays the Bid and/or Ask Volume Coloring. Otherwise, the outlining is not displayed.
Draw Difference of Bid and Ask Volume Using Percent of Max Bar
When the Bid Volume and Ask Volume Coloring Method is set to Difference of Bid And Ask Volume Coloring and the Volume Bar Calculation Method is set to Total Volume, Bid Volume, or Ask Volume then this Input can be set to Yes in which case, the length of the Difference of Bid and Ask Volume Coloring bars will be established by the setting for Difference of Bid and Ask Volume Coloring Percentage of Maximum Bar.
Otherwise, when this Input is set to No, and the Bid Volume and Ask Volume Coloring Method is set to Difference of Bid and Ask Volume Coloring, then the length of the Difference of Bid And Ask Volume Coloring bars is established by the absolute value of the difference of bid and ask volumes relative to the setting of the Volume Bar Calculation Method.
When the Bid Volume and Ask Volume Coloring Method is set to any value other than Difference of Bid And Ask Volume Coloring or the Volume Bar Calculation method is set to any value other than Total Volume, Bid Volume, or Ask Volume, then this Input cannot be changed from No.
Difference of Bid and Ask Volume Coloring Percentage of Maximum Bar
When the Input for Draw Difference of Bid and Ask Volume Using Percent of Max Bar is set to Yes, then the value entered in this Input determines the length of the Difference of Bid And Ask Volume Coloring bars.
Only whole numbers between 1 and 100 can be entered for this Input.
A value of 100 in this Input will draw the largest Difference of Bid and Ask Volume Coloring bar the same length as the shortest of the longest bars of the calculated volume profiles. For example, if a total of 5 Volume Profiles are on a chart, but only 2 are in the visible area, then the longest bar of the 2 visible profiles (as these are the only profiles calculated at that time) are compared and the shorter one is used to establish the 100% length of the largest Difference of Bid and Ask Volume in those 2 visible profiles.
Given this method of calculation, it means that if the Draw Difference of Bid and Ask Volume Using Percent of Max Bar is set to Yes, then the lengths of the Difference of Bid and Ask Volume Coloring will change as new data is added to the chart and as the chart is scrolled or expanded/contracted and different profiles are brought in and out of view. But, when the data is exactly the same on the screen, then this also means that the length of the bars will be the same as they were previously.
Use Transparent Draw Style
When this option is set to Yes, the Volume Profile bars are drawn transparent. The amount of the transparency is set with the Transparency Level setting. Using Transparency is not recommended because it elevates CPU usage can can alter the visual appearance of the Volume Profiles in detrimental ways. Use it only when absolutely necessary and set up the Volume Profiles initially without Transparency until you get the Volume Profiles displayed the way that you want, then turn on the Transparency.
Transparency Level
This sets the level of transparency as a percentage when Use Transparent Draw Style is set to Yes. This setting makes the image more transparent as the numbers go higher. So a transparency value of 80 makes the Volume Profiles more transparent than a value of 50, and a solid Volume Profile would have a value of 0.
Highlight Value Area
When this option is set to Yes, the volume bars which represent the Value Area High and Low range are colored the Value Area and Outline color.
The value area comprises the volume bars centered at the point of control and around the point of control which are the Value Area Percentage of the total volume of the entire Volume Profile.
The Value Area percentage is controlled with the Value Area Percentage setting.
To highlight only the High and Low volume bars of the Value Area, set Highlight Value Area High and Low Only to Yes.
Extend Value Area
This setting causes a line to be drawn at the Value Area High and Low that extends to the setting value.
- None: The Value Area Lines are not drawn.
- End of Period: The Value Area Lines are extended to the right until the end of the period as defined in the Volume Graph Period Type.
- End of Window: This is similar to the End of Period setting, in that the Value Area Lines are extended to the end of the period for all Volume by Price Profiles except for the last one in the chart which has the Value Area Lines drawn to the right side of the chart window.
- Until Future Intersection: Each Value Area line is individually extended until it encounters future Volume Profiles which covers a price range which intersects with the particular Value Area line being extended. If an intersection is not encountered, then the Value Area Line is extended to the right side of the chart.
- Extend to Both Window Edges: Each Value Area line is extended both to the right and to the left edge of the chart. Only the Value Area Lines that are associated with a Volume by Price Profile which has part of its period (as defined in the Volume Graph Period Types) displayed in the chart window will be viewable. This means that as a chart is scrolled in time to the left and right, the different Value Area Lines will be added or removed as periods are scrolled into and out of the viewable chart area.
When extending the Value Area, the colors of the extension lines and enabling of the Name and Value Labels is done through the Value Area and Outline Subgraph.
It is possible to enable labeling on the Value Area lines when they have been set to be extended through this Input. This is done through the subgraph tab. Refer to Extension Line Labels for more information.
Refer to the image below for an example.
Value Area Percentage
The Value Area Percentage setting specifies the percentage of the total volume of a Volume Profile that makes up the Value Area.
When the Volume by Price study is used on a chart that has the TPO Profile Chart study, then the Value Area Percentage Input will be set the same as the Volume Value Area % Input with the TPO Profile Chart study. Therefore, it is necessary to change the Value Area percentage through the corresponding TPO Profile Chart study Input.
Highlight Point of Control
When this setting is set to Yes, the volume bar which represents the Point of Control is colored the Point of Control Color.
Extend Point of Control
This setting causes a line to be drawn at Point of Control that extends to the setting value.
- None: The Point of Control Line is not drawn.
- End of Period: The Point of Control Line is extended to the right until the end of the period as defined in the Volume Graph Period Type.
- End of Window: This is similar to the End of Period setting, in that the Point of Control Line is extended to the end of the period for all Volume by Price Profiles except for the last one in the chart which has the Point of Control Line drawn to the right side of the chart window.
- Until Future Intersection: The Point of Control Line is extended until it encounters a future Volume Profile which covers the price range which intersects with the Point of Control Line. If an intersection is not encountered, then the Point of Control Line is extended to the right side of the chart.
- Extend to Both Window Edges: The Point of Control Line is extended both to the right and to the left edge of the chart. Only the Point of Control Lines that are associated with a Volume by Price Profile which has part of its period (as defined in the Volume Graph Period Types) displayed in the chart window will be viewable. This means that as a chart is scrolled in time to the left and right, the different Point of Control Lines will be added or removed as periods are scrolled into and out of the viewable chart area.
It is possible to enable labeling on the Point of Control line when it has been set to be extended through this Input. This is done through the subgraph tab. Refer to Extension Line Labels for more information.
Future Intersection Method
The future intersection methods controls, what will stop the future intersection line. The choices are Volume Profiles or Chart Bars.
When using Volume Profiles, when a future intersection line touches a Volume Profile it will stop there. When using Chart Bars, when a future intersection line touches a chart bar, it will stop there.
It is important to understand that extension lines only begin to terminate, at chart bars which are after the volume profile time period.
Extend Volume Weighted Average Price
This setting causes a line to be drawn at the Volume Weighted Average Price that extends to the setting value.
- None: The Volume Weighted Average Price Line is not drawn.
- End of Period: The Volume Weighted Average Price Line is extended to the right until the end of the period as defined in the Volume Graph Period Type.
- End of Window: This is similar to the End of Period setting, in that the Volume Weighted Average Price Line is extended to the end of the period for all Volume by Price Profiles except for the last one in the chart which has the Volume Weighted Average Price Line drawn to the right side of the chart window.
- Until Future Intersection: The Volume Weighted Average Price Line is extended until it encounters a future Volume Profile which covers the price range which intersects with the Volume Weighted Average Price Line. If an intersection is not encountered, then the Volume Weighted Average Price Line is extended to the right side of the chart.
- Extend to Both Window Edges: The Volume Weighted Average Price Line is extended both to the right and to the left edge of the chart. Only the Volume Weighted Average Price Lines that are associated with a Volume by Price Profile which has part of its period (as defined in the Volume Graph Period Types) displayed in the chart window will be viewable. This means that as a chart is scrolled in time to the left and right, the different Volume Weighted Average Price Lines will be added or removed as periods are scrolled into and out of the viewable chart area.
It is possible to enable labeling on the Volume Weighted Average Price Line when it has been set to be extended through this Input. This is done through the Volume Weighted Average Price settings on the subgraph tab. Refer to Extension Line Labels for more information.
Align Volume Numbers to Base of Volume Bars
When this setting is set to Yes and Display Volume in Bars is set to a setting other than None, then the volume numbers are aligned to the base of the volume bars. The base is on the left side of a Volume Profile unless the Volume Profiles are right aligned. By default this input is set to Yes. When this setting is changed to No, the volume numbers are then right-aligned with the end of each volume bar.
For the most accurate volume readings, you need to have tick by tick data in the Intraday chart data file. Refer to Tick by Tick Data Configuration.
This setting cannot be changed for Volume by Price Studies on the Trade DOM windows.
Volume Bars Draw Method
This setting can be set to the following:
- Filled Volume Bars: The Volume Profile is drawn as horizontal volume bars that are filled with the specified color. The Volume Bars Outline and Fill Colors Subgraph on the Subgraphs tab of the Study Settings window controls the Color and Line Width for the primary profile. The Evening Session Volume Bars Outline and Fill Colors Subgraph on the Subgraphs tab of the Study Settings window controls the Color and Line Width for the Evening Session Profile when displayed separately.
- Volume Profile Outline Only: Only a single line outline is drawn for the Volume Profile connecting the center points of each bar, rather than horizontal bars. This is useful to give a profile a very minimal appearance. The Right Align Volume Bars Input can be set to Yes to align these profiles from right to left.
The Volume Bars Outline and Fill Colors Subgraph on the Subgraphs tab of the Study Settings window controls the Color, Line Style, and Line Width for the primary profile. The Evening Session Volume Bars Outline and Fill Colors Subgraph on the Subgraphs tab of the Study Settings window controls the Color, Line Style, and Line Width for the Evening Session Profile when displayed separately.
The Use Transparent Draw Style option does not apply when using this Draw Method. - Hollow Volume Bars: The Volume Profile is drawn as horizontal volume bars that are not filled and are hollow. The Volume Bars Outline and Fills Colors Subgraph on the Subgraphs tab of the Study Settings window controls the Color and Line Width for the primary profile. The Evening Session Volume Bars Outline and Fill Colors Subgraph on the Subgraphs tab of the Study Settings window controls the Color and Line Width for the Evening Session Profile when displayed separately.
The Use Transparent Draw Style option does not apply when using this Draw Method. - Hologram: The Volume Profile is drawn as a rectangular style outline. The Volume Bars Outline and Fills Colors Subgraph on the Subgraphs tab of the Study Settings window controls the Color and Line Width for the primary profile. The Evening Session Volume Bars Outline and Fill Colors Subgraph on the Subgraphs tab of the Study Settings window controls the Color and Line Width for the Evening Session Profile when displayed separately.
The Use Transparent Draw Style option does not apply when using this Draw Method. - Blank: With this Draw Method, the Volume Profiles will not be drawn. However, extension lines, if enabled, will still be drawn.
Allow Side-By-Side Profiles on Right Side
When this option is set to Yes, multiple instances of the Volume by Price study which are set to be displayed on the far right side of the chart, will be displayed side by side and not overlap each other.
The order of these Volume by Price study instances in the Studies to Graph list controls the order in which they are drawn on the right side. The first one will be drawn on the rightmost side, the second one will be drawn to the left of the first one, and so on. For more information refer to the Study Display Order documentation.
Follow these instructions to display multiple instances of the Volume by Price study on the right side of the chart.
- Add all of the Volume by Price study instances to the chart and configure them as you require.
- Each instance of the Volume by Price study needs to have the Volume Graph Period Type input set to either:
- A single period.
- Multiple periods with the Always Display Last Profile Within View input set to Yes. Note that if multiple profiles are used, the Volume by Price profiles on the right side will still overlap the profiles from earlier periods when scrolling the chart back through the timeframe.
- Each instance of the Volume by Price study needs to have Right Align Volume Bars input set to Yes.
- Each instance of the Volume by Price study needs to have Allow Side By Side Profiles on Right Side input set to Yes.
- Each instance of the Volume by Price study needs to have Align to Far Right input set to Yes.
Use Defined Width for Side-By-Side Profiles on Right
When a profile is right-aligned and has the Input for Allow Side-By-Side Profiles on Right Side set to Yes, then when this Input is also set to Yes, then the profile will retain the width as defined by the Inputs for Maximum Volume Bar Width Type and Maximum Volume Bar Width Percentage.
This means that if there are additional profiles to the left of this profile, then as the profile bars are moved up or down out of the visible area, the profile to the left will stay in the same position and will not adjust to the visible bars of this profile.
Draw Profile Outline Enclosing Bars
When this option is set to Yes, then a rectangular outline will be drawn around all of the chart bars that the Volume Profile consists of.
Draw Peaks and Valleys
This option will draw a line extending from a profile bar that is found to be either a Peak or a Valley.
A peak or valley is defined when a given volume bar has bars above that are either less than it (Peak) or greater than it (Valley), in volume. And volume bars below that are either less than or equal to it (Peak) or greater than or equal it (Valley), in volume.
The choices are None, Both Peaks and Valleys, Peaks Only, or Valleys Only.
The following additional Inputs affect how the Peaks and Valleys are determined and drawn. Refer to the individual documentation for each item for more information.
- Peaks and Valleys Sensitivity: This controls the number of bars above and below that are searched to determine a peak or valley.
- Include High/Low in Peaks and Valleys: This controls whether the highest and lowest bars within the Volume Profile are included in the calculation.
- Extend Peaks and Valleys: This controls how the Peaks and Valleys Lines are extended.
Note that the Peaks and Valleys are always determined from the Total Volume at each price level. Therefore, changes to the Volume Bar Calculation Method will not affect the calculation of the Peaks and Valleys.
Peaks and Valleys Sensitivity
The Peaks and Valleys Sensitivity refers to the number of horizontal volume bars that are searched above and below each Volume bar to determine whether a particular volume bar is a Peak or a Valley.
For example, if this is set to 10 and the Ticks Per Volume Bar Input is set to 1, then 10 ticks above and below each price level there is Volume for is searched.
In the case when the sensitivity is set to 10, if the 10 price levels above a particular price level have a lower volume than the volume bar the price level being compared to, and 10 price levels below a particular price level have a lower or equal volume than the volume bar at the price level being compared to, then this will be considered a Peak Volume bar and a horizontal line is drawn outward from the Peak.
In the case when the sensitivity is set to 10, if the 10 price levels above a particular price level have a higher volume than the volume bar the price level being compared to, and 10 price levels below a particular price level have a higher or equal volume than the volume bar at the price level being compared to, then this will be considered a Valley Volume bar and a horizontal line is drawn outward from the Valley.
The Color, Line Style, and Line Width are controlled with the Peaks and Valleys Subgraph on the Subgraphs Tab.
Include High/Low in Peaks and Valleys
When this option is set to Yes, the highest and lowest Volume bars within a Volume Profile are included in the calculations to determine Peak and Valley Volume bars. When this is set to No, the highest and lowest Volume bars are not included in the calculations.
Align to Far Right
When this Input is set to Yes the Volume Profile will be aligned to the far right side of the chart. In the case of Trade DOM windows, the profile will always be aligned to the far right if it is right aligned.
This Input setting only applies when the Volume Graph Period Type is set to a value that consists of a single Volume Profile Only.
To align the last Volume Profile to the far right when the Volume Graph Period Type is set to a value that consists of multiple Volume Profiles, the Always Display Last Profile Within View should be set to Yes.
Do Not Overlap DOM Graph
When this Input is set to Yes, Align to Far Right is set to Yes, and the Trade >> Draw DOM Graph On Chart is enabled, then the Volume Profile displayed on the right side of the chart will be adjusted to not overlap the DOM Graph.
Extend Peaks and Valleys
This option controls various methods of extension lines for the Peak and Valley volume bars.
- End of Period: The Peaks and Valleys Lines are extended to the right until the end of the period as defined in the Volume Graph Period Type.
- End of Window: This is similar to the End of Period setting, in that the Peaks and Valleys Lines are extended to the end of the period for all Volume by Price Profiles except for the last one in the chart which has the Peaks and Valleys Lines drawn to the right side of the chart window.
- Until Future Intersection: Each Peaks and Valleys Line is individually extended until it encounters future Volume Profiles which covers a price range which intersects with the particular Peaks and Valleys line being extended. If an intersection is not encountered, then the Peaks and Valleys Line is extended to the right side of the chart.
The intersection is never, within the time period of the Volume Profile the extension line originates from. Only future profiles. The forward extending, is always towards future time to the right. - Extend to Both Window Edges: Each Peaks and Valleys line is extended both to the right and to the left edge of the chart. Only the Peaks and Valleys Lines that are associated with a Volume by Price Profile which has part of its period (as defined in the Volume Graph Period Types) displayed in the chart window will be viewable. This means that as a chart is scrolled in time to the left and right, the different Peaks and Valleys Lines will be added or removed as periods are scrolled into and out of the viewable chart area.
It is possible to enable labeling on the Peaks and Valleys Lines when they have been set to be extended through this Input. This is done through the Volume Peaks and Volume Valleys settings on the subgraph tab. Refer to Extension Line Labels for more information.
Highlight Value Area High and Low Only
When this Input is set to Yes and the Highlight Value Area Input is set to Yes, then only the Value Area High and Low horizontal volume bars will be highlighted the Value Area Color set with the Value Area and Outline colors.
Otherwise, all horizontal volume bars within the Value Area will be highlighted the Value Area color when the Highlight Value Area Input is set to Yes.
Calculate Developing POC and Value Area
When this Input setting is set to Yes, then the Point of Control, Value Area High Value, Value Area Low Value study graphs will contain the developing Point of Control and Value Area values.
What this means is that at every bar in the chart, they will contain the values calculated up to the moment in time the bar is for instead of equivalent to the values for the entire Volume Profile they are for.
To actually see these lines on the chart set the Draw Mode Input to one of the options that contains POC, VAH, VAL Lines.
The data in these Studies can also be programmatically accessed by ACSIL. Refer to the Using Study/Indicator Data in an ACSIL Function.
Color Code Volume Bars Based on Percentage of POC
When this Input setting is set to Yes, each horizontal Volume Bar in a Volume Profile is colored based upon the its percentage relative to the Point of Control.
There are 10 color settings named #%-#% POC Color in the list of Inputs following this Input setting which control the colors based on the percentage that the Volume Bar relative to the Point of Control volume.
This setting takes precedence over the Bid Volume and Ask Volume Coloring Method. Therefore, if this option is seet to Yes, then the Volume Bars will use this Color Coding.
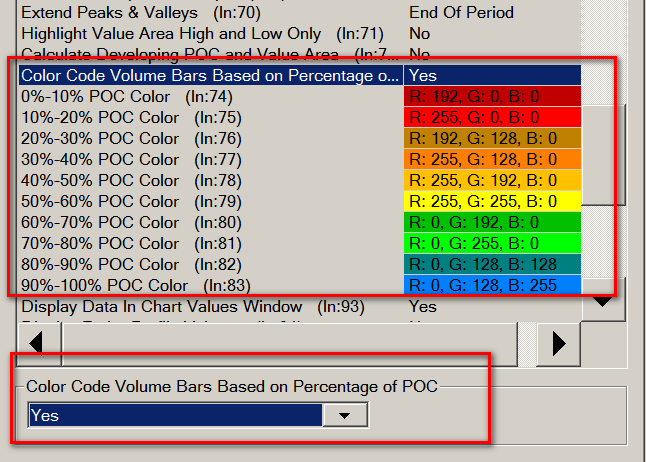
Number of POC Ranges to Color
The default for this Input is 10. This means that all 10 #%-#% POC Color Input settings are used to color all of the Volume bars. If this is set to 1, then only the 90% - 100% POC Color is used. The remaining volume bars that do not meet this condition use coloring based upon the other Input and Subgraph settings like the Bid Volume and Ask Volume Coloring Method Input.
The higher the number for the Number of POC Ranges to Color Input, the more #%-#% POC Color Input Settings which are used.
#%-#% POC Color
These color settings are used when the Color Code Volume Bars Based on Percentage of POC Input is set to Yes. Each color covers a 10% range.
For details, refer to Color Code Volume Bars Based on Percentage of POC.
Display Data in Chart Values Window
When this Input is set to Yes, then various values will be displayed in the Tool Values Window for the Volume Profile being pointed to with the Chart Values Tool, and various values will be displayed in the Chart Values Window for the last displayed Volume Profile.
The Tool Values Window is accessed by selecting Window >> Tool Values Window.
The Chart Values Window is accessed by selecting Window >> Chart Values Window.
Show Chart Values On Profile
This setting controls the text data that is displayed above or below the Volume Profiles and text labels displayed before each value to denote what each value represents.
Do Not Show Chart Values On Profile
When this option is selected, no text data is displayed
Show Chart Values On Profile With Labels In SingleRow
When this option is selected, all the chart values selected from Chart Value 1-4 to be Displayed on Profile are displayed in a single row separated by '|'.
The values are prefaced with abbreviated labels of the chart value name.
Show Chart Values On Profile With Labels
When this option is selected, all the chart values selected from Chart Value 1-4 to be Displayed on Profile are displayed in separate lines.
The values are prefaced with abbreviated labels of the chart value name.
Show Chart Values On Profile Without Labels In Single Row
When this option is selected, all the chart values selected from Chart Value 1-4 to be Displayed on Profile are displayed in a single row separated by '|'.
The values are not prefaced with labels.
Show Chart Values On Profile Without Labels
When this option is selected, all the chart values selected from Chart Value 1-4 to be Displayed on Profile are displayed in separate lines.
The values are not prefaced with labels.
Chart Values Position on Profile
This setting controls the position of the text data that is displayed in the Volume Profiles.
Top of the Graph
When this option is selected, all the chart values selected from Chart Value 1-4 to be Displayed on Profile are displayed above the Volume Profiles.
Bottom of the Graph
When this option is selected, all the chart values selected from Chart Value 1-4 to be Displayed on Profile are displayed below the Volume Profiles.
Bottom of the Window
When this option is selected, all the chart values selected from Chart Value 1-4 to be Displayed on Profile are displayed at the bottom of the chart window and is always visible.
Text Font Size
This Input setting is used to set the font size for text values that are displayed when the Show Chart Values On Profile Input is set to a value other than Do Not Show Chart Values on Profile and there are selected values in at least one of the Chart Value to be Displayed on Profile Inputs.
Chart Value# (1-4) To Be Displayed On Profile
These four Input settings are used to select the chart values to be displayed on the profile in the chart.
Use the Show Chart Values On Profile and Chart Values Position On Profile Inputs to select the format and position of the chart value. Up to four separate chart values can be displayed on each profile.
The chart values can also be viewed in the Chart Values Windows.
For complete descriptions of the available values and what they mean, refer to Viewing Volume Profile Text Information.
Calculate Mean Price and Standard Deviation Bands
When this input is set to Yes, the Trade Weighted Mean Price, Mean Price + Std Dev, Mean Price - Std Dev, Mean Price + 2 * Std Dev, and Mean Price - 2 * Std Dev are calculated and displayed in the Chart Values and Tool Values windows.
The colors of this information that is displayed in the Chart Values and Tool Values windows is controlled through the subgraph setting for each item. Refer to Color and Width Settings for more information.
Refer to Chart Values Window for more information on the Chart Values Window.
These can also be displayed on the chart as lines by setting the Draw Styles for these Subgraphs as required and by setting Draw Mode Input to Volume Profiles & POC, VAH, VAL Lines.
Volume Bar Minimum Width in Chart Bars
When this Input setting is set to a non-zero value, the minimum width of each horizontal Volume Bar is set to the specified number of chart bars, allowing very narrow bars to be more visible.
Include Fill Space in Developing Period Width
When this Input setting is set to Yes, the chart right side fill space is included into the Volume Profile period width of a developing period, allowing more space for a developing period to be displayed.
Use Large Number Display Formatting
When this input is set to Yes any number larger than 10,000 is changed to display as the thousands value, notated with a k. For example, the value 12,434 would be displayed as 12.4k.
Volume values under 10,000 remain the same.
Minimum Time Period % for Reference Days Back
This input sets the percentage of a time period that is required for the Number Of Periods Back To Reference to use that period as a valid period. For example, if this input is set to 25% and the time period referenced back is 1 day, then a previous period only needs to contain 6 hours of data to be considered a valid period and included in the calculation.
Volume Profile Bars Length Relative to All Visible Profiles
When this Input is set to Yes, then the width of the volume profile bars is relative to all of the visible Volume Profiles rather than the individual Volume Profile the horizontal volume bar is part of.
This allows you to visually make comparisons as to the amount of volume in a volume bar when looking at all of the profiles.
The Volume by Price study and Numbers Bars study each use independent scaling for their volume bars. In regards to Volume Profile Bars Length Relative to All Visible Profiles each instance of a study always uses independent scaling for this feature. Therefore, what this means is that with a different instance of the Volume by Price study, a volume bar could have a wider width at a price level even if its volume is lower compared to a volume bar from a different instance of the Volume by Price study.
Number of Custom Intraday Sessions
This Input is used to set the number of custom sessions per day for the Volume By Price profile. The maximum custom sessions allowed is 5. The inputs Custom Intraday Session# (1-5) Begin Time and Custom Intraday Session# (1-5) End Time should also be set according to the number set here.
Note that this input is valid only when the Time Period Type for 'Fixed Time' input is set to Days and the Time Period Length for 'Fixed Time' input is set to 1.
Custom Intraday Session# (1-5) Begin Time
This Input sets the begin time for the custom intraday sessions. This Input only applies when Number of Custom Intraday Sessions is set to a value greater than 0.
For example, if the Number of Custom Intraday Sessions is set to 3, there will be 3 intraday sessions for 1 Day and Custom Intraday Session# (1-3) Begin Time will be used as the begin time for the 3 sessions.
If there is an overlap between the Custom Intraday Session# (1-5) End Time of one session and the Custom Intraday Session# (1-5) Begin Time of next session, then the end time of that session will be changed to remove the overlap.
Custom Intraday Session# (1-5) End Time
This Input sets the end time for the custom intraday sessions. This Input only applies when Number of Custom Intraday Sessions is set to a value greater than 0.
For example, if the Number of Custom Intraday Sessions is set to 3, there will be 3 intraday sessions for 1 Day and Custom Intraday Session# (1-3) End Time will be used as the end time for the 3 sessions.
If there is an overlap between the Custom Intraday Session# (1-5) End Time of one session and the Custom Intraday Session# (1-5) Begin Time of next session, then the end time of that session will be changed to remove the overlap.
Examples of Input Settings for Different Volume Profiles
The following sections below list the required Input Settings and the values to set them to, to create Volume Profiles of the specified time periods.
The procedure is to first follow the Step By Step Instructions to add the Volume by Price study to the chart and then modify the Input settings of that Volume by Price study instance to what is described below.
1 Day Volume Profiles Across Entire Chart
1 Week Volume Profiles Across Entire Chart
- Number Of Periods Back To Reference: 0.
- Volume Graph Period Type: Multiple Profiles Based on Fixed Time.
- Time Period Type for 'Fixed Time': Weeks.
- Time Period Length for 'Fixed Time': 1.
- Number of Days to Calculate: 0.
- Set the Chart Session Times as required.
- Set Use Monday as Start of Week instead of Sunday in General Settings as required.
1 Day Volume Profiles Across Entire Chart Based on Session Times Different than Chart
- Number Of Periods Back To Reference: 0.
- Volume Graph Period Type: Multiple Profiles from Start Time to End Time.
- Time Period Type for 'Fixed Time': Days.
- Time Period Length for 'Fixed Time': 1.
- Start Time: Start time for volume profiles.
- End Time: Start time for volume profiles.
1 Day Volume Profile At End of Chart
1 Day Volume Profiles Showing Prior Day
- Number Of Periods Back To Reference: 1.
- Volume Graph Period Type: Multiple Profiles Based on Fixed Time.
- Time Period Type for 'Fixed Time': Days.
- Time Period Length for 'Fixed Time': 1.
- Number of Days To Calculate Volume Profiles: 1.
- Minimum Time Period % for Reference Days Back: 50.
- Set the Chart Session Times as required.
Note that these settings assume that the prior day has at least 50% of the data for the day. If the prior day does not have data for at least 50% of the time, then the calculation will go back to the next day and check if it has enough data, and so on until a day is found that has the necessary amount of data.
Current Month Volume Profile at End of Chart
1 Hour Volume Profile At End of Chart
- Number Of Periods Back To Reference: 0.
- Volume Graph Period Type: One Period at End of Fixed Time Length.
- Time Period Type for 'Fixed Time': Minutes.
- Time Period Length for 'Fixed Time': 60.
- Refer to the Right Aligning Profiles with Space on Right Side instructions to right align the Volume Profile on the right side of the chart.
30 Minute Volume Profile at End of TPO Profile Chart
The following settings assume the chart has a TPO Profile Chart study on it.
These settings are also applicable to time periods other than 30 minutes as well by changing the Time Period Type/Length Inputs appropriately.
- Ticks Per Volume Bar: 1.
- Volume Graph Period Type: One Period From Most Recent Period Start To End or One Period at End of Fixed Time Length.
- Set As Independent Volume Profile for TPO Chart: Yes.
- Time Period Type for 'Fixed Time': Minutes. Or use Days if you want a Volume Profile based on days.
- Time Period Length for 'Fixed Time': 30. Or set this to 1 if you want a 1 Day Volume Profile.
- Maximum Volume Bar Width Type: Window Width.
- Maximum Volume Bar Width Percentage: 15.
- Right Aligned Volume Bars: Yes.
- Align to Far Right: Yes.
Most likely you will also want to add space to the right side of the chart so that the Volume Profile does not overlap last TPO Profile. For instructions, refer to Right Side Fill Space.
One Volume Profile at End for Day Session
- Ticks Per Volume Bar: 1.
- Volume Graph Period Type: One Period from Start Time to End Time.
- Start Time: 09:30:00.
- End Time: 17:59:59.
- Maximum Volume Bar Width Type: Window Width.
- Maximum Volume Bar Width Type: Window Width.
- Maximum Volume Bar Width Percentage: 10.
- Right Align Volume Bars: Yes.
- Allow Side-By-Side Profiles on Right: Yes.
- Align to Far Right: Yes.
- Bid Volume and Ask Volume Coloring Method: None.
Set the Start Time and End Time Inputs to appropriate values for the specific Day trading session.
If this Day Session Volume by Price study is going to be used in conjunction with an Evening Session Volume by Price study, then select the Subgraphs tab on the Study Settings window for the Volume by Price study and select the Volume Bars Outline and Fill Colors Subgraph and change the colors as desired to differentiate these volume bars from the Evening Session volume bars.
In order to not overlap the display of the Volume by Price profile with the chart bars, add space to the right side of the chart so that there is room for the Volume Profile. After this, select the option Chart >> Lock Fill Space. For instructions, refer to Right Side Fill Space.
One Volume Profile at End for Evening Session
- Ticks Per Volume Bar: 1.
- Volume Graph Period Type: One Period from Start Time to End Time.
- Start Time: 18:00:00.
- End Time: 09:29:59.
- Maximum Volume Bar Width Type: Window Width.
- Maximum Volume Bar Width Percentage: 10.
- Right Align Volume Bars: Yes.
- Allow Side-By-Side Profiles on Right: Yes.
- Align to Far Right: Yes.
- Bid Volume and Ask Volume Coloring Method: None.
Set the Start Time and End Time to appropriate values for the specific Evening trading session.
If this Evening Session Volume by Price study is going to be used in conjunction with a Day Session Volume by Price study, then select the Subgraphs tab on the Study Settings window for the Volume by Price study and select the Volume Bars Outline and Fill Colors Subgraph and change the colors as desired to differentiate these volume bars from the Day Session volume bars.
In order to not overlap the display of the Volume by Price profile with the chart bars, add space to the right side of the chart so that there is room for the Volume Profile. After this, select the option Chart >> Lock Fill Space. For instructions, refer to Right Side Fill Space.
One Volume Profile at End Covering 3/Three Days
The following settings will display a Volume by Price profile on the right side of the screen taking up 20% of the total window space, covering the current day along with the previous 2 days for a total of 3 days.
- Ticks Per Volume Bar: 1.
- Volume Graph Period Type: One Period at End of Fixed Time Length - Auto-Skip Empty Days.
- Time Period Type for 'Fixed Time': Days.
- Time Period Length for 'Fixed Time': 3. Can be any other number of days as well.
- Right Align Volume Bars: Yes.
- Align to Far Right: Yes.
- Maximum Volume Bar Width Type: Window Width.
- Maximum Volume Bar Width Percentage: 20.
- Allow Side By Side Profiles on Right Side: Yes.
One Volume Profile at End Covering 20 Days Using 1 Day Per Bar Chart
The following settings will display a Volume by Price profile on the right side of the screen taking up 20% of the total window space, covering the last 20 days in the chart. The chart bars are set to one day per bar.
- Chart Setting: Bar Period Type: Days-Minutes-Seconds-Milliseconds Per Bar.
- Chart Setting: Bar Period Value: 1-0-0.
- Intraday Chart Session Times: Set as required.
- Ticks Per Volume Bar: 1.
- Volume Graph Period Type: One Period Based on Bar Count.
- Number of Bars for 'Based On Bar Count': 20.
- Right Align Volume Bars: Yes.
- Align to Far Right: Yes.
- Maximum Volume Bar Width Type: Window Width.
- Maximum Volume Bar Width Percentage: 20.
- Allow Side By Side Profiles on Right Side: Yes.
One Volume Profile per Chart Bar
The following settings will display one Volume by Price profile for each bar in the chart.
Since this configuration will take a longer than usual time to calculate it is recommended to reduce the Days to Load setting in Chart >> Chart Settings to 2 days.
- Ticks Per Volume Bar: 1.
- Volume Graph Period Type: Multiple Profiles Based on Bar Count.
- Number of Bars for 'Based on Bar Count': 1.
- Maximum Volume Bar Width Type: Period Length.
- Maximum Volume Bar Width Percentage: 80.
One Volume Profile for Multiple Bars
The following settings will display one Volume by Price profile for the data in the most recent 9 bars in the chart, and will highlight the Point of Control for the profile.
- Volume Graph Period Type: Multiple Profiles Based on Bar Count.
- Number of Bars for 'Based on Bar Count': 9.
- Highlight Point of Control: Yes.
Outline Only with Volume
The following Input settings need to be set as shown to display volume bars which are not filled in and show the volume at each price level. These Input settings can be used with any other Volume by Price configuration.
- Display Volume in Bars: Total Volume.
- Volume Bars Draw Method: Volume Profile Outline Only.
20 Day Point of Control at End of Chart Based on 24 Hour Session
The following Volume by Price Input settings and Chart Settings need to be set as shown to display a single volume profile at the end of the chart based on 20 days, full trading session, which shows the point of control value.
- Draw Mode: Volume Profiles & POC, VAH, VAL, VWAP Lines.
- Ticks Per Volume Bar: 1.
- Volume Graph Period Type: One Period at End of Fixed Time Length.
- Time Period Type for 'Fixed Time': Days.
- Time Period Length for 'Fixed Time': 20.
- Right Align Volume Bars: Yes.
- Align to Far Right: Yes.
- Maximum Volume Bar Width Type: Window Width.
- Maximum Volume Bar Width Percentage: 20.
- Calculate Developing POC and Value Area: Yes.
- Chart >> Chart Settings >> Session Times >> Use Evening Session: Yes.
1 Day Total Volume with Bid Ask Delta on Right
The following Volume by Price Input Settings will display a Total Volume profile with blue bars (by default) with the Bid/Ask Difference (Delta) displayed above the total volume. The profile is right-aligned to the right side of the graphics area
- Volume Graph Period Type: One Period at End of Fixed Time Length.
- Time Period Type for 'Fixed Time': Days.
- Time Period Length for 'Fixed Time': 1.
- Right Align Volume Bars: Yes.
- Align to Far Right: Yes.
- Maximum Volume Bar Width Type: Window Width.
- Maximum Volume Bar Width Percentage: 50 (set this as desired).
- Volume Bar Calculation Method: Total Volume.
- Bid Volume and Ask Volume Coloring Method: Difference of Bid Ask Volume Coloring.
The following Inputs allow for the Difference of Bid Ask Volume Coloring to be extended out, since these bars can be small and not easily discernible in relation to the Total Volume. Set Draw Difference of Bid and Ask Volume Using Percent of Max Bar to Yes in order to define the percentage of the maximum bar to use. The specific percentage to use is a personal choice.
- Draw Difference of Bid and Ask Volume Using Percent of Max Bar: Yes
- Difference of Bid and Ask Volume Coloring Percentage of Maximum Bar: 100 (set this as desired).
Controlling the Study Display Order Relative to the Price Graph Bars and Other Studies
Beginning with Sierra Chart version 1435, there is no longer the Display Above Price Bars Input setting.
On the Settings and Inputs tab of the Volume by Price settings window is the option for Display Study Underneath Main Price Graph. This setting controls whether the Volume by Price study is drawn beneath the main price graph bars or not. The order of the studies in the Studies to Graph area of the Chart Studies window, controls the order in which the studies are drawn.
Refer to Study Display Order for more information.
You may also want to set Use Transparent Draw Style to Yes to allow the price bars and other graphs which are displayed under the Volume Profiles, to be partially visible.
Color and Width Settings
The Subgraphs tab in the Study Settings window for the Volume by Price study lists several Subgraphs which are used for color and some width settings for the various elements of the Volume Profiles displayed by the Volume by Price study.
- Select Analysis >> Studies on the menu.
- Select the Volume by Price study in the Studies to Graph list.
- Press the Settings button.
- Select the Subgraphs tab of the Study Settings window.
- Refer to the descriptions below.
Point of Control (SG2)
When you have set the Highlight Point of Control Input setting to Yes, then this Subgraph Color setting controls the color of the volume bar which is at the Point of Control. All other Subgraphs settings are not relevant for this particular Subgraph in this case.
When you have set the Extend Point of Control Input setting to other than None, or Draw Mode is set to include the VAH, VAL, POC, and VWAP Lines, then this Subgraph is used to control the Color, Line Style, and Width of the Point of Control line in this case.
The Name Label and Value Label Subgraph settings also apply in this case described above.
Value Area High Value (SG3)
This Subgraph contains the Value Area High data for each Volume Profile for each bar in the chart. This Subgraph is only visible on the chart and the Color, Line Style and Width settings only apply when the Draw ModeInput is set to include the VAH, VAL, POC Lines.
Otherwise, it has no effect and would only be used for ACSIL to access the data and to have the Value Area High and Low values displayed in the Chart Values windows.
When extending the Value Area through the Extend Value Area Input, the colors of the extension lines and enabling of the Name and Value Labels is done through the Value Area and Outline Subgraph instead.
When Draw Mode is set to include the VAH, VAL, POC, and VWAP Lines, then the Name Label and Value Label Subgraph settings also apply in this case.
Value Area Low Value (SG4)
This Subgraph contains the Value Area Low data for each Volume Profile for each bar in the chart. This Subgraph is only visible on the chart and the Color, Line Style and Width settings only apply when the Draw Mode Input is set to include the VAH, VAL, POC, and VWAP Lines.
Otherwise, it has no effect and would only be used for ACSIL to access the data and to have the Value Area High and Low values displayed in the Chart Values windows.
When extending the Value Area through the Extend Value Area Input, the colors of the extension lines and enabling of the Name and Value Labels is done through the Value Area and Outline Subgraph instead.
When Draw Mode is set to include the VAH, VAL, POC, and VWAP Lines, then the Name Label and Value Label Subgraph settings also apply in this case.
Volume Weighted Average Price (SG5)
This Subgraph contains the Volume Weighted Average Price for each Volume Profile for each bar in the chart. This Subgraph is only visible on the chart and the Color, Line Style and Width settings only apply when the Draw Mode input is set to include the VAH, VAL, POC, and VWAP Lines or if the option Extend Volume Weighted Average Price is set to any setting other than None. Otherwise, it has no effect and is only used for ACSIL to access the data and to have values displayed in the Chart Values window.
The Color controls the color of the line, the Line Style controls the line style of the line, and the Width setting controls the width of the line. The Name Label and Value Label can also be used to display the Name and Value on the chart.
All other Subgraphs settings are not used for this particular subgraph.
Bid Volume and Ask Volume Colors (SG6)
This Subgraph is for setting the Bid Volume and Ask Volume colors for the AskVolume and BidVolume portion of a bar within a Volume Profile.
The primary Color button sets the BidVolume color. The Secondary Color button sets the AskVolume color.
If the Draw Style setting is set to Ignore then this subgraph is not relevant. All other Subgraph settings are not relevant for this particular subgraph.
Volume Numbers Text Color and Size (SG7)
This Subgraph controls the Colors and Font Size of the volume numbers text displayed in the Volume Profile bars, if you have set the Display Volume in Bars Input setting to a setting other than None.
This Subgraph also controls the Colors of the text displayed outside of the volume bars if you have set the Show Chart Values on Profile Input to a value other than Do Not Show Chart Values on Profile and have selected values to be displayed in the Chart Value n to be Displayed on Profile Inputs. To change the font size for the Chart Values on the profile, use the Text Font Size Input.
The Primary color setting controls the text color when the volume text is positive. The Secondary color setting controls the color when the volume text is negative.
When displaying values that show more than one number, only the Primary color is used to color the text. This includes the volume display options for Ask Volume - Bid Volume, Total Volume, Diagonal Ask Vol Bid Vol Difference, and Diagonal Ask Volume - Bid Volume.
The Size setting sets the Font Size for volume values displayed in the bars. If it is set between 0 and 4, then the font size is automatic and will change as the bar size changes.
To manually set this, requires the use of value of 5 or higher. The size is a standard font point size. A recommended value would be 14 or higher. When set to a value of 5 or greater, the font will always stay the same size as the bar size changes.
If you notice that the volume text numbers are overlapping, then use the Interactive Scale Range feature to reduce the range of displayed prices, so there is greater separation between the volume numbers.
All other Subgraphs settings are not used for this particular Subgraph.
Volume Bars Outline and Fill Colors (SG8)
This Subgraph controls the outline size and color and the fill color of the Volume Profile bars for the primary trading session. The primary color button controls the color of the outline surrounding each profile bar when it is displayed. The secondary color button controls the color of the standard fill color of each profile bar - this is the color that is used when the Bid or Ask Color is not being displayed. The Width/Size setting controls the size of the outline line.
When you have set the Volume Bars Draw Method Input to Volume Profile Outline Only, Hollow Volume Bars, or Hologram then the first color control controls the color of the outline, and the Width setting controls the width of the outline line. Additionally, the Line Style controls the line style of the outline when the Volume Profile Outline Only is selected.
All other Subgraph settings are not relevant for this particular Subgraph.
Value Area and Outline (SG9)
When you have set the Highlight Value Area Input setting to Yes, then this Subgraph Color setting controls the color of the Volume bars which are within the Value Area. The primary color button sets the interior of the Volume Profile bars and the secondary color button sets the outline color. All other Subgraphs settings are not relevant for this particular Subgraph in this case.
When you have set the Extend Value Area Input setting to other than None, then this Subgraph is used to control the Color, Line Style, and Width of the Value Area lines in this case. The color of the Value Area lines is the primary color setting. The Name Label and Value Label Subgraph settings also apply in this case.
Evening Session Volume Bars Outline and Fill Colors (SG11)
This Subgraph controls the outline size and color and the fill color for the Evening Session Volume Profile bars when Use Separate Profile for Evening Session is set to Yes. The primary color button controls the color of the outline surrounding each profile bar when it is displayed. The secondary color button controls the color of the standard fill color of each profile bar - this is the color that is used when the Bid or Ask color is not being displayed. The Width/Size setting controls the size of the outline line.
When you have set the Volume Bars Draw Method Input to Volume Profile Outline Only, the the first color control controls the color of the outline, the Line Style controls the line style of the outline, and the Width setting controls the width of the outline line.
All other Subgraph settings are not relevant for this particular Subgraph.
Trade Weighted Mean Price (SG12)
This Subgraph controls the color of the Trade Weighted Mean Price text displayed in the Chart Values and Tool Values windows when the input option Calculate Mean Price and Standard Deviation Bands is set to Yes.
Select the Color Button to change the color of the text. All other Subgraph settings are not used.
Mean Price + Std Dev (SG13)
This Subgraph controls the color of the Mean Price + Std Dev text displayed in the Chart Values and Tool Values windows when the input option Calculate Mean Price and Standard Deviation Bands is set to Yes.
Select the Color Button to change the color of the text. All other Subgraph settings are not used.
Mean Price - Std Dev (SG14)
This Subgraph controls the color of the Mean Price - Std Dev text displayed in the Chart Values and Tool Values windows when the input option Calculate Mean Price and Standard Deviation Bands is set to Yes.
Select the Color Button to change the color of the text. All other Subgraph settings are not used.
Mean Price + 2 * Std Dev (SG15)
This Subgraph controls the color of the Mean Price + 2 * Std Dev text displayed in the Chart Values and Tool Values windows when the input option Calculate Mean Price and Standard Deviation Bands is set to Yes.
Select the Color Button to change the color of the text. All other Subgraph settings are not used.
Mean Price - 2 * Std Dev (SG16)
This Subgraph controls the color of the Mean Price - 2 * Std Dev text displayed in the Chart Values and Tool Values windows when the input option Calculate Mean Price and Standard Deviation Bands is set to Yes.
Select the Color Button to change the color of the text. All other Subgraph settings are not used.
Volume Profile Enclosing Outline (SG17)
This Subgraph controls the color and line parameters for the Enclosing Outline when the Draw Profile Outline Enclosing Bars is set to Yes.
The primary color button controls the line color, the Line Style controls the line style and the Width controls the width of the Enclosing Outline. The secondary color button and other parameters for this Subgraph are not used.
If the Width is set to a value other than 1, then the Enclosing Line is changed to a Solid line and changes to the Line Style option are ignored.
Volume Peaks (SG18)
This Subgraph controls the color and line parameters for the Volume Peaks Lines when the Draw Peaks and Valleys option is set to either Both Peaks and Valleys or Peaks Only.
The color button controls the color, the Line Style controls the style and the Width controls the width of the Peaks Lines.
The Value Label also be enabled to display the Peaks values on the chart. The other parameters for this Subgraph are not used.
Volume Valleys (SG19)
This Subgraph controls the color and line parameters for the Volume Valleys Lines when the Draw Peaks and Valleys option is set to either Both Peaks and Valleys or Valleys Only.
The color button controls the color, the Line Style controls the style and the Width controls the width of the Valleys Lines.
The Value Label also be enabled to display the Valleys values on the chart. The other parameters for this Subgraph are not used.
Value Area BidVolume and AskVolume Colors (SG20)
This subgraph controls the color of the Value Area for the Bid Volume and Ask Volume bars when the Bid Volume and Ask Volume Coloring Method is set to a value other than None.
The primary color is used to color Bid Volume bars and the secondary color is used to color the Ask Volume bars.
Only the colors of this subgraph can be changed.
PointOfControl BidVolume and AskVolume Colors (SG21)
This subgraph controls the color of the Poiunt of Control for the Bid Volume and Ask Volume bars when the Bid Volume and Ask Volume Coloring Method is set to a value other than None.
The primary color is used to color Bid Volume bars and the secondary color is used to color the Ask Volume bars.
Only the colors of this subgraph can be changed.
Extension Line Labels
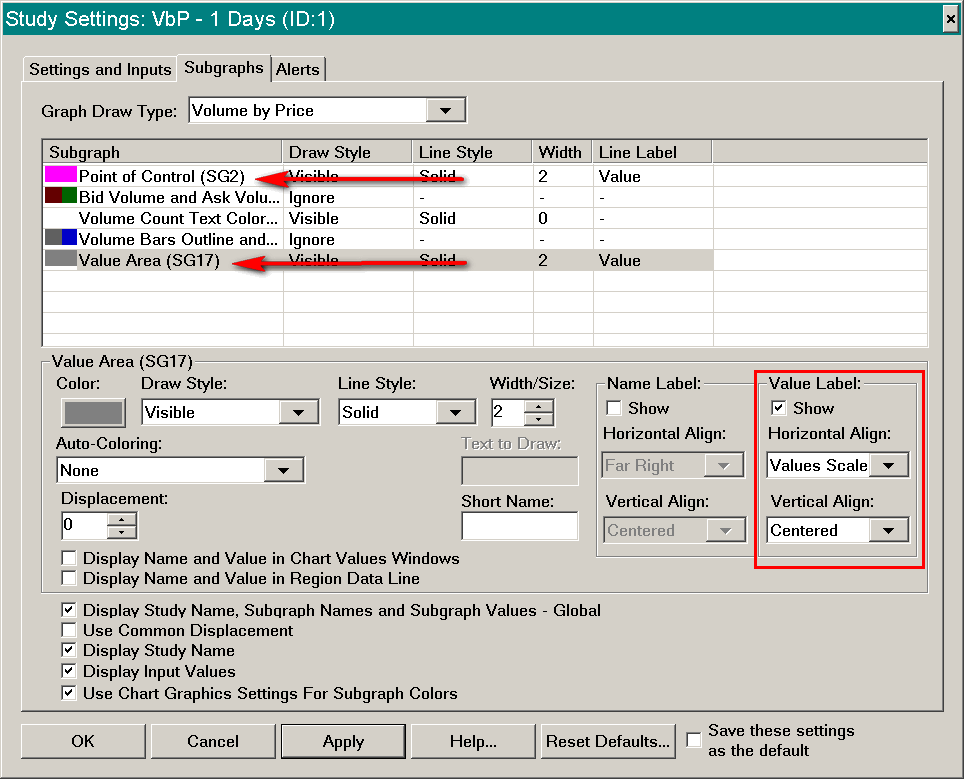
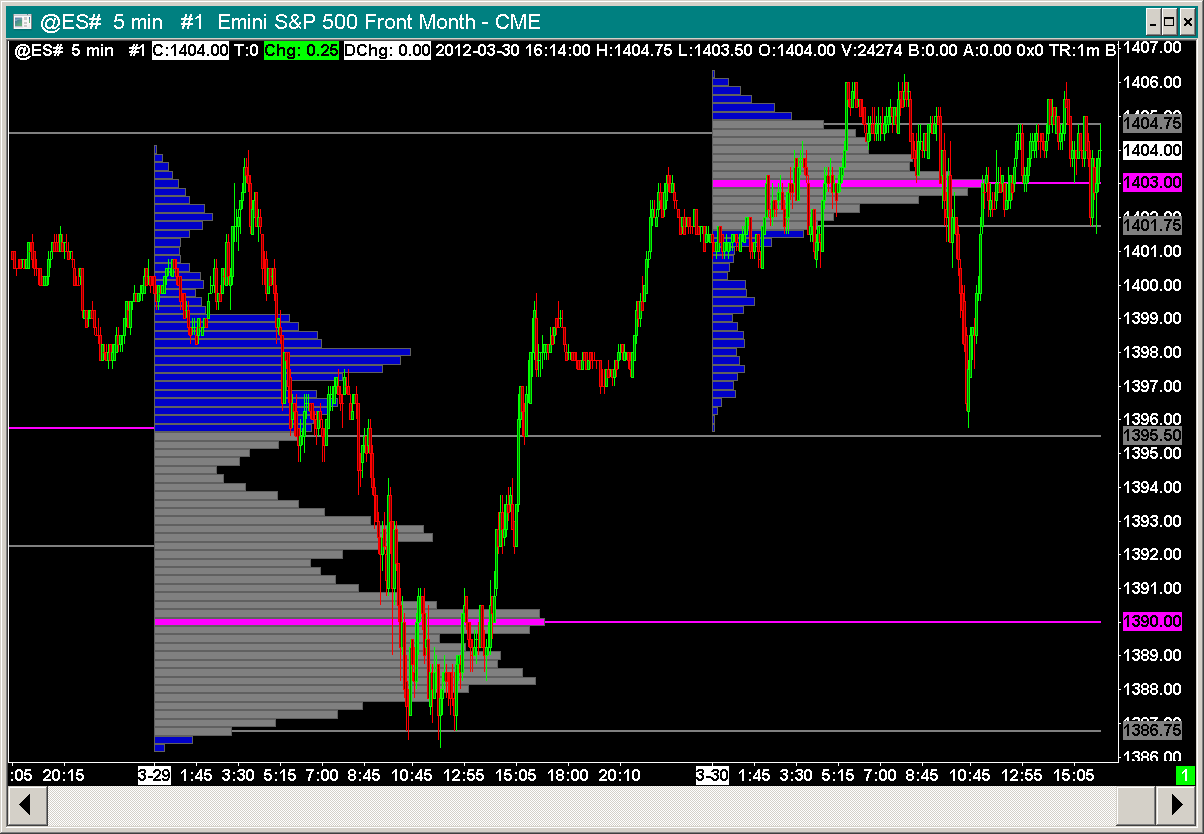
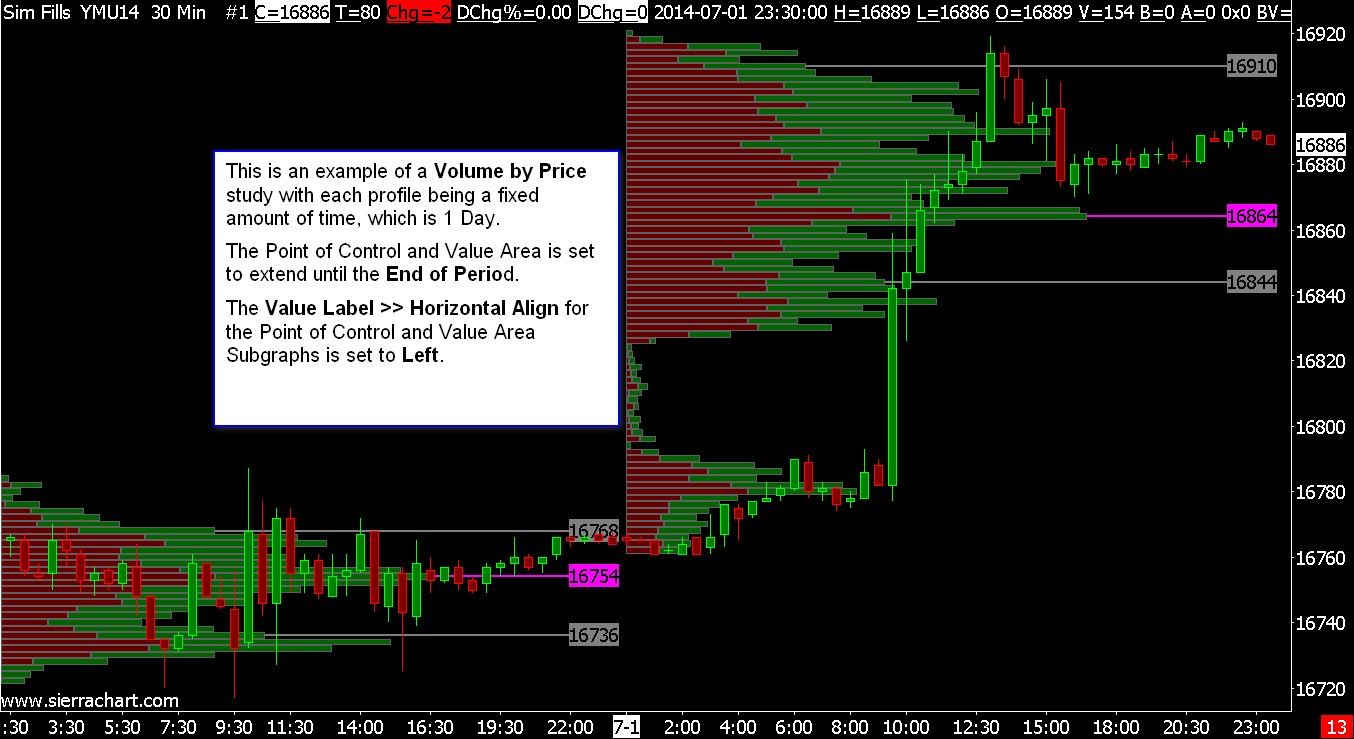
Value Labels can be enabled on the Point of Control, Value Area, Volume Weighted Average Price, and Peaks and Valleys lines that have been set to extend. To set up these Value Labels, follow the instructions below.
The Name and Value Labels for the most recent period will always be displayed in the Right Side Values Scale, regardless of the selected setting for the Horizontal Alignment. Changing the Horizontal Alignment will affect all other profiles that are displayed for the study.
- Open the Study Settings window for the Volume by Price study.
- Select the Settings and Inputs tab.
- The Value Labels will only be visible if you have enabled the extension lines for the particular item you are working with. Therefore, you will need to set the appropriate input to a setting other than None. For documentation for these specific inputs, refer to Volume by Price Input Settings. If you want to have the labels drawn near the Volume Profiles themselves, then use a setting of End of Period.
- Select the Subgraphs tab.
- Select the appropriate Subgraph based on the following information:
- Point of Control: Point of Control (SG2)
- Value Area: Value Area and Outline (SG9)
- Volume Weighted Average Price: Volume Weighted Average Price (SG5)
- Peaks and Valleys: Volume Peaks (SG18) or Volume Valleys (SG19)
- Enable the Show option for the Value Label. Set the Horizontal and Vertical alignment options as you require. By setting the Horizontal Align to Left, you will be able to see the labels on historical Volume Profiles (refer to the image). Press the Color button for the Subgraph to change the color of the extension lines and labels as required.
- To display a Name label as well, enabled the Show option for the Name Label. Set the Horizontal and Vertical alignment options as you require. By setting the Horizontal Align to Left, you will be able to see the labels on historical Volume Profiles (refer to the image). In the case of the Name Label, if the Horizontal Align is the same as the Value Label, then choose a different Vertical alignment so they do not overlap each other.
- Press OK.
Volume Value Area
To highlight the Value Area portion of the volume profiles, set Highlight Value Area to Yes in the Input settings.
To display the Volume Value Area High and Low on the chart as lines, you will need to use the Volume Value Area Lines study. The study will also display the point of control as well. With this study you have the ability to display the Volume Value Area Lines for any time period and based upon either the current period or a prior period.
Right Aligning Volume Profiles with Space on Right Side of Chart
In the image below you will see that the Volume Profile bars are on the far right side of the chart.
This will be the case if the following Inputs are set as specified when using one of the Volume Graph Period Types that displays a single Volume Profile.
- Right Align Volume Bars = Yes
- Align to Far Right = Yes
If you want multiple Volume Profiles aligned to the right side, then set Allow Side By Side Profiles on Right Side to Yes to prevent them from overlapping each other. Multiple Volume Profiles can be displayed by adding the Volume by Price study multiple times to the chart, each one configured as you require.
When using one of the Volume Graph Period Types which displays multiple profiles, then refer to the Right Aligning Multiple Profiles section below for instructions to right align those Volume Profiles and right align the last one to the far right.
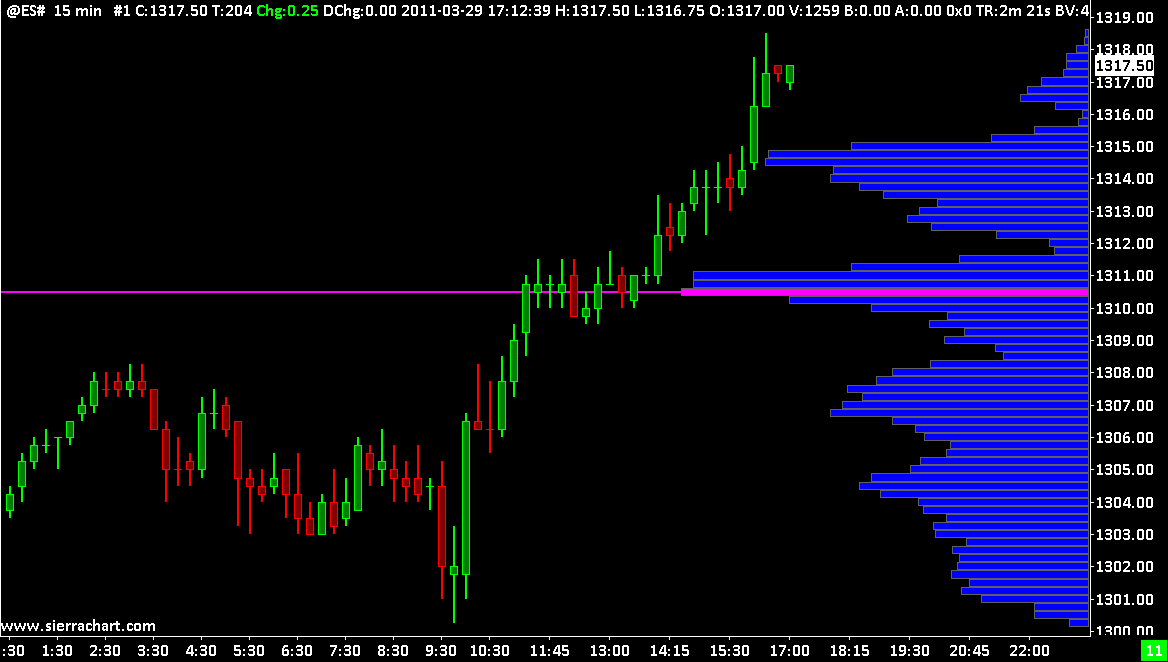
Right Aligning Multiple Profiles
When the Volume Graph Period Type Input is set to a value that includes Multiple profiles and you want to have the last displayed Volume Profile aligned to the far right side, then follow these instructions:
- Open the Study Settings window for the Volume by Price study and go to the Settings and Inputs tab. Refer to the Volume by Price Input Settings section for instructions.
- Set the Right Align Volume Bars study Input setting to Yes.
- Set the Align to Far Right study Input setting to Yes.
- Set the Always Display Last Profile in View study Input setting to Yes.
- If you want multiple Volume Profiles aligned to the right side, then set Allow Side By Side Profiles on Right Side to Yes to prevent them from overlapping each other.
- Press OK.
Creating Space on Right Side of Chart
Follow the instructions below to create space on the right side of the chart so the Volume Profile which is aligned to the far right does not overlap any chart bars.
- To create space between the last bar in the chart and the right side of the chart, you need to use the Right Side Fill Space
- Basically, you need to scroll the chart past the right side and then lock the fill space with Chart >> Lock Fill Space.
- To reduce the width of the Volume Profile and maintain a fixed width, open the Study Settings window for the Volume by Price study and go to the Settings and Inputs tab. Refer to the Volume by Price Input Settings section for instructions.
- Set the Maximum Volume Bar Width Type study Input setting to Window Width.
- Set the Maximum Volume Bar Width Percentage study Input setting to the percentage that you require. You will probably want to set this to something small like 25.
- Press OK.
- Press OK.
Single Volume Profiles At End of Chart
Follow the instructions below to display a single Volume Profile covering the specified time period and located on the right side of the chart.
- Select Analysis >> Studies on the menu.
- Locate the Volume by Price study in the Studies Available list.
- Press the Add button.
- Press the Settings button to open the Study Settings window for the study if it has not already opened.
- Select the Settings and Inputs tab. Set the following Inputs:
- Set as Independent Volume Profile for TPO Chart = Yes, if this is applied to a TPO Profile Chart.
- Ticks Per Volume Bar = 1
- Set Volume Graph Period Type to one of the following:
- One Period at End of Fixed Time Length
- From Start Date-Time to End
- From Start Time to End
- From Start Date-Time + Fixed Time Length
- From Start Date-Time to End Date-Time
- One Period Based On Bar Count
- From Session Start Time to End
- One Period from Start Time to End Time
- One Period from Most Recent Period Start to End
- One Period at End of Fixed Time Length - Auto-Skip Empty Days
- Maximum Volume Bar Width Type = Window Width
- Maximum Volume Bar Width Percentage = 50
- Right Align Volume Bars = Yes
- Allow Side by Side Profiles on Right Side = Yes
- Select the Subgraphs tab. Set the Color settings as you require.
- Press OK.
- Press OK.
Single Bar Volume Profiles with Bid Volume and Ask Volume
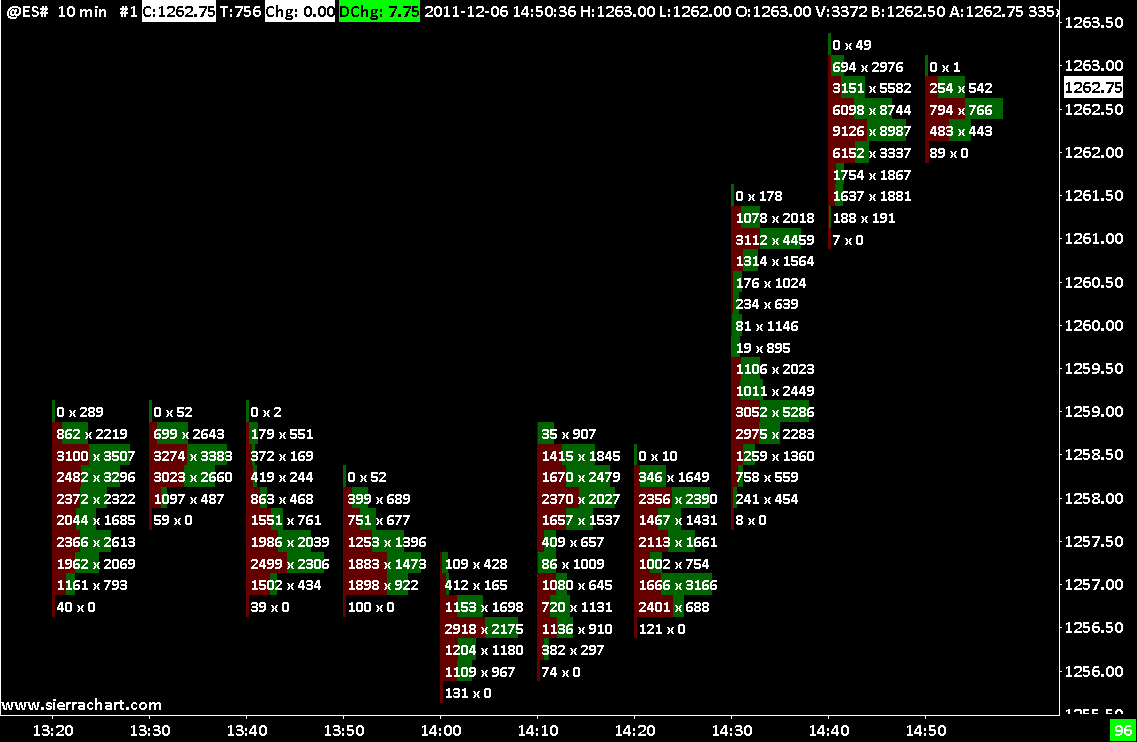
In this image you can see a Volume Profile for each individual chart bar. You will see the Bid volume and Ask volume displayed at every price level within the bar. Follow the instructions below to set up this type of chart display.
- Select Chart >> Chart Settings and set the Graph Type to Blank. This is so we see volume bars only. Set the Bar Period to what you require.
- Press OK.
- Select Analysis >> Studies on the menu.
- Locate the Volume by Price study in the Studies Available list.
- Press the Add button.
- Press the Settings button to open the Study Settings window for the study if it has not already been opened.
- Select the Settings and Inputs tab. Set the following Inputs:
- Ticks Per Volume Bar = 1
- Volume Graph Period Type = Multiple Profiles Based on Bar Count
- Number of Bars for 'Based On Bar Count' = 1
- Maximum Volume Bar Width Type = Period Length
- Maximum Volume Bar Width Percentage = 80
- Display Volume in Bars = Bid Volume x Ask Volume
- Draw Outline When Coloring Bid Volume and Ask Volume = No
- Highlight Value Area = No
- Highlight Point of Control = No
- Align Volume Numbers to Base of Volume Bars = Yes
- Select the Subgraphs tab. Set the Color settings as you require.
- Press OK. Press OK.
- For a Study Collection file with the configuration above, go to the Additional Files page. Save the SingleBarVolumeProfilesWithBAV.StdyCollct file to the Data Files Folder as documented on that page.
Displaying Separate Profiles for Day and Evening Sessions
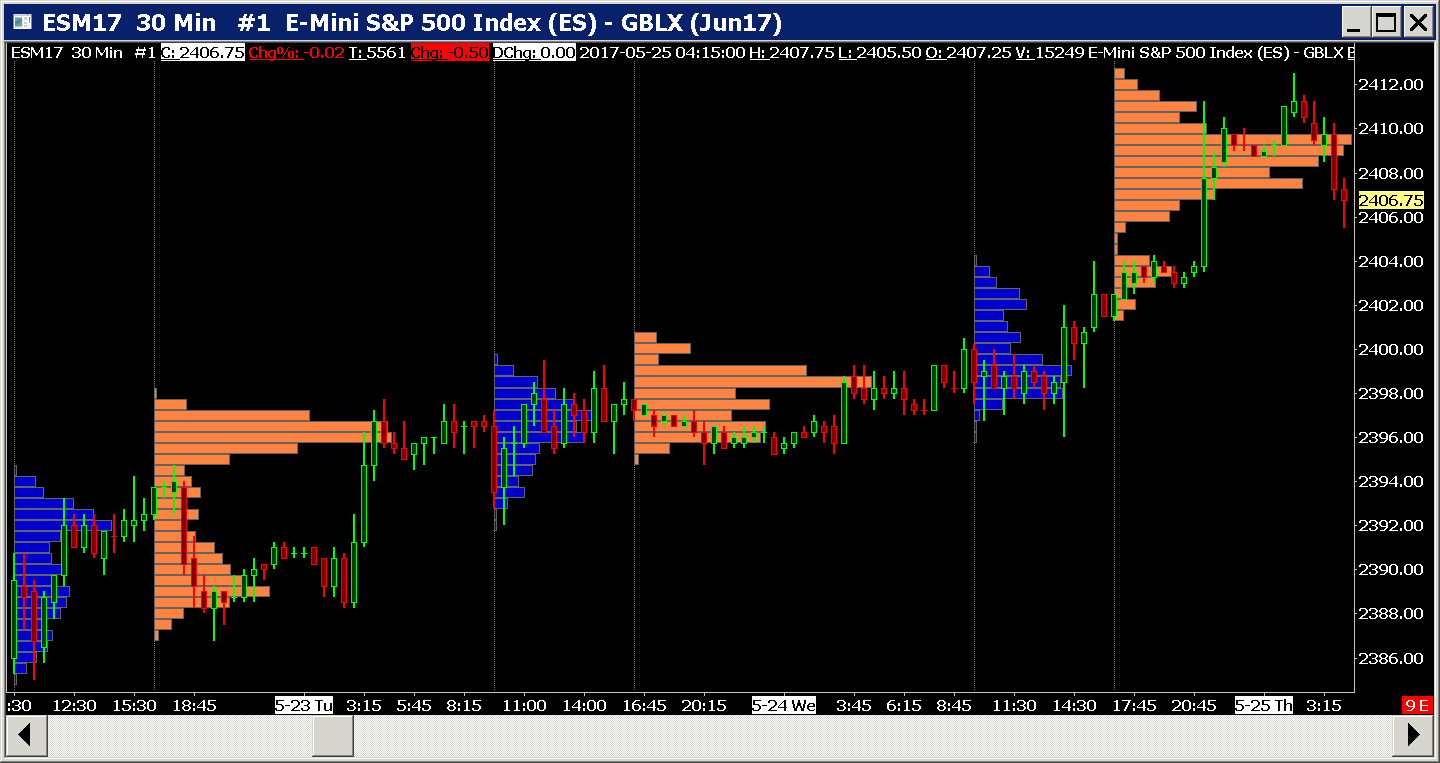
- Add the Volume by Price study to the chart and open the Study Settings window. Refer to Adding/Modifying Study Settings for instructions.
- Set the Volume Graph Period Type input to Multiple Profiles Based on Fixed Time.
- Set the Time Period Length for 'Fixed Time' input to 1.
- Set the Time Period Type for 'Fixed Time' input to Days.
- Set Use Separate Profile for Evening Session input to Yes.
- Select the Subgraphs tab.
- In the Volume Bars Outline and Fill Colors and the Evening Session Volume Bars Outline and Fill Colors subgraphs set the colors for the Day and Evening Session Volume Profiles. For additional information, refer to Color and Width Settings.
- Press OK. Press OK.
- Select Chart >> Chart Settings.
- Set the Session Times >> Start Time to the start of the day trading session. For complete documentation refer to Session Times.
- Set the Session Times >> End Time to the end of the day trading session.
- Enable the Session Times >> Use Evening Session option.
- Set the Session Times >> Evening Start to the start of the evening session.
- Set the Session Times >> Evening End to the end of the evening session.
- Press OK.
- You should then have a chart that looks like the image above. There will be a completely separate Volume Profile for the Day and Evening session. The above chart also contains the TPO Profile Chart study as well.
Displaying Single Separate Profiles for Day and Evening Sessions
Follow the instructions below to display 2 single Volume Profiles for the Day Session and Evening Session.
The instructions below need to be followed twice. Once for the Day Session and again for the Evening Session.
- Add the Volume by Price study to the chart and open the Study Settings window. Refer to Adding/Modifying Study Settings for instructions.
- Set the Volume Graph Period Type input to One Period from Start Time to End Time.
- Set the Start Time Input to the beginning of the Day Session for a Day Session profile, or to the beginning of the Evening session for an Evening Session profile.
- Set the End Time Input to the end of the Day Session for a Day Session profile, or to the end of the Evening Session for an Evening Session profile.
- Set any other Inputs as you require.
- Select the Subgraphs tab.
- On the Volume Bars Outline and Fill Colors subgraph set the colors for the Volume Profile. For additional information, refer to Color and Width Settings.
- Press OK. Press OK.
- Press OK.
Calculating and Displaying Developing Point of Control, Value Area High/Low, Volume Weighted Average Price Lines
To calculate and display the developing Point of Control, Value Area High and Low, and Volume Weighted Average Price lines for the Volume by Price study perform the steps below.
One or more of these lines can optionally be displayed.
- Add the Volume by Price study to the chart and open the Study Settings window. Refer to Step-By-Step Instructions for instructions.
- Select the Settings and Inputs tab of the Study Settings window.
- Set the Draw Mode Input to one of the following:
- Volume Profiles & POC, VAH, VAL, VWAP Lines (Use this if you want to see the Volume Profiles and the Point of Control, Value Area High/Low, and Volume Weighted Average Price lines)
- POC, VAH, VAL, VWAP Lines Only (Use this if you only want to see the Point of Control, Value Area High/Low, and Volume Weighted Average Price lines)
- Set the Number Of Periods Back to Reference Input to 1 if you want the Point of Control, Value Area High/Low, and Volume Weighted Average Price lines to be based upon the prior period.
- Set the Calculate Developing POC and Value Area Input to Yes.
- Select the Subgraphs tab.
- For the Point of Control, Value Area High Value, Value Area Low Value, and Volume Weighted Average Price Subgraphs, set the Color, Draw Style, and Width settings for those as required. If you do not want to display one of these lines, set its Draw Style to Ignore.
- Subgraph Name and Value labels can be displayed for any of these lines. For instructions, refer to Name and Value Labels.
- If you only want to see the Name and Value labels only and not the lines themselves, then set Draw Style to Subgraph Name and Value Labels Only for the Point of Control, Value Area High Value, Value Area Low Value, and Volume Weighted Average Price Subgraphs.
- If you have enabled the Name Label for any of the Subgraphs, it is recommended to specify an alternate Short Name for those particular Subgraphs. For example, for the Point of Control Subgraph we recommend using POC for the Short Name.
- Press OK to close the Study Settings window.
- Press OK to close the Chart Studies window.
It is also possible to calculate and display the developing Point of Control and Value Area High/Low lines when using the Volume Value Area Lines study. To do this, set the Draw Developing Value Area Lines input for the Volume Value Area Lines study to Yes.
Displaying Mean Price and Standard Deviation Lines
In order to display the Trade Weighted Mean Price, Mean Price + Std Dev, Mean Price - Std Dev, Mean Price + 2 * Std Dev, or Mean Price - 2 * Std Dev on the chart along with the Volume by Price profiles and the VAH, VAL, VWAP, and POC Lines, follow these instructions:
- The Chart must be an Intraday Chart. To verify this, open the Chart Settings and ensure that the Chart Data Type is set to either Intraday Chart or Intraday Chart Only.
- Add the Volume by Price study to the chart. For more information on how to add this study, refer to the Step by Step Instructions.
- Open the Settings page for the Volume by Price study. For more information, refer to Technical Study Settings Window.
- On the Settings and Inputs tab of the Settings page, set the Draw Mode Input to either POC, VAH, VAL, VWAP Lines Only or Volume Profiles & POC, VAH, VAL, VWAP Lines.
- Set the Calculate Mean Price and Standard Deviation Bands Input to Yes.
- On the Subgraphs tab of the Settings page, select the particular Mean Price and Standard Deviation Lines you want to display and set the Draw Style to Line. Other Draw Styles can be used, depending on how you want to see the data. For more information, refer to Draw Style.
- Set the other Subgraph settings as desired. For more information, refer to Subgraphs Tab.
- Select OK to close the Settings page and have these changes go into effect.
Viewing Volume Profile Text Information
There are two ways to view various fields of data for Volume Profiles.
The first method is to set the Study Inputs which display text values at the top and/or bottom of the Volume Profiles to Yes. Refer to Display Entire Profile Volume in the Volume by Price Input Settings section. The other Inputs are listed below this one.
The second method is to set the Display Data in Chart Values Window Volume by Price study Input to Yes. When this Input is set to Yes, then various fields of data for the Volume Profile being pointed to with the Chart Values Tool will be displayed in the Window >> Tool Values Window.
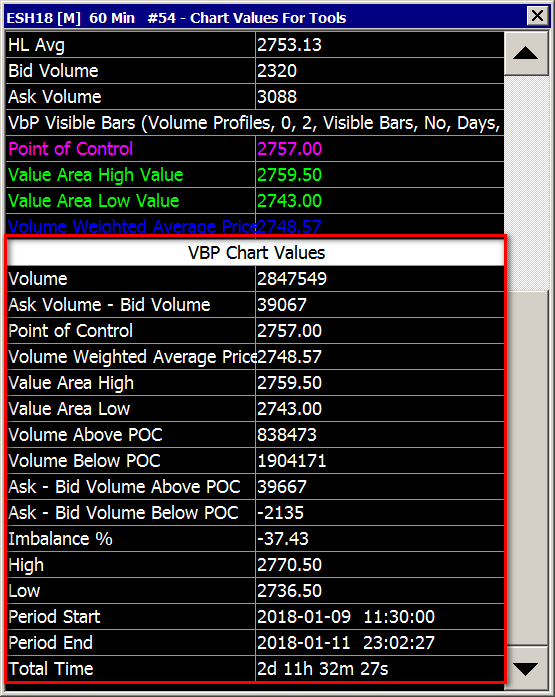
When the additional Volume Profile text information is displayed in the Tool Value Window, the following items are shown for the Volume Profile associated with the location of the Chart Values/Crosshair:
- Volume: This is the total volume of the profile.
- Ask Volume - Bid Volume: This is the difference between the Ask Volume and the Bid Volume. If this number if negative, then the Bid Volume is greater than the Ask Volume.
- Point of Control: This is the Price at which the Point of Control is located.
- Volume Weighted Average Price: This is the Price of the Volume Weighted Average Price.
- Value Area High: This is the Price of the High Value Area line.
- Value Area Low: This is the Price of the Low Value Area line.
- Volume Above POC: This is the amount of volume that traded above the Point of Control Price.
- Volume Below POC: This is the amount of volume that traded below the Point of Control Price.
- Volume Above Last Price: This is the volume that traded above the Last Price.
- Volume Below Last Price: This is the volume that traded below the Last Price.
- Ask - Bid Volume Above POC: This is the difference between the Ask Volume and the Bid Volume for the volume that is located above the Point of Control.
- Ask - Bid Volume Below POC: This is the difference between the Ask Volume and the Bid Volume for the volume that is located below the Point of Control.
- Imbalance %: This is the percentage difference of the volume above the POC to the volume below the POC. It is calculated as (Volume Above POC - Volume Below POC) / Total Volume.
- High: This is the highest price found within the Volume Profile.
- Low: This is the lowest price found within the Volume Profile.
- Period Start: This is the Starting Date and Time of the Volume Profile.
- Period End: This is the Ending Date and Time of the Volume Profile.
- Total Time: This is the total amount of time for the Volume Profile. It is the difference between the Period End and the Period Start times.
- Profile Study Name: This is the name of the Volume Profile Study.
- Profile Study ID: This is the id of the Volume Profile Study.
- Profile Range: This is the difference between the highest price and the lowest price within the Volume Profile.
Volume at Price Calculations
For Sierra Chart to be able to construct a complete Volume Profile for a specific period of time, it needs to know the Total Volume, Bid Volume, and Ask Volume for each price traded during that period of time. At a minimum it needs to know the Total Volume.
In the case of an Intraday chart, where the data file contains tick by tick data, the volume for each individual trade at a particular price is known. This allows for the most accurate construction of Volume Profiles.
Where the underlying data records in the chart data file for a chart, are larger than 1 Tick and these can range anywhere from 1 second to 24 hours, then the way the volumes are determined from a data record is by dividing the data record by the Tick Size and evenly applying the volume of that data record to each price tick. For example, if the Tick Size is 1 and a record ranges from 26 to 30 with a total volume of 100, then this is 5 price ticks. The volume for each price will be 20.
Algorithm to Minimize CPU and Memory Use
When constructing the Volume at Price data while the chart data is loading, in the case of a Historical Daily chart or an Intraday chart with more than 100,000 bars in the chart, if there are more than 500 price levels in a chart bar, then the Volume at Price Multiplier for that bar will be internally increased to a higher increment to minimize the amount of processing and memory use.
Unless the number of prices per chart bar exceeds 4000, the Volume At Price Multiplier will be increased only to 2.
The result of this algorithm will be missing price levels in the Volume Profiles displayed on the chart. The volume from these missing levels have been combined with nearby price levels.
Understand that this is necessary functionality to prevent excessive CPU and memory use which can occur with wide ranges of prices in chart bars.
Volume Profile Differences
If you notice differences with Volume Profiles, the Volume Value Area High and Low, the Point of Control, or the Volume Weighted Average Price for a specific period of time in a chart compared to another chart in Sierra Chart, another Sierra Chart user, or another program, then check the following details.
This information also applies to two seemingly identically configured Volume by Price studies within the same chart.
- If you have a Volume by Price study, on a Trading DOM, first set up the volume by Price study, on a standard chart with bars using the same Input settings and the same relevant Chart Settings. troubleshoot the issues you have with the Volume by Price study on a standard chart. Once that is resolved and you can begin to resolve the issue on the Trading DOM. Sierra Chart support will not troubleshoot a Volume by Price study on a Trading DOM.
- Make sure the global Time Zone setting and also the time zone set on the chart if set specifically on the chart, match. For complete instructions, refer to Time Zone.
- Select Chart >> Chart Settings.
- In the case of Intraday charts, check the Intraday chart Session Times to make certain they match the chart you are comparing to. Make sure New Bar at Session Start and the Weekend data settings match.
These settings are also relevant in the case of a Trading DOM. When specifying the Start Time in the Volume by Price study settings, the Session Times in Chart Settings needs to span the full 24 hours (Example: Start Time: 00:00:00, End Time: 23:59:59). - Make sure the Tick Size is correct for the symbol.
- Make sure the Volume at Price Multiplier is set to 1. The only time where this should be a higher value than 1 is for Historical Daily, Weekly, Monthly charts.
- In the case of Intraday charts, the chart bars must be based upon a fixed amount of time and must not be Number of Trades, Volume, Range, Reversal, Renko, Delta Volume, Price Change, Point and Figure Bars, at least when you want an exact match of volume profiles to other charts.
Therefore, the Bar Period Type must be set to Days-Minutes-Seconds. The first chart bar for the Volume Profiles being compared, needs to have the exact same Start Time. The last chart bar for the Volume Profiles being compared, needs to have the exact same End Time. - Based upon the time period of the Volume Profiles, it is necessary to set either the Use Number of Days to Load >> Days to Load or Use Date Range >> From settings on the Main Settings tab of the Chart Settings window far enough back in time to load sufficient data that the Volume Profiles require. This is essential.
Depending upon the required amount of data needed for the Volume Profiles you may need to set the chart to a Continuous Futures Contract Chart.
In the case where you are comparing Volume Profiles between the charts, these settings need to be set identically on the charts. - Press OK to close the Chart Settings window.
- Select Chart >> Go to Beginning of Chart and ensure the Date-Time of the first bar in the chart, matches between the charts you are comparing. This may not always be necessary but could be necessary.
If they do not match between the charts being compared, then ensure the Chart >> Chart Settings >> Use Number of Days to Load >> Days to Load matches between the charts and reload each chart by going to the chart and selecting Chart >> Reload and Recalculate.
And make sure that the Volume by Price Input Settings are not referencing dates earlier than the first Date-Time in the chart.
Select Chart >> Go to End of Chart to go to the end of the chart. - To achieve the highest accuracy, there must be tick by tick data in the Intraday chart data file when using the Volume by Price study on Intraday charts. Refer to the Tick by Tick Data Configuration page for instructions. This is an essential step. You will need to re-download the historical data if necessary as the instructions explain.
- In the case of a futures contract symbol, it has a limited life. A futures contract chart for a particular symbol will not go back very far in time. When you look at a futures contract chart back in time to a point where that particular delivery month and year was not the actively traded one, the bars will look incomplete (may look like dashes) and have low-volume.
Therefore, for accurate Volume Profiles at those points in time, it is necessary that at every chart bar the particular futures contract symbol data being displayed is the one that was active at that time. To do this, set the chart to a Continuous Futures Contract chart. - It is essential that when using the Volume by Price study that the Chart >> Chart Settings >> Symbol >> Continuous Contract setting is not set to one of the Back Adjusted settings. This will result in inaccuracies. Only use the Back Adjusted settings if you know that is what you want!
- Open the Study Settings window for the Volume by Price study you have on the chart. To do this refer to the Adding/Modifying Chart Studies section.
- Set the Ticks Per Volume Bar Input with the Volume by Price study to 1, since this is what is needed for maximum accuracy.
- Check the settings within the Volume by Price study which affect the starting Date-Time and the ending Date-Time of the Volume Profiles, to make sure they are set as you require.
In the case of when the Volume Graph Period Type is set to Multiple Profiles Based on Fixed Time, then the time period of each profile is controlled by the Time Period Type for 'Fixed Time' and Time Period Length for 'Fixed Time' study Inputs.
In this case the starting and ending times of the Volume Profiles are dependent upon the Session Times in Chart >> Chart Settings. - Go through all of the other Volume by Price study Input settings to make sure they are correct.
- Press OK and OK to close the Study Settings and Chart Studies windows.
- In the case of a Historical chart, it could be missing data which will cause inaccuracies and differences with Volume Profiles. Refer to the Missing Data section about this. The most rapid way to download the missing data is to select Edit >> Delete All Data and Download.
- In the case of an Intraday chart, it could be missing data which will cause inaccuracies and differences with Volume Profiles. To see if there is any missing data, scroll through the chart bars and manually verify all of the data is there.
To ensure you have all the data, you will need to delete and re-download the data by going to the Intraday chart and selecting Edit >> Delete All Data and Download from the menu.
However, this will not make a difference if you are using a substandard data feed. Unless you are using a known good data feed or one of the Real-Time Exchange Data Feeds Available from Sierra Chart, you might be using a substandard data feed, in which case all the re-downloading you do will not solve the problem. Sierra Chart works with many external Data and Trading services which provide data feeds that are not from Sierra Chart.
Basic Volume Profile Troubleshooting Procedures
Follow the general troubleshooting instructions below to resolve a problem you may be having with Volume Profiles from the Volume by Price study.
- If the Volume Profile is not visible, then scroll through the chart across the time period it is for to see if it is visible. Refer to Scrolling the Chart.
- Check all of the Volume by Price Input Settings and review the documentation for them to make sure you understand them, they are set correctly and you understand exactly how they work.
- Look at each bar the Volume by Price study is based upon and make sure the data is present, correct and complete.
- Before bringing an issue to Sierra Chart support, you must follow through the above steps because it is you the user who is in a much better position to determine the source of the problem than Sierra Chart Support is.
We do not know exactly what you are doing, we do not know what you expect to see and why, we cannot see all of the chart data, we do not know the Chart Settings, we cannot interact with the chart you have set up and we do not know the Volume by Price Study Settings you are using.
How Volume by Price is Calculated for Historical Daily and Higher Timeframe Charts
When using the Volume by Price study on Historical Daily and higher timeframe charts (Weekly, Monthly, Yearly) opened with File >> Find Symbol >> Open Historical Chart, the accuracy of the Volume Profiles is significantly less than when using Intraday chart data.
The bars in a Historical Daily chart simply consist of Open, High, Low, Close, Volume values. These are known as Daily data record values. Higher timeframe charts (like Weekly, Monthly, Yearly) simply combine multiple Daily data record values to create higher time frames.
Therefore, the Volume at a price level within a Daily bar is simply the average volume per price based upon the price range of the Daily data and the Volume of that Daily data.
The average Volume at Price is calculated by dividing the Volume by the number of prices in the High to Low price range. The number of prices is based upon the Chart >> Chart Settings >> Tick Size multiplied by the Volume at Price Multiplier setting.
As you can tell, this is just an estimation which is significantly less accurate compared to an Intraday chart using tick by tick data. So the Point of Control and Value Area High and Low values will be different compared to what is obtained when using an Intraday chart.
Based upon the above volume calculation method, if there is no volume at a particular price level it will not be displayed in the Volume Profiles for Historical charts. You will see missing horizontal volume bars in this case which actually makes sense because there simply is no volume at that price level. This is done for performance reasons.
If you want to have chart bars that are Daily and higher time frames, and also use the Volume by Price study, you need to use Intraday chart data instead. For instructions to do this, refer to Create Daily Bars with Custom Session Times.
Draw Volume Profile
This section documents how to manually draw a Volume by Price study on the chart by using the Draw Volume Profile tool.
This lets you interactively draw a Volume Profile on the chart which adds a Volume by Price study for each Volume Profile that you draw. You are able to interactively set the Starting Date-Time and the Ending Date-Time of the Volume Profile.
It is supported to interactively modify the Starting Date-Time and the Ending Date-Time of the drawn Volume Profile directly on the chart using this functionality.
You cannot use the Draw Volume Profile tool with TPO Profile Charts. There is no support for this.
Description
This drawing tool allows you to interactively insert a Volume by Price study for the highlighted time range.
In the case where you want Volume Profiles to repeat on the chart and have a specific time length per Volume Profile, you will need to directly add the Volume by Price study to the chart through Analysis >> Studies. In this particular case, refer to the Step By Step Instructions on this page.
In this case, do not use the Draw Volume Profile tool. This tool has a special application and that is to interactively apply a Volume by Price study that covers a very specific Date-Time range.
It needs to be understood, that when drawing a Volume Profile interactively, you are controlling the starting Date-Time and the Ending Date-Time for the Volume Profile interactively. You are not controlling the High to Low range. That is completely dependent on the chart bars contained within the time range.
Tool Usage
- You will need to be on Sierra Chart service package 5 to use this feature. To change your Sierra Chart service package, select Help >> Account Control Panel on the menu. Click on the Set Service Package For Renewal link on the displayed webpage and follow the instructions to set the Usage Time Service Package to 5 (Advanced). After you change your service package, you will need to restart Sierra Chart.
- To select this tool, select Tools >> Draw Volume Profile on the menu. For other methods to select this particular Drawing Tool, refer to Selecting Tools.
- Left click on the chart with your Pointer at the bar where you want the Volume Profile to begin at. The Date-Time of that bar will be the starting time of the Volume Profile or the ending time if the second point is to the left of the first point.
- Move the Pointer to where you want the Volume Profile to end at. As you move the Pointer around the chart, you will notice an enclosing rectangle being drawn indicating the bounds of the Volume Profile to be inserted. Left click the Pointer again to set the ending Date-Time of the Volume Profile. In a chart you can use the Right Side Fill Space and click at a point to end the Volume Profile in this fill space. The right side fill space is also known as the forward projection area. As new bars are added to the chart, they will be included in the Volume Profile that you drew if it ends in the forward projection area.
- A Volume by Price study will be inserted that will cover the range between the two selected Date-Times.
If the required Volume at Price data is not already loaded in the chart, the chart will be reloaded with that data. - The images below show the enclosing rectangle while drawing a Volume Profile and inserted Volume by Price study.
- If you want to have a Volume Profile spanning more than the visible bars in the chart, then refer to Performing Drawings that Span More than the Window Width.
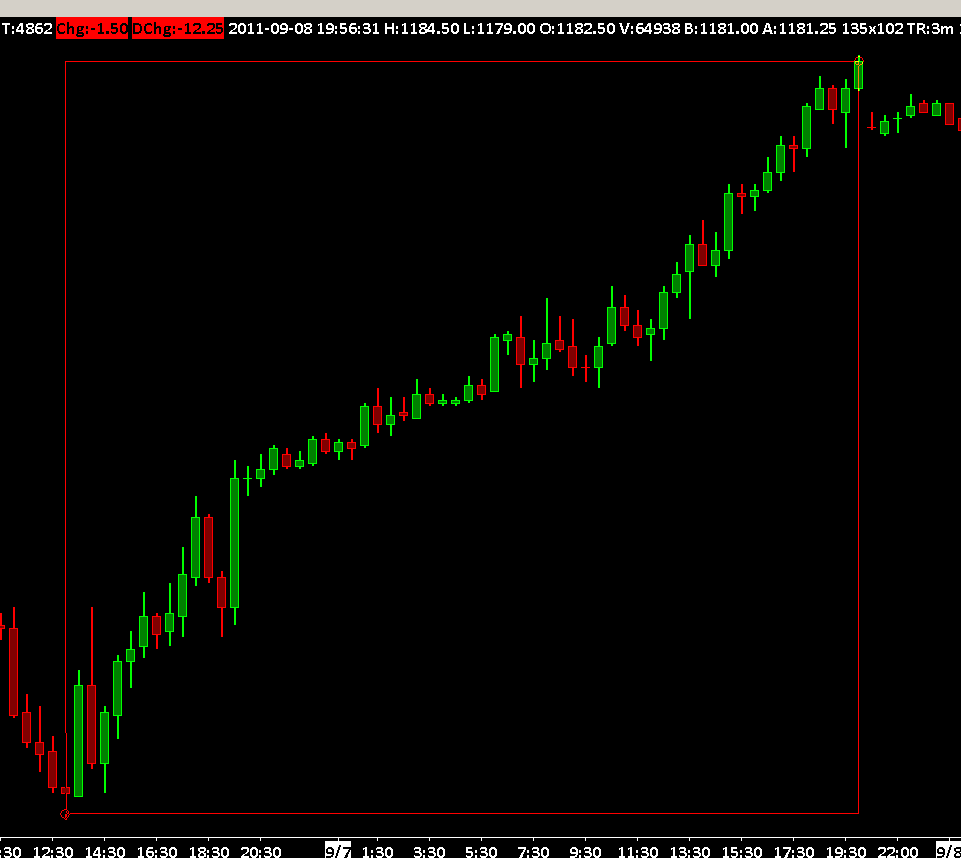
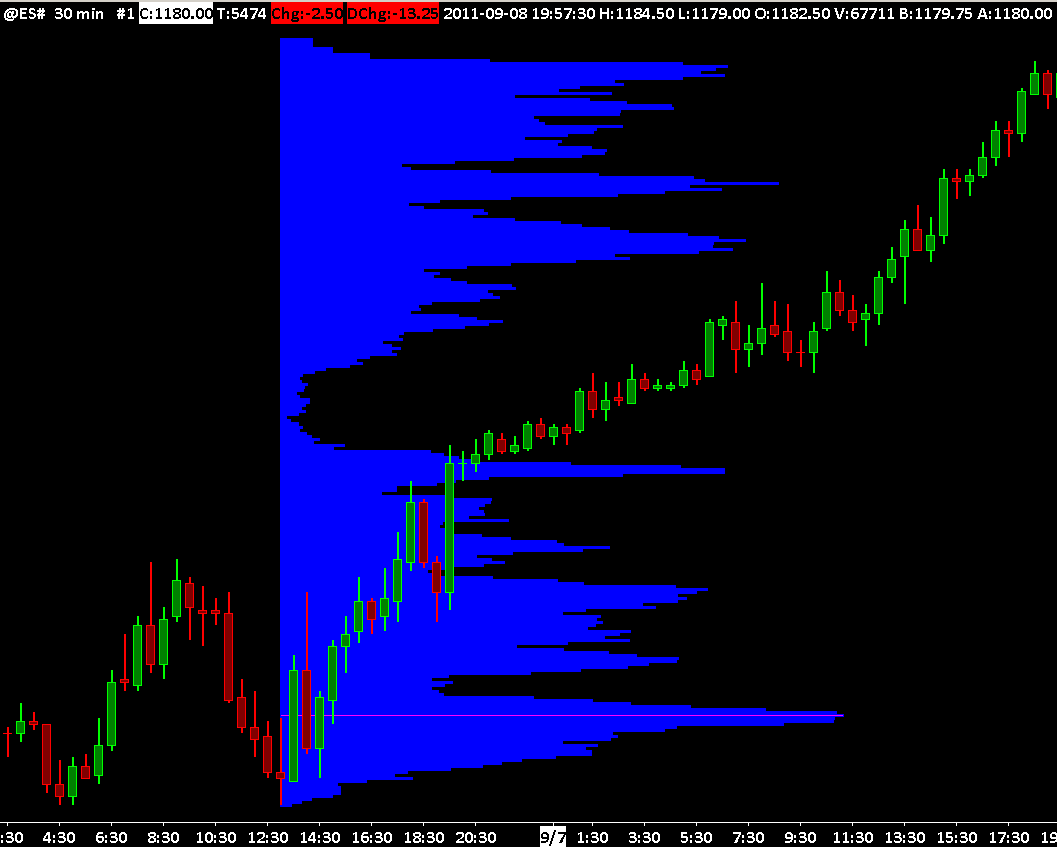
Step by Step Instructions to Configure the Draw Volume Profile Tool
The study Input settings for the inserted Volume by Price study drawn with the Draw Volume Profile tool, can be preconfigured. Follow the instructions below.
- The very first step is to define a Study Collection which will be applied when the Draw Volume Profile tool is used.
- Select Analysis >> Studies.
- In the Studies to Graph list, select the Volume by Price study.
- Press the Add button.
- Press the Settings button.
- On the Settings and Inputs tab set the Inputs as required. Refer to Volume by Price Input Settings.
- The Volume Graph Period Type Input with the Volume by Price needs to be set to one of the following:
- From Start Date-Time to End Date-Time
- From Start Date-Time To End
The Volume Graph Period Type Input with the Volume by Price study is limited to be either From Start Date-Time to End Date-Time or From Start Date-Time To End. - For the purpose of the configuration, the Start Date, Start Time, End Date, and End Time Inputs are all overridden with the values from the drawn Volume Profile.
So these do not need to be set. All other Input settings are taken as you have set them and will be saved in the Study Collection referenced by the Draw Volume Profile Tool configuration. - Select the Subgraphs tab and set the Colors and Styles as required. Refer to Color and Width Settings.
- Press OK.
- In the Save Studies As Study Collection >> Name box, type a name to give the Volume by Price configuration.
- Press the Save Single button and confirm.
- Press OK.
- Select Global Settings >> Tool Configs >> Draw Volume Profile.
- Select one of the Load >> TC1-TC24 configurations to save the configuration being defined as that particular number.
- Select the name that you saved the Study Collection as above, in the Chart Study Collections list.
If a valid Study Collection is specified, then the first Volume by Price study found in the Study Collection is used to set the settings of the inserted Volume by Price study. - Press OK. The configuration is now done at this point.
- Select Tools >> Draw Volume Profile on the menu.
- Select Tools >> Current Tool Config >> Config 1. The particular number you need to select will correspond to the TC1-TC24 configuration that you selected above.
- Alternatively, instead of the prior two steps, you can configure a Control Bar button to select the Draw Volume Profile tool and a particular Tool Configuration number in a single step.
For instructions, refer to Creating Control Bar Buttons which Select Drawing Tool and Drawing Tool Configuration in One Step. - Proceed to draw the Volume Profile as explained in the Tool Usage section.
- For the full documentation for the Volume by Price study, refer to Introduction on this page.
Manually Drawn Volume Profiles That Automatically Extend to the Last Bar
To have a manually drawn Volume Profile drawn with the Draw Volume Profile drawing tool, automatically extend to the end, follow the below instructions.
- Add the Volume by Price study to the chart and open the Study Settings window for it. Refer to Adding/Modifying Study Settings for instructions.
- Set the Volume Graph Period Type Input to From Start Date Time to End.
- Set the Ticks per Volume Bar input to 1.
- Press OK.
- In the Save Studies As Study Collection >> Name box, type a descriptive name for the Volume by Price study configuration that you will use.
- Press the Save Single button.
- Press OK.
- Select Global Settings >> Tool Configs >> Draw Volume Profile.
- Select the TC# 1-24 configuration that you want to set. For more information, refer to Drawing Tool Configuration.
- In the Chart Study Collection list box, select the name of the Study Collection you saved above.
- Press OK.
- Select Tools >> Draw Volume Profile on the menu.
- Select Tools >> Current Tool Config >> Config #. Choose configuration 1-24 depending upon which Tool Configuration (TC#) you set above.
- Alternatively, instead of the prior two steps, you can configure a Control Bar button to select the Draw Volume Profile tool and a particular Tool Configuration number in a single step. For instructions, refer to Creating Control Bar Buttons which Select Drawing Tool and Drawing Tool Configuration in One Step.
- Follow the Tool Usage instructions above.
Modifying Manually Drawn Volume Profile
An existing manually drawn Volume Profile can be modified. The beginning or ending Date-Time can be changed. As you modify a manually drawn Volume Profile, you will see the changes to the profile immediately displayed. Follow the below procedure to do this.
There are some unusual cases where a manually drawn Volume Profile will no longer be able to be interactively modified directly on the chart because the associated Chart Drawing for it has been lost. One scenario where this occurs is if you are modifying a Volume Profile drawing on the chart but do not finalize the modification and then close the Chartbook and save it. In this case the associated Chart Drawing will be lost preventing further modifications in this way.
- Enable the Global Settings >> Tool Settings >> Enable Drawn Volume Profiles Selection option. Press OK.
- Depending upon whether the Right Align Volume Bars study Input is set to Yes or No, the left edge or right edge of the Volume Profile may not be apparent as to its specific Date-Time location. To make it clear where the edges are which is necessary to easily adjust one side of the Volume Profile, it is recommended to set the Draw Profile Outlining Enclosing Bars Input for the Volume by Price study instance to Yes.
- Select Tools >> Pointer or Chart Values.
- Left click at or close to the base of the Volume Profile or on the opposite side of the base of the Volume Profile. The base will be on the left side, if Right Align Volume Bars is set to No. This will then cause the selection enclosing outline to be drawn. This is a different outline than is drawn by the Draw Profile Outlining Enclosing Bars Input. It is necessary to get this selection outline as the first step to start the process of adjusting the Volume Profile.
- Once you can see the selection enclosing outline around the Volume Profile, then left click on the left side of the outline to adjust the left side of the Volume Profile, or on the right side of the outline to adjust the right side of the Volume Profile.
- As you move the Pointer left or right, the Volume Profile will adjust itself. Left click again to set the edge into the new location.
Erasing Drawn Volume Profiles
There are multiple ways to remove the Volume by Price study that has been inserted by using this tool.
- Select Analysis >> Studies on the menu. Select the particular Volume by Price study in the Studies to Graph list. You can identify it by the displayed Date-Time range. Press the Remove button. Press OK to save the changes.
- Right-click with your Pointer along the top Region Data Line of the chart. This is not the title bar, but rather where you see the symbol and chart values displayed at the top of the chart window. Select Remove from the displayed menu. Select a specific Volume by Price (VbP) study you want to remove from the menu list. You can identify it by the displayed Date-Time range.
- Erase the Volume Profile Chart Drawing. Refer to Erasing Chart Drawings section. All of those methods also apply to erasing Volume Profile Chart Drawings.
Draw Volume Profile Tool Related Settings
The following are global settings for Volume Profiles which are drawn with the Draw Volume Profile tool. These are set through Global Settings >> Tool Settings.
- Enable Drawn Volume Profile Selection: When this option is enabled, then this allows Volume Profiles which have been drawn with the Tools >> Draw Volume Profile drawing tool to be selected on the chart in the same way as any other Chart Drawing can be. The Volume Profiles can be erased, adjusted, or moved.
- Select Drawn Volume Profile by Outline Only: When this option is enabled, then a drawn Volume Profile in a chart can only be selected by the boundary near its outline rectangle. This makes it less likely to be able to be accidentally selected.
Drawing Tool Configuration
To set a default configuration for the Draw Volume Profile tool, refer to Step by Step Instructions to Configure the Draw Volume Profile Tool.
Programmatically Accessing Volume at Price Data
Volume At Price Data
When developing custom studies/indicators or trading systems in Sierra Chart, the Volume at Price data for each bar at each price level can be accessed programmatically.
When using the Advanced Custom Study Interface and Language (ACSIL), use the sc.VolumeAtPriceForBars ACSIL interface structure member to access the Total Volume, Bid Volume, Ask Volume, and Number of Trades data at each price level for each chart bar.
When using one of the Spreadsheet studies, set the Output Volume at Price Data Input to Yes to output this data to a Spreadsheet.
Accessing Volume by Price Calculated Values
There are numerous values that are calculated for Volume Profiles which can be displayed through the Chart Values Windows. For more information, refer to Viewing Volume Profile Text Information.
There is not programmatic access to any of these values other than the Value Area High (Subgraph 3 / SG3) and Value Area Low (Subgraph 4 / SG4) and Point of Control (Subgraph 2 / SG2) values.
However, these Subgraphs are not set by the Volume by Price study when the study is used on a TPO Profile Chart unless the Set as Independent Volume Profile for TPO Chart Input is set to Yes.
The way to programmatically access these values when using ACSIL, is to reference the Volume by Price Study Subgraphs which contain those values. Refer to Using or Referencing Study/Indicator Data in an ACSIL Function.
When using the Draw Volume Profile tool, this will insert an instance of the Volume by Price study on the chart. This instance of the study can be referenced by using the Using or Referencing Study/Indicator Data in an ACSIL Function documented method. In this way you can access the study's Subgraphs for the Value Area High/Low and Point of Control values.
The Value Area High/Low and Point of Control values can also be accessed using the Spreadsheet Study. When the Volume by Price study is on a chart, the Sheet columns containing these Subgraphs will be outputted beginning at column AA or after.
The Value Area High/Low and Point of Control values can also be accessed using Simple Alerts on studies and charts. Refer to Study/Chart Alerts And Scanning. Value Area High is SG3, Value Area Low is SG4 and Point of Control is SG2.
Accessing Peak and Valley Lines Data
It is supported in ACSIL to access the Peak and Valley lines data. The function for this is sc.GetStudyPeakValleyLine.
Historical Market Depth Data
Somewhat related to this, is the ability to access historical market depth data. For more information, refer to c_ACSILDepthBars.
*Last modified Monday, 09th June, 2025.