Tick by Tick Data Configuration
- Instructions
- Verifying if Tick by Tick Data is in Intraday Data File
- Historical Bid Volume and Ask Volume
- Services That Support Bid Volume and Ask Volume
Instructions
This page explains settings that need to be made in order for Sierra Chart to download and store Intraday chart data in a tick by tick format. A tick means 1 trade.
There are various features in Sierra Chart which require tick by tick data for accuracy. These include the following studies and Bar Period Types:
- Numbers Bars study
- Volume by Price study on Intraday charts
- Volume Value Area Lines
- Number of Trades, Volume, Range, Reversal, Renko, Delta Volume, Price Change, Point and Figure Bars
Keep in mind that tick by tick data is less efficient because it takes more time to download, uses more drive space, and more CPU time during the historical data download. However, it is necessary for accuracy.
Follow the instructions below to set Sierra Chart to a tick by tick data configuration.
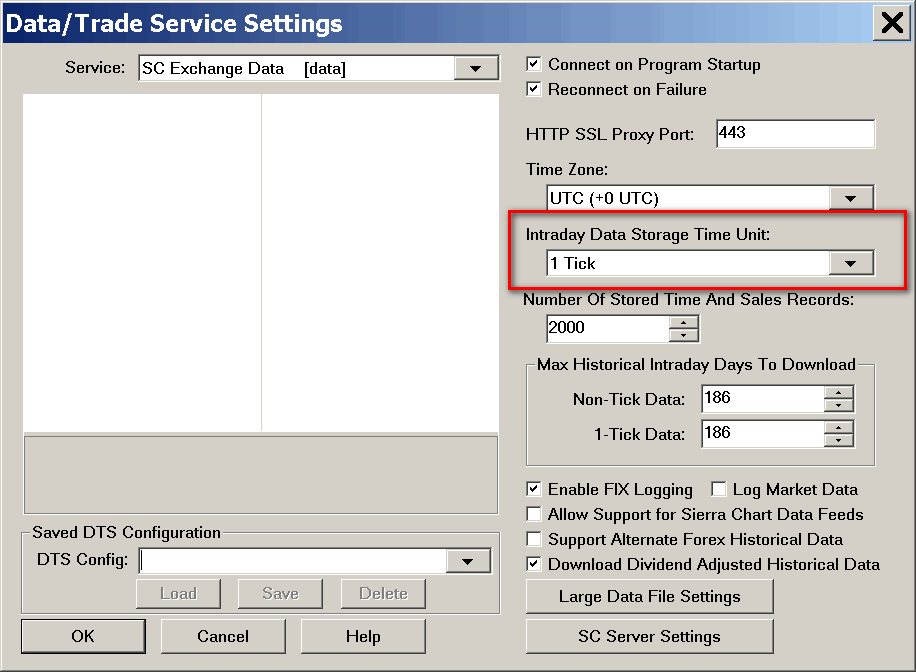
- Select Global Settings >> Data/Trade Service Settings.
- Change the Intraday Data Storage Time Unit to 1 Tick. You must use 1 Tick for maximum accuracy.
- Some supported Data and Trading services may not provide historical data in a tick by tick format. This is true of Interactive Brokers. Therefore, with these particular services, the historical data will not be tick by tick unless you use one of the Real-Time Exchange Data Feeds Available from Sierra Chart.
- Enable Allow Support for Sierra Chart Data Feeds. The only case where this should be disabled is if you are using one of the Real-Time Exchange Data Feeds Available from Sierra Chart and you deliberately do not want to connect to that data feed in the instance of Sierra Chart you are running.
- Press OK on the Data/Trade Service Settings window.
- To make sure that the historical Intraday data request is routed to the proper source, it is necessary that the Symbol Settings are up-to-date by following the instructions to Update the Symbol Settings. This only needs to be done one time.
- To ensure the Intraday chart data file for a symbol has complete tick by tick data, you will need to fully re-download the data in the Intraday charts by going to an Intraday chart for a symbol and selecting Edit >> Delete All Data And Download.
This only needs to be done once on an Intraday chart for each symbol. In other words, this does not need to be done for every Intraday chart you have open for the same symbol. Only one of them. - Based upon the particular Data or Trading service you are using and possibly your Sierra Chart account Service Package, 1 Tick Historical data may not be available. It could be a higher increment. One indication of this is the following line in the Sierra Chart Message Log:
HD Request # 10 | Requesting Intraday data. Start Date-Time: (Date-Time). Record interval: 1. Symbol: EURUSD
If the Record Interval is not 0, then historical tick by tick data was not being downloaded. The Record interval should be 0 in this particular case. - When chart data is loaded from the chart data file, 1 Tick data will take longer to load. And even longer to load when using the Numbers Bars, Volume by Price, TPO Profile Chart and any other studies that require detailed volume data due to the extra volume analysis needed while loading the chart data.
- Optional: If you want to see the tick by tick data in a chart, go to an Intraday chart and select Chart >> Chart Settings. Set the Use Number of Days to Load >> Days to Load to a small number like 1 or 2.
- Set the Intraday Chart Bar Period >> Bar Period Type to Number of Trades per Bar. Set the value in the box below to 1. Press OK.
- These last two steps are not a necessary procedure, but only a way to confirm you have tick by tick data. You can confirm this by seeing that the Open, High, Low, and Close values for each bar are the same.
Verifying if Tick by Tick Data is in Intraday Data File
Follow the instructions below to verify there is tick by tick data for a particular symbol in the Intraday chart data file for that symbol.
- Open an Intraday chart for the symbol if it is not already open through File >> Find Symbol >> [select symbol] >> Open Intraday Chart.
- Select Edit >> Edit/Download Data - Intraday Chart to open the Intraday Data Editor.
- Using the scroll bar at the bottom of the Intraday Data Editor, you can scroll through the data records in the data file.
- An indication that a record is a single trade/tick is that the Open price will be 0 (zero) and Number of Trades will equal 1.
- Another indication is when you look at the Hours, Minutes, and Seconds for the Time, you will notice that they are often the same for multiple adjacent data records. You will also notice the milliseconds for some records will be nonzero. This is another indication of tick by tick data.
- We recommend checking several records throughout the file to determine if the above is the true. Once you confirm this, then you have confirmed that the data file at the point in time you are looking at the records, are tick by tick data records.
- You need to also understand that an Intraday data file can contain various data record timeframes at different points in time. There could be a higher timeframe record like 1 Minute data at one point in time and tick by tick data at another point in time in the Intraday data file for the symbol.
Historical Bid Volume and Ask Volume
In addition to configuring Sierra Chart to request and maintain tick by tick data from the data server from the Data or Trading service being used, another consideration for certain studies and analysis methods, like the Numbers Bars and Cumulative Delta Bars studies, is that historical Bid Volume and Ask Volume needs to be provided by the particular Data or Trading service you are using.
For a list of services providing this data, refer to Services That Support Bid Volume and Ask Volume.
If historical Bid Volume and Ask Volume is not provided, then you need to stay connected to the data feed server (File >> Connect To Data Feed) as much as possible in order to have Sierra Chart maintain this data in real-time which Sierra Chart will be able to do with any Data or Trading service being used.
Bid Volume and Ask Volume represent the volume actually traded at the Bid or Ask respectively.
Services That Support Bid Volume and Ask Volume
With all of the supported Data and Trading services, Sierra Chart will calculate and record Bid Volume (Bid Trade Volume) and Ask Volume (Ask Trade Volume) for the symbol from real-time data received, so long as the symbol provides Bid prices, Ask prices and trade Volume. Additionally, for this data to be accurate tick by tick data needs to be provided by the data feed.
Bid Volume and Ask Volume refer to actual traded volume at the Bid or Ask prices, respectively. They do not refer to Bid or Ask Quantities in the order book/market depth.
With cash indexes there are no Bid or Ask prices, and sometimes there is not Volume. So historical Bid Volume and Ask Volume is not available with these symbols. However, Sierra Chart does record Bid Volume and Ask Volume if there are no Bid or Ask prices, by using a special algorithm.
To receive Bid Volume and Ask Volume for historical Intraday downloaded data, you need to use to use a Data or Trading service that provides this data.
The following are the Data and Trading services that provide historical Bid Volume and Ask Volume:
- Sierra Chart Real-time and Historical Forex and CFD Data Service
- Sierra Chart Real-Time and Historical Exchange Data Feed
- Denali Exchange Data Feed
- Sierra Chart Historical Data Service
- CTS T4 (when downloading historical 1-Tick data) Trading Platform Service
- CQG Trading Platform Service
- GAIN Capital (OEC Trader) Trading Service
- Rithmic Trading Platform Service
- FXCM FIX Trading Service
- Currenex Trading Service
- LMAX Trading Service
- DTN IQ Feed Data Service. Only when downloading historical Tick data and you must be aware of the 8 Day Tick Data Limitation. We recommend using either of the Real-Time Exchange Data Feeds Available from Sierra Chart instead. The 8-day tick limitation from IQ Feed has proven to be an ongoing serious limitation and problem for users and has been an unnecessary support burden upon us.
- Cryptocurrency Data Services
When using Interactive Brokers data, there is complete and total inaccuracy with Bid Volume and Ask Volume, the number of trades and volume. Historical Bid Volume and Ask Volume is not provided either. Sierra Chart Support will not provide any help with any data problems encountered with Interactive Brokers. when using Interactive Brokers you must use one of the Real-Time Exchange Data Feeds Available from Sierra Chart for a reliable and complete data feed.
*Last modified Wednesday, 22nd February, 2023.