Getting Started, Opening Charts and Basic Trading
- Introduction
- Appearance Settings
- Initial Setup
- Open a Chart
- Additional Steps
- Working with Sierra Chart Settings Windows
- Settings Windows Interface (Opens a new page)
- Notes About Charts
- Submitting An Order for Trading
- Need More Help?
- Online Documentation
- Notes
- Alternative Method of Opening Charts
Introduction
Welcome to Sierra Chart. Sierra Chart is an advanced financial market charting and trading application. It is a full-featured and complete application to meet your requirements. This page contains important step-by-step instructions for getting started with Sierra Chart, opening charts and introducing you to Trading from Sierra Chart. If you only want to read one page on this website, then this should be the page to read.
If Sierra Chart is not already running then press the Start button on your desktop and select Programs >> Sierra Chart >> Sierra Chart to run it. If the Login window displays prompting you for an Account Name and password, then read the Software Login Instructions page for further instructions. When Sierra Chart is started, the main Sierra Chart window will be blank. This is normal since no charts or other windows will be open.
Appearance Settings
The colors and font sizes within Sierra Chart are fully customizable. Due to your preferences and also your computer monitor resolution, adjustments may be necessary. Select Global Settings >> Graphics Settings to adjust the colors and font sizes.
For additional information, refer to Graphics Settings.
Initial Setup
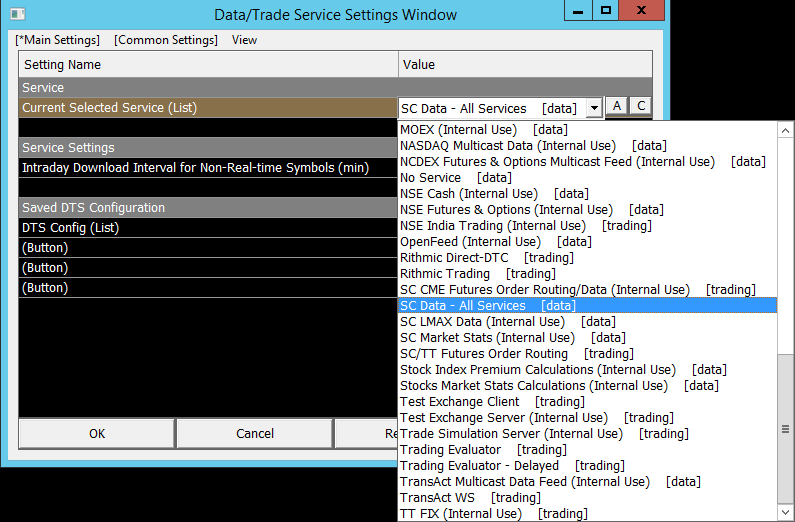
By default, Sierra Chart is set to work with the SC Data - All Services service which gives access to multiple Sierra Chart provided data services in a single connection.
A new Sierra Chart account which is on a Free Trial has access to a limited range of symbols.
For an understanding of what symbols provide real-time data and how to obtain real-time data for other symbols, refer to Real-Time Data.
Another available service which is included in the Sierra Chart trial and paid Service Packages is the Simulated Trading Service which provides simulated trading for futures, Forex and crypto currencies using a server-based environment for the simulated trading.
After the trial, Sierra Chart can be used with the supported Data and Trading services. To learn about the available data and trading services go to the Data and Trading Services page.
- Set the Global Settings >>Time Zone Settings to the Time Zone for the default time zone in which you want your charts displayed. Chart specific time zone settings are available.
-
- Select Global Settings >> Data/Trade Service Settings to open the Data/Trade Service Settings window.
- Select the Common Settings page listed at the top of the window to go the Common Settings.
- Ensure that Allow Support for Sierra Chart Data Feeds is set to Yes so that data from Sierra Chart can be received.
When using a Sierra Chart provided Data service, this this option is always implied to be enabled. This setting is only relevant under certain conditions and with certain external Trading services. - Set the Intraday Data Storage Time Unit to what you require. If you will be using Number of Trades, Volume, Range, Reversal, Renko, Delta Volume, Price Change, Point and Figure Bars, then set this to 1 Tick or 1 Second (1 Second is less precise). For complete details for this setting, refer to Intraday Data Storage Time Unit.
It is generally recommended to start with an Intraday Storage Time Unit of 1 Tick. But, if you want charts to load superfast and you understand the tradeoffs for using a higher time unit, then set this to 1 Minute. For more details, refer to Improving Performance of Loading Chart Data. - Set the Maximum Historical Intraday Days to Download settings to the number days of historical Intraday data that you want to have available for the symbols to be charted.
In the case of futures contracts, it is not necessary and not recommended to increase this beyond 186 days because that setting only applies to an individual contract month and not the overall amount of data to load into a Continuous Futures Contract chart which you will be using for long-term futures contract charts. - Press OK to close the Data/Trade Service Settings window.
-
Select File >> Connect to Data Feed on the menu (or press the Con button on the Control Bar) to connect to the Data server and Trade server (if applies to the service you are using) if Sierra Chart is not already connected.
If File >> Connect to Data Feed and the Con button are disabled, then this indicates Sierra Chart is already connected to the data feed. In this case, go on to the next step.
If there is a problem connecting to the data feed, then the Sierra Chart Message Log ( Window >> Message Log) will display and indicate this. In this case, refer to help topic # 1 for instructions to resolve the problem.
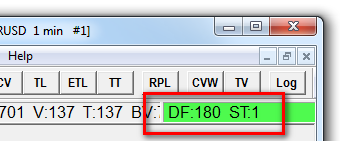
When Sierra Chart is connected to the external server, then DF: followed by a number will be displayed in the status window on the Control Bar below the Sierra Chart menu indicating this. Refer to the image below.
A connection to the server is also indicated by Con: # on the title bar of the main Sierra Chart window. The number after Con: is the data feed sequence number. And upon a successful connection to the server, a message will be added to the Sierra Chart Message Log indicating a successful connection.

Open A Chart
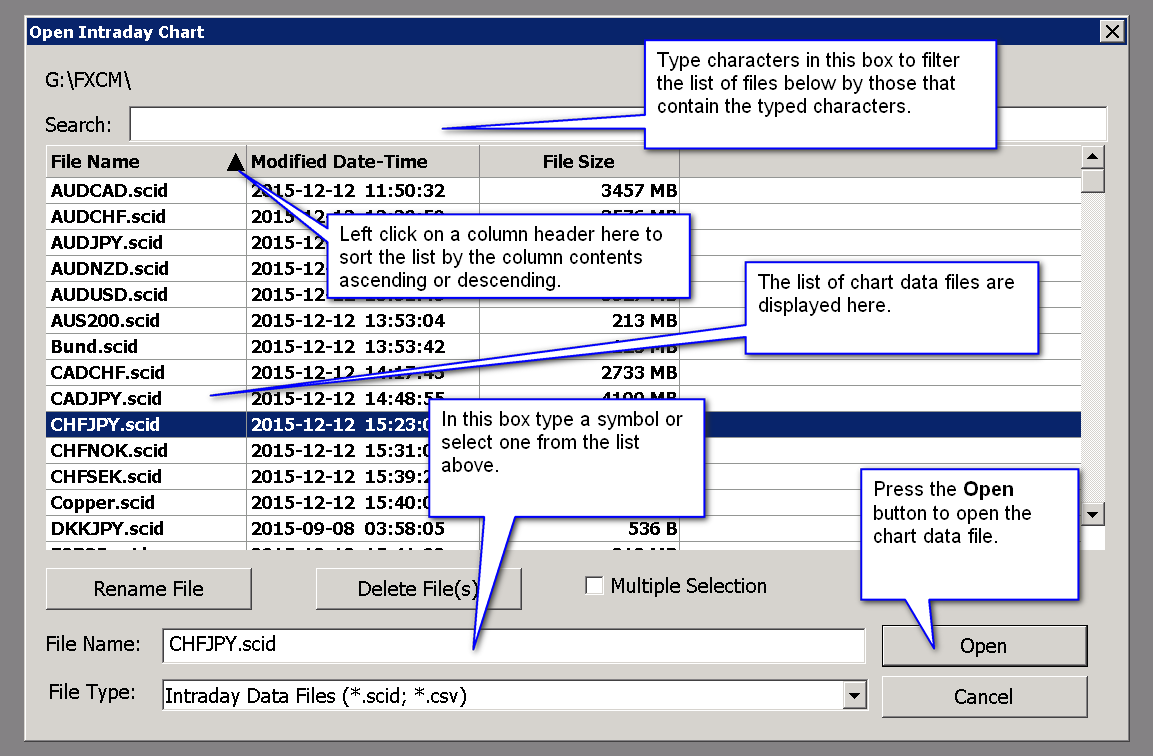
To open a chart or a Trade DOM, select File >> Find Symbol on the menu.
Locate and select the symbol in the list of available symbols, or manually enter one in the Selected Symbol box and press either Open Historical Chart, Open Intraday Chart, or Open Trading DOM.
In the case of stock symbols, they are not listed and have to manually be typed in the Selected Symbol box.
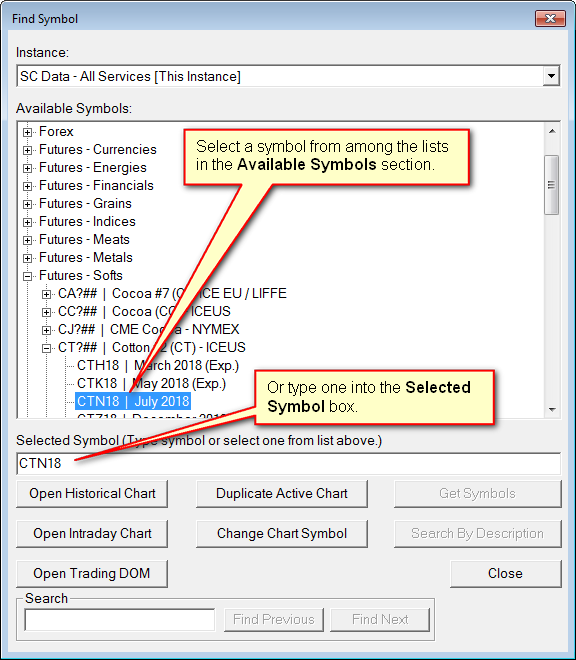
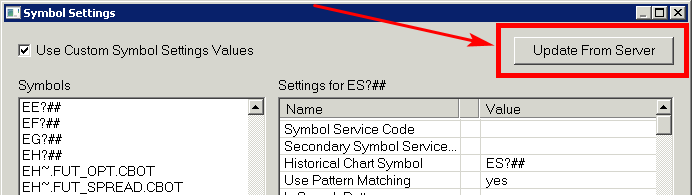
In the unlikely case, where the Find Symbol window is empty, you will need to follow the instructions to Update Symbol Settings. Refer to the image below.
A symbol is a short abbreviation for a particular Stock, Futures contract, Forex market, CFD, Index or Option contract.
A list of available symbols during a trial can be found on the Sierra Chart Trial Account page.
Historical charts have a bar period of 1 Day and greater. They can also be Weekly, Monthly, Quarterly and Yearly charts. A Historical chart with a period per bar of 1 Day, is called a Historical Daily chart. The underlying data in the data file are daily data records containing data for a single day.
Intraday charts can have any bar period. Usually the bar period is less than 1 day and are based on a fixed time frame down to 1 millisecond. Number of Trades, Volume, Range, Reversal, Renko, Delta Volume, Price Change, Point and Figure Bars are also supported.
Although you can specify a period per bar of 1 Day or greater with Intraday chart data types, it is usually not practical to create long-term Historical charts from Intraday data with a 1 Day or greater bar period because they will take a longer time to load and usually do not go back far in time.
For a Trading DOM, go to the Overview of Trading page to get started with trading from a Trading DOM.
If you use an unknown or improperly formatted symbol, you will not get any data in the chart window and it will remain blank. In the case of a Trade DOM, the center price will be 0. You will also see a message on the chart or Trade DOM that says Symbol is Unknown. If you receive this message or do not get a chart make sure you are using the correct symbol, and also refer to Help Topic 1.3 (Symbols).

Multiple charts can be opened through File >> Find Symbol by selecting the symbol and pressing the appropriate button. The chart windows can be arranged using the commands on the Window menu. Charts can be selected through the CW menu at the top of the main Sierra Chart window or from the chart tabs at the bottom of the window.
It is strongly recommended that you prevent the scanning of the Intraday data chart files with a file extension of scid by anti-malware software on your system. Many systems run Microsoft Security Essentials and it needs to be set to prevent the scanning of these scid files. If this step is not performed, anti-malware programs will have a significant impact upon the performance of Sierra Chart.
Additional Steps
-
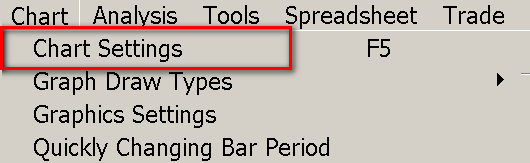
Chart Settings: To adjust the settings for the chart, make sure the chart is active and select Chart >> Chart Settings on the main menu.
Each chart has its own Chart Settings which are specific to that individual chart. Some settings can be shared among charts through the use of the Chart Linking feature.
-
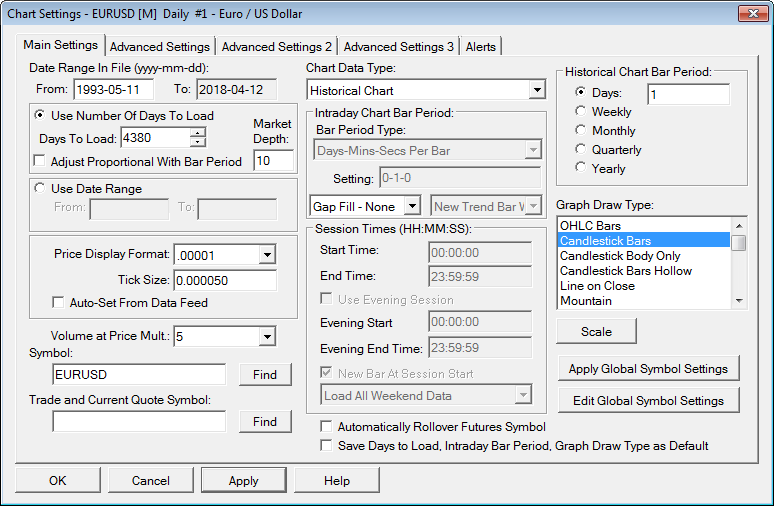
Days to Load: The number of days of data loaded in the chart can be changed with the Chart >> Chart Settings >> Data Limiting >> Days to Load setting. When increasing this setting for Intraday charts, if additional historical Intraday data needs to be downloaded you will be prompted for that after pressing OK. For detailed instructions to increase the amount of data in Intraday charts, refer to Downloading/Viewing More Historical Intraday data.
The bar period or timeframe of the bars in the chart can be changed to be based upon numerous available bar periods. All of which are fully customizable.
For Intraday charts, the available settings are in the Chart >> Chart Settings >> Bar Period >> Bar Period Type list. Refer to the image below.
For Historical charts, the available settings are in the Chart >> Chart Settings >> Bar Period >> Historical Chart Bar Period Type list. Refer to the image below.
Refer to the Chart Settings page for the complete documentation for the Chart Settings window.
Press the OK button to close the Chart Settings window.
- Continuous Futures Contract Charts: In the case of a futures contract symbol, like MES?##-CME, to increase the amount of historical data in these charts where at every bar the active contract month at that time is displayed, refer to the Continuous Futures Contract Charts page for instructions.
-
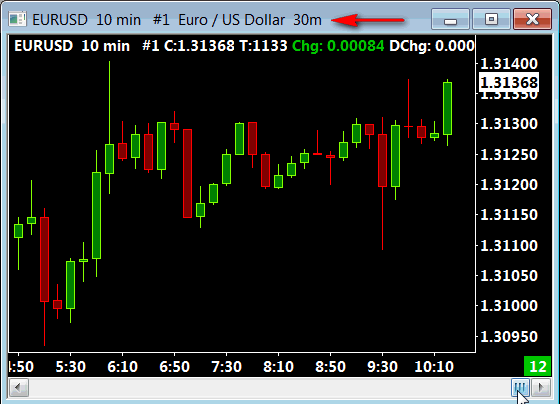
Changing the Timeframe Per Bar in a Chart: go to the chart and type the timeframe per bar directly into the chart window and select the Enter key.
For example, type the number of Minutes you want per bar into the chart window followed by the letter m for Minutes and the Enter key.
The chart window will capture the keystrokes as you type them. Example: 30m <ENTER>.
If the chart is already based upon Minutes, you can leave the m out and just enter the number of Minutes and press the Enter key.
For complete instructions, including changing between the available Bar Period Types, refer to the Changing Chart Bars Period documentation page.
Additionally, there are Control Bar buttons that can be pressed to change between common chart bar periods. You can add custom Control Bar buttons configured for a specific period per bar. For complete documentation, refer to Customize Control Bar.
-
Values Windows: Select Window >> Chart Values Window or Window >> Tool Values Window to display the two primary Values windows which display the data for the graphs in the chart. There is also the Compact Tool Values Window.
One of the most useful tools is the Tools >> Chart Values tool which displays a crosshair on the chart. With the Chart Values tool, the associated values for the chart column you are pointing to are displayed in the Tool Values Window.
-
Chart Shortcut Menu: You can right click with the Pointer over a chart window to display a menu of commonly used commands. If the chart is in Chart Trade Mode, you will see trading commands listed on the menu as well.
Select any of the Global Settings >> Customize Chart Shortcut Menu | Chart Trade Menu | Chart Drawing Menu commands on the main menu to customize this menu.
Keyboard shortcuts are also fully supported for all menu commands. For instructions, refer to Keyboard Shortcuts.

-
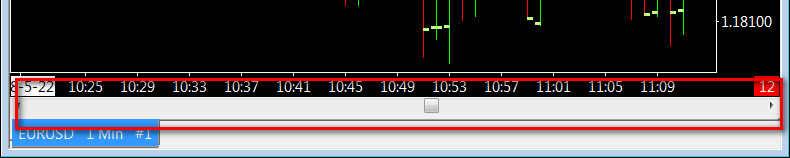
Scrolling The Chart: The chart can be scrolled back and forward in time by using the scroll bar located at the bottom of the chart.
To add space to the right side of the chart after the last bar in the chart, refer to Right Side Fill Space.
-
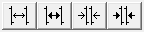
Horizontal Scaling: To change the bar spacing in a chart use the Up Arrow, Down Arrow, Page Up, and Page Down keys on your keyboard. Drag the timescale along the bottom of the chart left or right. Or use the Control Bar buttons shown below.
-
Vertical Scaling: The vertical scale can be expanded or compressed, or moved up and down. To do this click and drag on the Values Scale numbers on the right side of the chart. Right-click on those numbers to get a menu of Scale related commands. For complete instructions, refer to Scaling.
-
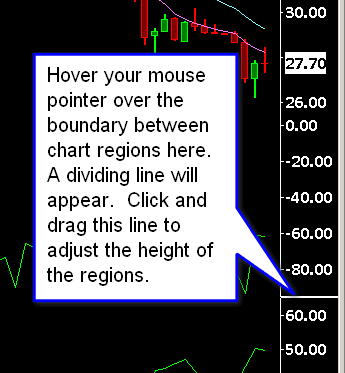
Adjusting the Height of Chart Regions: Refer to the image below.
-
Working with Charts: Refer to the Working With Charts documentation page for additional information on working with a chart.
-
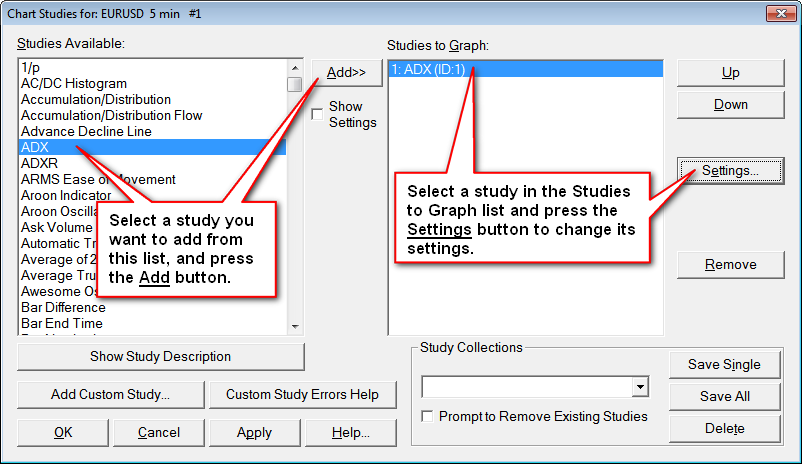
Studies: To display a study like Volume or a Moving Average or put another study on the chart: Select Analysis >> Studies on the menu. Search for Volume in list of Studies Available or whatever study you need. Click on the study name. Press the Add button. Press the Settings button to adjust study settings and Inputs such as the Length of a moving average, colors and draw styles. Press OK. Press OK again to close the Chart Studies window. Refer to the Chart Studies documentation page for complete instructions on using chart studies.
-
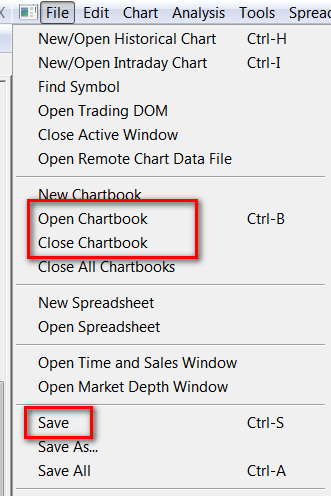
Chartbooks: Select File >> Save on the menu. Type a name in the Filename box for your Chartbook. All of the open charts are grouped into a Chartbook. Press the Save button to save the Chartbook.
Select File >> Close Chartbook on the menu to close all visible charts. Select File >> Open Chartbook on the menu, select the chartbook from the list and press Open to open your charts. Your saved chartbook will also be listed on the File menu for easy selection and opening. Refer to the Chartbooks documentation page for complete information on saving charts and how they are organized.
-
Drawing Tools: Sierra Chart provides a large set of professional Drawing Tools to draw various types of objects and lines on charts to perform analysis. To use a chart drawing tool, select Tools on the menu and select a tool from the menu. Refer to the Chart Drawing Tools documentation page for complete instructions for all of the available Tools and to learn about configuring tools.
-
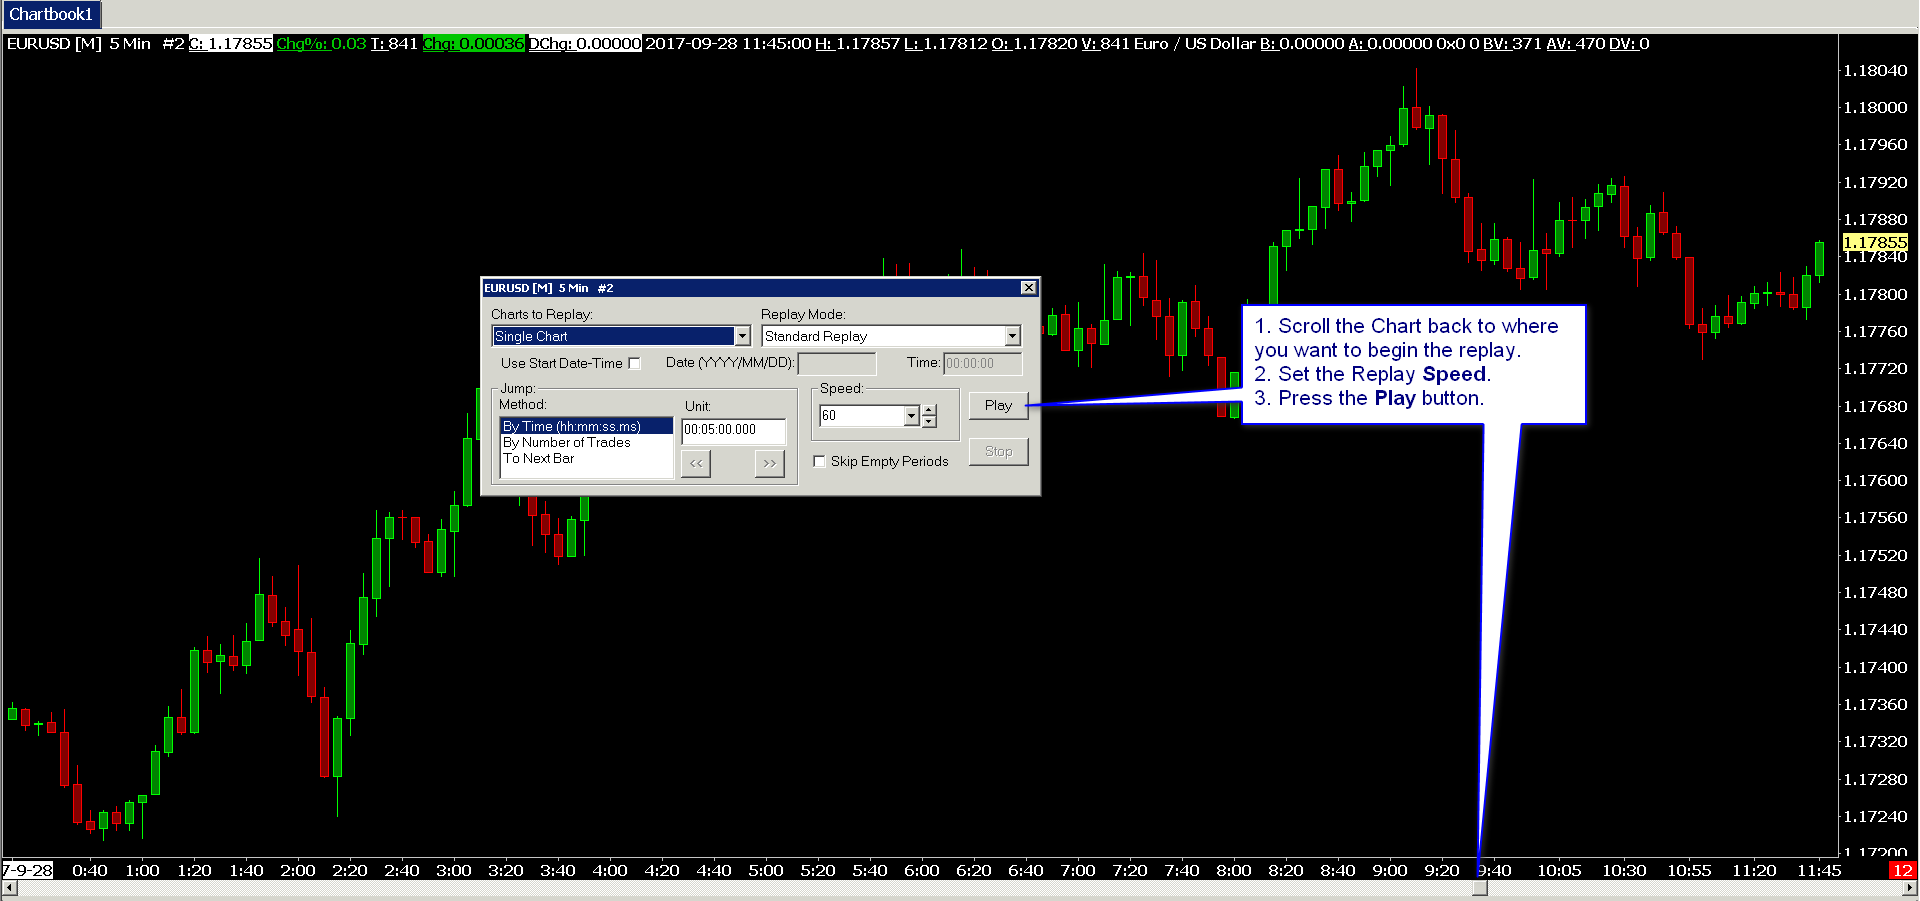
Chart Replay: To replay an Intraday chart, select Chart >> Replay on the menu. Scroll the chart back to where you want to begin the replay, and press Play on the Replay control panel window.
-
Chart Update Interval: Select Global Settings >> General Settings on the menu and select the General page. Set the Chart Update Interval to the rate at which you want your charts updated. Typically 500 to 800 milliseconds is reasonable.
Using a higher value will reduce CPU usage and the chart will update slower. Using a lower value will increase CPU usage and the chart will update faster. It is not recommended to use a setting less than 100 milliseconds.
Press OK when done. This setting does not affect the speed at which data is stored. It is stored tick by tick without any gaps.
The Chart Update Interval can also be set individually for each Chart/Trade DOM and can be set lower when you require faster updating. Refer to the chart specific Chart Update Interval setting.
Working with Sierra Chart Settings Windows
For information to work with the Sierra Chart Settings Windows, refer to Settings Window Interface.
Notes About Charts
- Data for each symbol is stored in its own file. The filename is the symbol itself plus a file extension. The file extension depends upon whether the data file is for a Historical Daily or an Intraday chart. These files are called Chart Data Files. Charts are created from these files.
- When you enter a new symbol in the File >> New/Open Historical/Intraday Chart window Filename box or the File >> Find Symbol window and press the Open button, a new file will be created and data will be downloaded for the symbol, if available.
- The same chart data file can be opened more than once. This is if you want to have charts with different configurations for the same symbol. You can open as many charts as you require at the same time. It is possible to select multiple existing chart data files in the File >> New/Open Historical or File >> Intraday Chart windows to open multiple charts at the same time. Simply press and hold the Control key on your keyboard and select the chart data files one by one with your pointer.
-
When you open a chart and are connected to the market data feed server, then data download status will be displayed directly on the chart window in the center. In the case of Intraday chart data, when the download is complete, then the real-time data will be written to the data file as trades occur and is accumulated in the file.
After 6 months you will have an additional 6 months of data on top of what was initially downloaded.
For instructions to access more historical Intraday data, refer to Downloading/Viewing More Historical Intraday Data.
In the case of Historical charts, all available data will be downloaded, up to 50 years. While connected to the market data feed, Historical charts are updated in real-time with the current prices.


Submitting An Order for Trading
To submit an order for trading, you first need to have a chart or a Trading DOM open for the symbol that you want to trade. For instructions, refer to Step 3 on this page.
All of the Trading functionality in Sierra Chart is accessed through the Trade menu and the various windows opened by the available commands on that menu. Trading from charts and Trade DOMs is performed through the trading interfaces on the chart or Trade DOM (which is a special type of chart), and the Trade Window.
Sierra Chart has a simulated trading mode where Orders and Positions are simulated. And a non-simulated trading mode where Orders are submitted to an external trading service. It is important to understand the difference between these two. Refer to Difference between Simulated and Non-Simulated Trading Modes. During a trial, you can only use the internal Simulation Mode or the Simulated Futures Trading Service. Connections to external trading services is not supported during a trial.
For information for all of the Trading functionality, including chart trading, refer to Overview of Trading.
Quick Order Entry: Go to an already open chart or Trade DOM window and select Trade >> Open Trade Window for Chart to open the Trade Window for the chart if it is not already open. Follow the instructions in Entering an Order from the Trade Window section to submit the order.
For a list of all of the Trading Related documentation pages, refer to the Trading section on the Table of Contents page.
Need More Help?
If you are having any kind of problem, refer to the Help and Frequently Asked Questions Page.
On-line Documentation
 At the top of every website page there is a menu that links to all of our main website pages.
This on-line documentation system is the complete up to date documentation for Sierra Chart.
Pressing F1 in Sierra Chart will display the documentation page associated with the active window.
Each page in this documentation is called a documentation page. Every page is listed on the Table of Contents page.
The website documentation is updated and improved almost daily. It is designed to be simple and complete.
The Sierra Chart Table of Contents page lists and categorizes every single page on this website including the documentation pages. This is for easy reference. You will notice how the website has a very simple and logical organization to it.
You will also notice at the top of every webpage, a series of links indicating where you are on the website. Using those links you can easily navigate back one level or to the Home page.
Notes
Stocks, bonds, futures, options, market indices, statistics, mutual funds, are referred to as symbols in Sierra Chart.
A symbol is a symbolic representation of one of these types of securities/markets/indexes/statistics/instruments. A symbol is used for charts, trading windows, and quote lines on a Quote Board.
The time shown on the title bar of the main Sierra Chart window is based upon your computer's clock and adjusted to the Global Settings >> Data/Trade Service Settings >> Time Zone setting you have specified in Sierra Chart.
This documentation uses the word Pointer to refer to the human interface pointing device on your computer. This could be a tablet, touchpad, mouse, or touchscreen.
A list of Sierra Chart words and definitions can be found on the Sierra Chart Nomenclature page.
Alternative Method of Opening Charts
Historical Charts
Historical charts have a bar period of 1 Day and greater. They can also be Weekly, Monthly, Quarterly and Yearly charts. A Historical chart with a period per bar of 1 Day, is called a Historical Daily chart. The underlying data in the data file are daily data records containing data for a single day.
Select File >> New/Open Historical Chart on the menu to create or open a Historical Daily / Weekly / Monthly / Quarterly / Yearly chart. The default file extension for Historical Daily data files is dly.
In the New/Open File window, type a new or existing symbol in the File Name box or select one from the list of files, then press the Open button.
When manually typing a symbol in the File Name box, there is no need to enter the file extension.
Refer to the image above. The symbol needs to follow the format required by the Data or Trading service you are using.
For symbol lists and formats, use the File >> Find Symbol window.
Intraday Charts
Intraday charts can have any bar period. Usually the bar period is less than 1 day and are based on a fixed time frame down to 1 second or Number of Trades, Volume, Range, Reversal, Renko, Delta Volume, Price Change, Point and Figure Bars.
Although you can specify a period per bar of 1 Day or greater with Intraday chart data types, it is usually not practical to create long-term Historical charts from Intraday data with a 1 Day or greater bar period because they will take a longer time to load and usually do not go back far in time.
Select File >> New/Open Intraday Chart on the menu to create or open an Intraday chart. The default file extension for Intraday chart data files is scid.
In the New/Open File window, type a new or existing symbol in the File Name box or select one from the list of files, then press the Open button.
When manually typing a symbol in the File Name box, there is no need to enter the file extension.
Refer to the image above. The symbol needs to follow the format required by the Data or Trading service you are using.
For symbol lists and formats, use the File >> Find Symbol window.
*Last modified Wednesday, 17th July, 2024.