Data/Trade Service Settings
- Introduction
- Service Specific Settings
- Changing Data/Trade Service Specific Settings
- Main Settings
- Common Settings
- Reducing the Maximum Historical Intraday Days to Download >> 1-Tick Data Setting
- Saving and Loading Service Settings
- Bandwidth Usage
Introduction
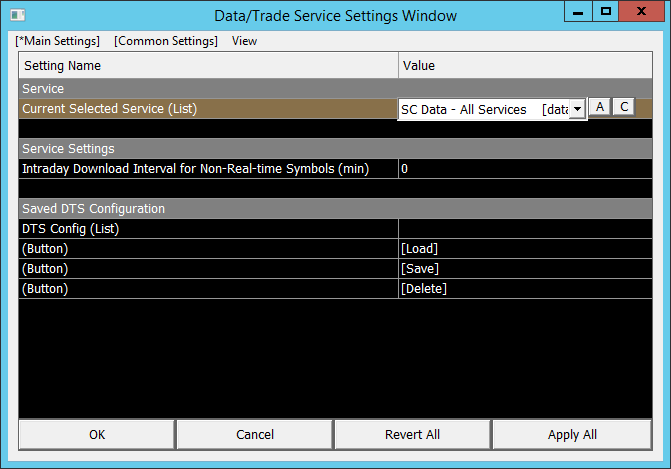
The Data/Trade Service Settings window is for viewing and specifying settings for Sierra Chart to work with Data and Trading services.
The Data/Trade Service Settings window also contains various settings related to connectivity and the processing of market data.
Press OK to save the settings or Cancel to not save them.
Service Specific Settings
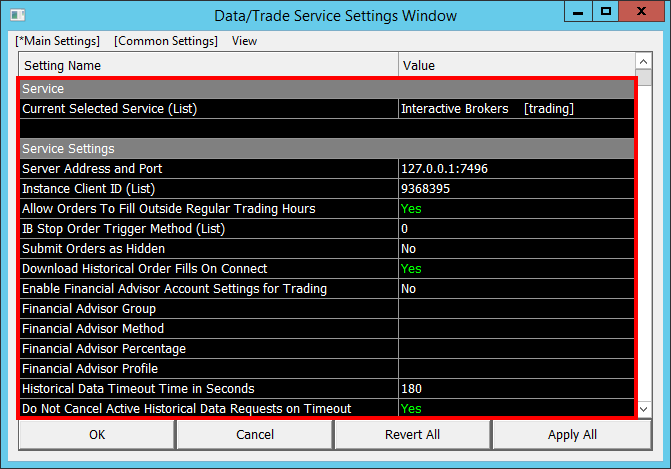
The image below shows the Data or Trading Service specific settings on the Data/Trade Service Settings window.
The Service specific settings change depending upon what Service is selected on this window.
For descriptions of the Service specific settings, refer to the Data and Trading Services page for links to pages for the service you are using.
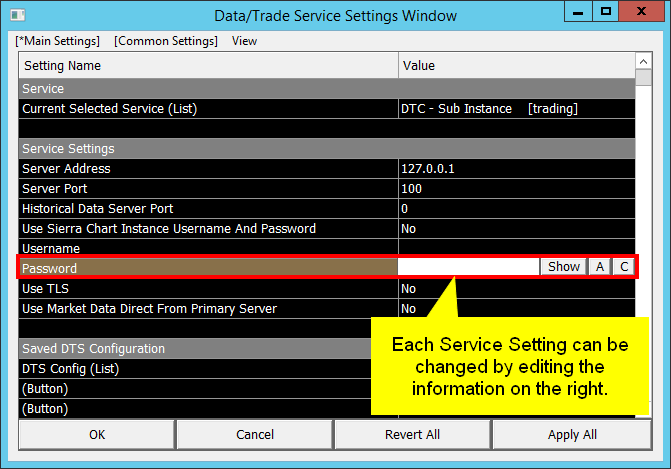
Each page for a specific Data or Trading Service contains the instructions for setting the Service specific controls.
The Service specific settings controls are not documented on this page.
You will need to consult the corresponding Data or Trading service page for the service, for the specific set up instructions for that service.
Changing Data/Trade Service Specific Settings
For information on how to work with the various fields on the Data/Trade Service Settings window, refer to the information on the Settings Windows Interface.
Main Settings (Global Settings >> Data/Trade Service Settings)
Service (Global Settings >> Data/Trade Service Settings >> Main Settings)
This sub-section contains settings for defining the data/trading service used by Sierra Chart
Current Selected Service (Global Settings >> Data/Trade Service Settings >> Main Settings >> Service)
This control displays and sets the Data and/or Trading service you want to use Sierra Chart with.
If the selected service supports market data only and not live trading it will have a [data] suffix.
If the selected service supports market data and live trading functionality it will have a [trading] suffix.
For instructions to use this setting, refer to Item List (Working with Sierra Chart Windows >> Selection Specific Options).
To connect to the data feed, select File >> Connect to Data Feed. If Sierra Chart is already connected to the data feed, then after changing the Current Selected Service, there will be an automatic reconnection to the data feed.
Service Settings (Global Settings >> Data/Trade Service Settings >> Main Settings)
The settings in this sub-section vary depending on the value selected for the Current Selected Service. For information on specific service settings, refer to the Setup Instructions for the specific service.
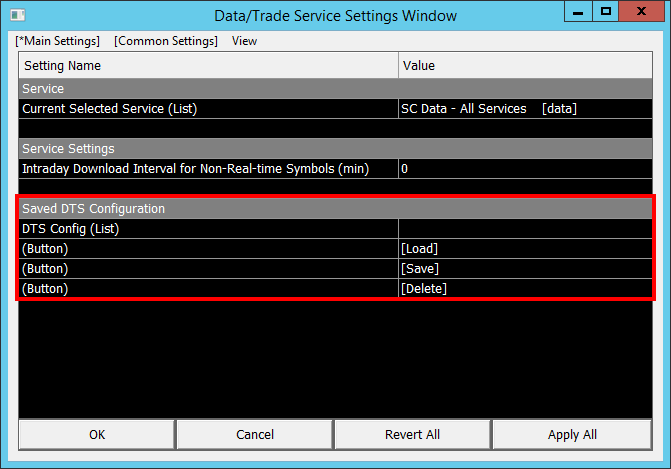
Saved DTS Configuration (Global Settings >> Data/Trade Service Settings >> Main Settings)
The settings in this sub-section apply towards loading and saving different Data/Trade Service Settings as stored configurations.
DTS Config (Global Settings >> Data/Trade Service Settings >> Main Settings >> Saved DTS Configuration)
This contains the list of available configurations that can be selected. Entering a new name in this field allows for the current configuration to be stored under that name.
[Load] (Global Settings >> Data/Trade Service Settings >> Main Settings >> Saved DTS Configuration)
Selecting the [Load] button will load the selected configuration in the DTS Config field.
[Save] (Global Settings >> Data/Trade Service Settings >> Main Settings >> Saved DTS Configuration)
Selecting the [Save] button will save the current configuration in the name that is entered in the DTS Config field.
[Delete] (Global Settings >> Data/Trade Service Settings >> Main Settings >> Saved DTS Configuration)
Selecting the [Delete] button will delete the current configuration that is selected in the DTS Config field.
Common Settings
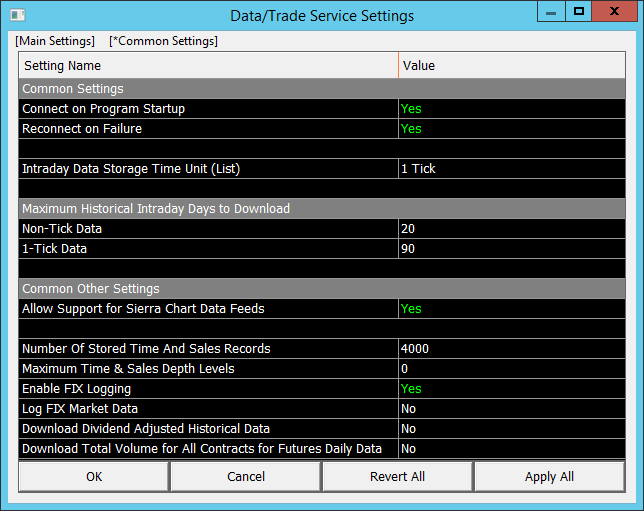
Common Settings (Global Settings >> Data/Trade Service Settings >> Common Settings)
This sub-section contains data/trade service settings that apply to all services.
Connect on Program Startup (Global Settings >> Data/Trade Service Settings >> Common Settings >> Common Settings)
If this option is set to Yes, then Sierra Chart will connect to the Data and Trade servers when you start Sierra Chart.
Otherwise, when Sierra Chart is started, no connection will be made to the Data and Trade servers.
Reconnect on Failure (Global Settings >> Data/Trade Service Settings >> Common Settings >> Common Settings)
When this option is set to Yes, then Sierra Chart will reconnect to the Data and Trade servers when the connection is detected to be lost or it will retry to connect to the servers if it could not connect initially.
It is recommended to keep this option enabled in most cases.
Also, when this option is enabled, and when using one of the Real-Time Exchange Data Feeds Available from Sierra Chart with a supported Trading service, then when the connection to the Trading server is lost, the data feed will continue to be received from the Data Feed which comes from a different server.
Intraday Data Storage Time Unit (Global Settings >> Data/Trade Service Settings >> Common Settings >> Common Settings)
This sets the time period for each record of data in an Intraday chart data file which is used to build the chart bars in Intraday charts. These files have a .scid file extension.
Setting this to 1 Tick means there will be one data record for each tick/trade. It is necessary to use 1 Tick when you are using a Bar Period Type in an Intraday chart based upon a Number of Trades, Volume, Range, Reversal, Renko, Delta Volume, or Price Changes amount, for 100% accuracy.
Although even with these Intraday chart Bar Period Types, you may want to use 1 Second as an alternative since it is more CPU efficient. This is less accurate but still may work sufficiently. 1 Tick will provide 100% accuracy for these Bar Period Types. However, it will use more disk space, cause slower Chartbook loading, and slower historical data downloading.
If you are only using chart bars that are based upon a fixed amount of time, like based upon a specific amount of minutes, then you can use an Intraday Storage Time Unit setting that divides evenly with no remainder into the shortest bar time frames you will be working with. For example, 30 seconds divides evenly into 1 minute with no remainder.
Intraday data files do use compression. However, there will be an increase in disk space usage with smaller Intraday Data Storage Time Units. Using 1 Minute will save disk space and provide maximum performance.
If you do not use chart bar periods less than 1 minute, then use a setting of 10 Seconds or higher.
The Intraday Data Storage Time Unit setting affects data collected in real-time and the historical Intraday data downloaded unless the Data/Trading service you are using only provides historical data in 1 Minute units.
All Ticks/Trades received from the data feed are stored, independent of whatever this setting is. No data is missed by using a setting of 1 Minute. Your charts will still update at the same speed. This setting is also independent of the Chart Update Interval in General Settings.
When using a setting of 1 Tick, any Intraday Bar Period Type and bar duration can be used and will be accurate, including bar periods of Days. The same is true with higher settings, but the accuracy becomes less with the following Bar Period Types: Number of Trades, Volume, Range, Reversal, Renko, Delta Volume, or Price Changes. Also, when using for example a setting of 10 Seconds, then it is not possible to create 1 second chart bars.
The Intraday Data Storage Time Unit setting has no effect on Market Depth data or Time and Sales data.
It is completely unnecessary to reconnect to the data feed, after changing the Intraday Data Storage Time Unit.
Anytime this setting is changed, in order to apply it to existing historical data in the charts, go to an Intraday chart for each symbol and select Edit >> Delete All Data and Download. This only needs to be done once for each symbol. Refer to the Deleting and Downloading Intraday Data for All Charts documentation for instructions to re-download data for multiple symbols at once.
The Numbers Bars study supports automatically changing the Intraday Data Storage Time Unit to 1 Tick. This will occur when the Require 1 Tick Intraday Data Storage Time Input is set to Yes.
Maximum Historical Intraday Days to Download (Global Settings >> Data/Trade Service Settings >> Common Settings)
This sub-section contains settings to control the maximum number of days of historical Intraday data that will be downloaded from the remote historical data server when historical Intraday data is downloaded for a symbol.
There are separate settings for Non-Tick Data and 1-Tick Data. Non-Tick data is Intraday data downloaded from the data server which has a timeframe greater than 1 tick/trade. 1-Tick Data is Intraday data downloaded from the data server which is tick by tick. Each tick is 1 trade in this case.
In the case of when the Data/Trading service supports both historical Minute data and Tick data, then there are two separate downloads performed. One for Minute data which uses the Non-Tick Data setting, and one for 1 Tick data which uses the 1-Tick Data setting. This is only true in the case of IQ Feed.
The amount of Historical Intraday data that will actually be downloaded for a symbol depends upon the last Date-Time in the Intraday data file. If the file is empty and is therefore a new Intraday data file, then the Maximum Historical Intraday Days to Download settings will exactly control the number of days downloaded, assuming the server has the same amount of data available. If this setting is set to 90, but the file was only missing 1 day of data from the last Date-Time in the file to the present time, then only 1 day of data will be downloaded.
When you increase this setting, then this will not automatically cause more data to be inserted into existing Intraday data files. You will need to go to an Intraday chart for the symbol you want to get more data for and then select Edit >> Delete All Data and Download on the menu. You only need to do this once per symbol.
Likewise, when Maximum Historical Intraday Days to Download is reduced, to actually reduce the data in an Intraday chart data file you also need to go to the Intraday chart for the symbol and re-download the data with Edit >> Delete All Data and Download.
The Chart >> Chart Settings of an individual chart do not have any effect upon the historical Intraday data which is downloaded.
Although the only exception to this, is when using the Continuous Contract option in a chart. In this case the number of days of historical data downloaded for historical futures contract symbols is *not* going to follow the Maximum Historical Intraday Days to Download and instead the required data is downloaded.
Non-Tick Data (Global Settings >> Data/Trade Service Settings >> Common Settings >> Maximum Historical Intraday Days to Download)
This setting applies when the Intraday Data Storage Time Unit is set to 1 Tick.
This controls the number of days of Non-Tick data that is downloaded when there is a need to download new data as specified above.
If this value is higher than the number of days available on the server, then only the number of days of Intraday data on the server will be downloaded.
1-Tick Data (Global Settings >> Data/Trade Service Settings >> Common Settings >> Maximum Historical Intraday Days to Download)
This setting applies when the Intraday Data Storage Time Unit is set to a setting greater than 1 Tick.
This controls the number of days of 1-Tick data that is downloaded when there is a need to download new data as specified above.
If this value is higher than the number of days available on the server, then only the number of days of Intraday data on the server will be downloaded.
Formula Symbols (Global Settings >> Data/Trade Service Settings >> Common Settings >> Maximum Historical Intraday Days to Download)
This setting applies when the symbol is a Custom Calculated Symbol.
This controls the number of days of data that is downloaded when there is a need to download new data as specified above.
If this value is higher than the number of days available on the server for at least one of the symbols, then only the number of days of Intraday data on the server will be downloaded.
Common Other Settings (Global Settings >> Data/Trade Service Settings >> Common Settings)
This sub-section contains other settings that are common to all data/trade services.
Allow Support for Sierra Chart Data Feeds (Global Settings >> Data/Trade Service Settings >> Common Settings >> Common Other Settings)
Left click where it says Yes or No to change the state between Yes and No. Press OK after changing the setting to save.
The Allow Support for Sierra Chart Data Feeds option only applies if you have activated one of the Real-Time Exchange Data Feeds Available from Sierra Chart on your Sierra Chart account.
To use one of the Sierra Chart data feeds in a copy of Sierra Chart you have installed, this option must be set to Yes. To not use one of the Sierra Chart data feeds and instead to use your Trading service provided data feed, then this option must be set to No.
When the Current Selected Service setting on the Data/Trade Service Settings window is set to SC Data - All Services and Common Settings >> Allow Support for Sierra Chart Data Feeds is disabled, then it means delayed streaming data will be provided by the Delayed Exchange Data Feed for the symbols provided by that data feed. Delayed streaming data will also be provided by the Delayed Exchange Data Feed for the symbols that it provides if not subscribed to real-time data for those symbols regardless of how Allow Support for Sierra Chart Data Feedsis set.
After enabling or disabling this option, it is necessary to reconnect to the data feed with File >> Disconnect and File >> Connect to Data Feed.
You will know that one of the real-time Sierra Chart Exchange Data Feeds is being used for the symbol when you see an [M] indicator after the Symbol on the top line of the chart or Trade DOM. Refer to the image below.
When using a sub-instance of Sierra Chart through File >> New Instance, you will not see the [M] indicator. However, the real-time data feeds from Sierra Chart are still being used for the symbol as long as you do see the [M] indicator for the same symbol in the main instance of Sierra Chart.
Number of Stored Time and Sales Records (Global Settings >> Data/Trade Service Settings >> Common Settings >> Common Other Settings)
This setting controls how many Time and Sales records Sierra Chart will maintain in memory during a Sierra Chart session. Each Time and Sales record is equivalent to one trade or one Bid/Ask quote update. The Number of Stored Records applies for each symbol being tracked.
Using a high Records setting could potentially take a considerable amount of memory. It is recommended to maintain about 5000 Records. If you use 100000, for example, that is going to consume a lot of memory!
The Number of Stored Time and Sales Records is completely separate from charting. It is only used for the Time and Sales window, the Time and Sales studies, to fill Simulated orders and manage trailing stop orders and certain other types of managed orders, and for other specialized purposes which rely on Time and Sales data. Studies like the Volume by Price study do not rely on this data.
Changes to this setting do not go into effect until the next reconnection to the data feed. To do this, refer to Reconnecting to Data Feed.
Maximum Time and Sales Depth Levels (Global Settings >> Data/Trade Service Settings >> Common Settings >> Common Other Settings)
The Maximum Time and Sales Depth Levels setting controls how many market depth levels are included when the total Bid depth quantities and the total Ask depth quantities are calculated and included with the Time and Sales data.
With Time and Sales Bid and Ask records, the total of the Bid quantities and the total of the Ask quantities in the market depth data are added together and included in the Total Bid Sizes and Total Ask Sizes fields.
If this is set to 0 all of the market depth levels are added together to calculate the total. Otherwise, the specified number of levels are only added.
Enable FIX Logging (Global Settings >> Data/Trade Service Settings >> Common Settings >> Common Other Settings)
Sierra Chart uses FIX connections to various supported Trading services.
When this option is enabled, a log file is maintained for the FIX connection which contains the sent and received messages. Heartbeat messages, market data full refresh and market data incremental refresh messages are not saved because those use too much space.
The advantage of logging messages is that if there is ever a problem with trading, this log file provides additional data about the messages exchanged.
The log files are saved in the Logs subfolder in the folder Sierra Chart is installed to.
This option does not apply to Trading services that do not use the FIX protocol. It does not apply to DTC Protocol connections.
If you need to provide a FIX log to Sierra Chart support, then refer to Providing FIX Log to Support.
Log FIX Market Data (Global Settings >> Data/Trade Service Settings >> Common Settings >> Common Other Settings)
When this option is enabled, for data services which provide FIX based market data, the FIX market data messages will be added to the Window >> Message Log.
Process Known Odd Lot Equity Trades for DTC Services (Global Settings >> Data/Trade Service Settings >> Common Settings >> Common Other Settings)
When Process Known Odd Lot Equity Trades for DTC Services is set to Yes, then Odd Lot equity trades from the Denali Exchange Data Feed for US Equities will be processed both in the streaming data feed and during historical Intraday data downloads. Otherwise, Odd Lots will be completely filtered out.
When this is set to Yes, this will cause the price of Odd Lot trades to be displayed in the following places: Time and Sales Window. The last trade price box on the right side of the chart. The Daily High and Low values in the Current Quote Window. The Daily High and Low values affect the last bar in a Historical Daily Chart.
After changing the Process Known Odd Lot Equity Trades for DTC Services setting, reconnect to the data feed with File >> Reconnect. And reload the Historical Daily charts with Edit >> Reload Historical Charts.
In the case when Odd Lots are included in historical Intraday data, they are by default not displayed in Intraday charts. To display them in Intraday charts enable the Include Odd Lot Equity Trades Chart Setting.
After setting Process Known Odd Lot Equity Trades for DTC Services to Yes when it previously was No, to then see Odd Lot trades in Intraday charts it is necessary to re-download the Intraday data in the chart by going to the chart and selecting Edit >> Delete All Data and Download and setting the Include Odd Lot Equity Trades setting to Yes in the chart.
The problem with Odd Lot trades is that they can and often will be out of range causing what looks like an incorrect Daily High and Low for the day. They also cause price "spikes" in Intraday charts. Therefore, they are not necessarily good to include.
It is recommended that this option be set to No/disabled.
Historical Daily Data (Global Settings >> Data/Trade Service Settings >> Common Settings)
Historical Daily Data Download Time (Global Settings >> Data/Trade Service Settings >> Common Settings >> Historical Daily Data)
This is the time, in the Historical Daily Data Daily Download Time Time Zone, that Historical Daily data will be downloaded at each day. This is for all symbols other than US Equities (stocks) symbols which has its own download time (Historical Daily Equities Data Download Time).
Historical Daily Equities Data Download Time (Global Settings >> Data/Trade Service Settings >> Common Settings >> Historical Daily Data)
This is the time, in the Historical Daily Data Daily Download Time Time Zone, that Historical Daily data will be downloaded at each day. This particular setting is only for US Equities (stocks) symbols.
Historical Daily Data Daily Download Time Time Zone (List) (Global Settings >> Data/Trade Service Settings >> Common Settings >> Historical Daily Data)
This is the time zone that applies to the Historical Daily Data Download Time and theHistorical Daily Equities Data Download Time settings.
Download Dividend Adjusted Historical Data (Global Settings >> Data/Trade Service Settings >> Common Settings >> Historical Daily Data)
This setting is no longer applicable and has no effect.
When this option is set to Yes, then the Historical Daily stock data downloaded will be adjusted for stock dividends. Otherwise, if it is unchecked the data will not be adjusted. This only applies to the Sierra Chart Historical Data service.
After changing this setting, it is necessary to re-download the data in the Historical Daily charts by selecting Edit >> Delete All Data and Download for the data in the chart to be updated. This only needs to be done once per symbol and not per chart if the symbol is the same on the charts.
Download Total Volume for All Contracts for Futures Daily Data (Global Settings >> Data/Trade Service Settings >> Common Settings >> Historical Daily Data)
When this option is set to Yes, then when historical daily futures data is downloaded for a particular symbol, the Volume and Open Interest for that symbol will be for all contract months for that particular futures root symbol, which are in existence.
When this option is set to No (recommended), then when historical daily futures data is downloaded for a particular symbol, the Volume and Open Interest for that symbol will be for that particular symbol contract month and year only.
When using Continuous Futures Contract charts, it is imperative that Download Total Volume for All Contracts for Futures Daily Data be set to No.
After changing this setting, to update the Volume and Open interest in a Historical Daily chart, requires that you re-download the data with Edit >> Delete All Data and Download. This needs to be done only once per symbol.
Maximum Historical Days to Download for Daily Data (Global Settings >> Data/Trade Service Settings >> Common Settings >> Historical Daily Data)
This option specifies the maximum number of days to download when downloading historical daily data. The default is 18250 which is about 50 years. This is the recommended setting.
Only change this if you really need to and have a good reason.
This number of days is only going to be attempted to be downloaded, when there is no existing Historical Daily data for a symbol. Or when you use Edit >> Delete All Data and Download.
Reducing the Maximum Historical Intraday Days to Download >> 1-Tick Data Setting
When using some Data and Trading services (like IQ Feed), it can be slow to download 1 Tick data due to how those services work. Follow the instructions below to reduce the Maximum Historical Intraday Days to Download >> 1-Tick Data setting in order to increase the speed of historical Intraday data downloading.
- Select Global Settings >> Data/Trade Service Settings.
- Select the Common Settings tab.
- Set the Maximum Historical Intraday Days to Download >> 1-Tick Data to 31 or lower.
- If Sierra Chart is currently connected to the data feed, and you want to cancel the existing historical Intraday data downloads and use this new lower setting, then select File >> Disconnect. After this, select File >> Connect to Data Feed.
Saving and Loading Service Settings
The Data and Trading Service Specific Settings on the Data/Trade Service Settings window, can be saved and restored at a later time.
Only the Service specific settings can be saved and loaded. Not the common settings.
This is useful if you have different sets of settings for the same Data or Trading service and you need to switch between them.
The settings for different Data and Trading services are already stored separately by Sierra Chart.
Below are the descriptions of the available commands for this feature and explanations of how to use them.
- Main Settings >> Saved DTS Configuration >> [Load]: This button is used to load a saved set of settings into the service specific settings controls. It is first necessary to select an existing configuration from the DTS Config list box before pressing this button. Refer to the image below. When loading existing settings, the Service setting will be changed to the service that the settings are for.
After you Load the new settings for the same Service that Sierra Chart is already connected to and press OK, it is the necessary to reconnect to the data feed to use the new settings. - Main Settings >> Saved DTS Configuration >> [Save]: This button is used to save the service specific settings. It is first necessary to type in a name in the DTS Config box or select the name from the list that you want to save the settings as.
- Main Settings >> Saved DTS Configuration >> [Delete]: This button is used to delete previously saved settings. It is first necessary to select the name of the previously saved settings in the DTS Config list box.
Bandwidth Usage
Occasionally we are asked about the bandwidth usage of Sierra Chart. This would be the number of bits/bytes per second on average Sierra Chart would use for received data.
It is impossible for us to answer this question with any degree of accuracy. The reasons for this are as follows:
- We do not know the bandwidth usage of the particular Data or Trading service you are using and the bandwidth usage of those services.
- We do not know how many symbols you are tracking.
- We do not know the market activity of those symbols.
- The amount of bandwidth usage is also affected by the amount of historical data being downloaded. Although historical data downloading is relatively infrequent.
You are able to monitor the bandwidth usage of an individual process running within Windows. From within Windows you can access this through Windows Task Manager >> Performance >> Resource Monitor. For further information, consult with the documentation for the Resource Monitor.
You can also see how much data over a period of time Sierra Chart is receiving for streaming data on the current connection. This is shown on the Status Bar and is supported with many of the supported Data/Trading Services.
*Last modified Monday, 23rd June, 2025.

