File Menu
- New/Open Historical Chart (File)
- New/Open Intraday Chart (File)
- Find Symbol (File)
- Open Trading DOM for Chart (File)
- Open Trading DOM (File)
- Close Active Window (File)
- New Chartbook (File)
- Open Chartbook (File)
- Open Chartbook Group (File)
- Close Chartbook (File)
- Close All Chartbooks (File)
- New Spreadsheet (File)
- New Quote Spreadsheet (File)
- Open Spreadsheet (File)
- New Quote Board (File)
- Open Time And Sales Window (File)
- Open Market Depth Window (File)
- Save (File)
- Save As (File)
- Save All (File)
- Data/Trade Service Settings (File)
- Connect To Data Feed (File)
- Disconnect (File)
- New Instance (File)
- Open Study Summary Window (File)
- Print (File)
- Most Recently Used Files (File)
- Clear Recent File List (File)
- Send File To User (File)
- Exit (File)
New/Open Historical Chart (File)
Displays the Open File window. Historical Daily chart data files will be listed. To open a chart data file to create a Historical chart from it, select a file in the list and press Open. To create a new Historical chart for a symbol you do not have, type the symbol into the Filename box and press the Open button.
Multiple existing Historical Daily data files can be selected in the file list. When you press the Open button, Historical charts will be created for all of the selected symbols.
Historical charts are for Daily, Weekly, Monthly, Quarterly, Yearly bar charts and for charts that have a chart bar timeframe consisting of the specified number of Days.
It is supported to open charts for multiple symbols that you do not already have data files for. In the Filename box, enter the symbols using this format: "[symbol]" "[symbol]" and continue with remaining symbols. There can be any number of symbols specified in a line this way. Example: "AB" "ABC". There is a single space between the symbols.
When you open a new chart in Sierra Chart, its initial size and position is controlled by the operating system.
New/Open Intraday Chart (File)
Displays the Open File window. Intraday chart data files will be listed. To open a chart data file to create an Intraday chart from it, select a file in the list and press Open. To create a new Intraday chart for a symbol you do not have, type the symbol into the Filename box and press the Open button.
Multiple existing Intraday data files can be selected in the file list. When you press the Open button, Intraday charts will be created for all of the selected symbols.
Intraday charts have a chart bar timeframe of any time timeframe. Usually 1 day or less. These are also used with Tick, Volume, Range, Reversal and Renko Bar Period Types.
It is supported to open charts for multiple symbols at once that you do not already have data files for. In the Filename box, enter the symbols using this format: "[symbol]" "[symbol]" and continue with remaining symbols. There can be any number of symbols specified in a line this way. Example: "AB" "ABC". There is a single space between the symbols.
When you open a new chart in Sierra Chart, its initial size and position is controlled by the operating system.
Find Symbol (File)
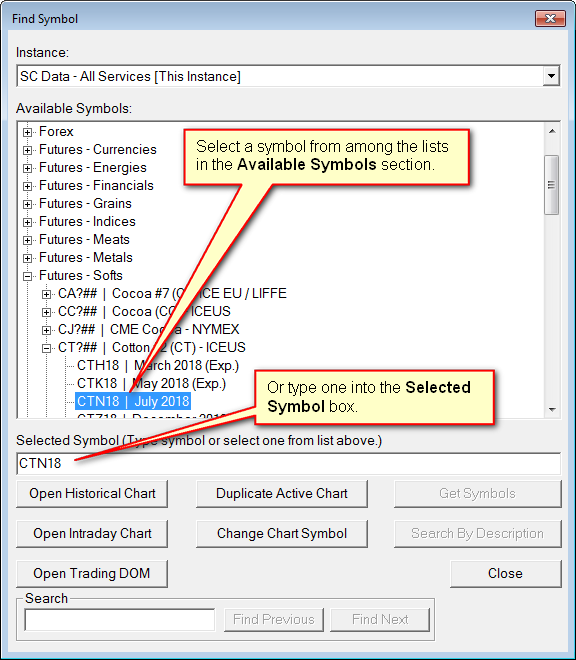
This command is for opening a Historical chart, an Intraday chart, or a Trading DOM, from a list of available symbols for the selected Data or Trading service.
This command will display a window that lists the available symbols for the currently selected Data or Trading service. Choose the symbol from the list and press the appropriate button (Open Historical Chart, Open Intraday Chart, Open Trading DOM).
If you do not see the symbol in the list, then manually type it in to the Selected Symbol box on the Find Symbol window.
Stock symbols will not be listed, so you have to manually type those into the Selected Symbol box unless you are using the Sierra Chart Real-Time Exchange Data Feed in which case you can search for them by selecting the Stocks >> (Enter Search Text - [exchange]) item. For further details, refer to Searching for Symbols.
Symbols can also be added to the symbol list in the Find Symbol window by adding the symbol to the Global Symbol Settings.
Opening a New Chart that uses the Same Settings as the Active Chart
- Select a particular already open chart that you want to use the same settings as for the new chart.
- Select File >> Find Symbol.
- In the lists of available symbols, find and select a particular symbol you want to open a chart for.
- Press the Duplicate Active Chart button.
Searching for Symbols
Searching for Stock Symbols
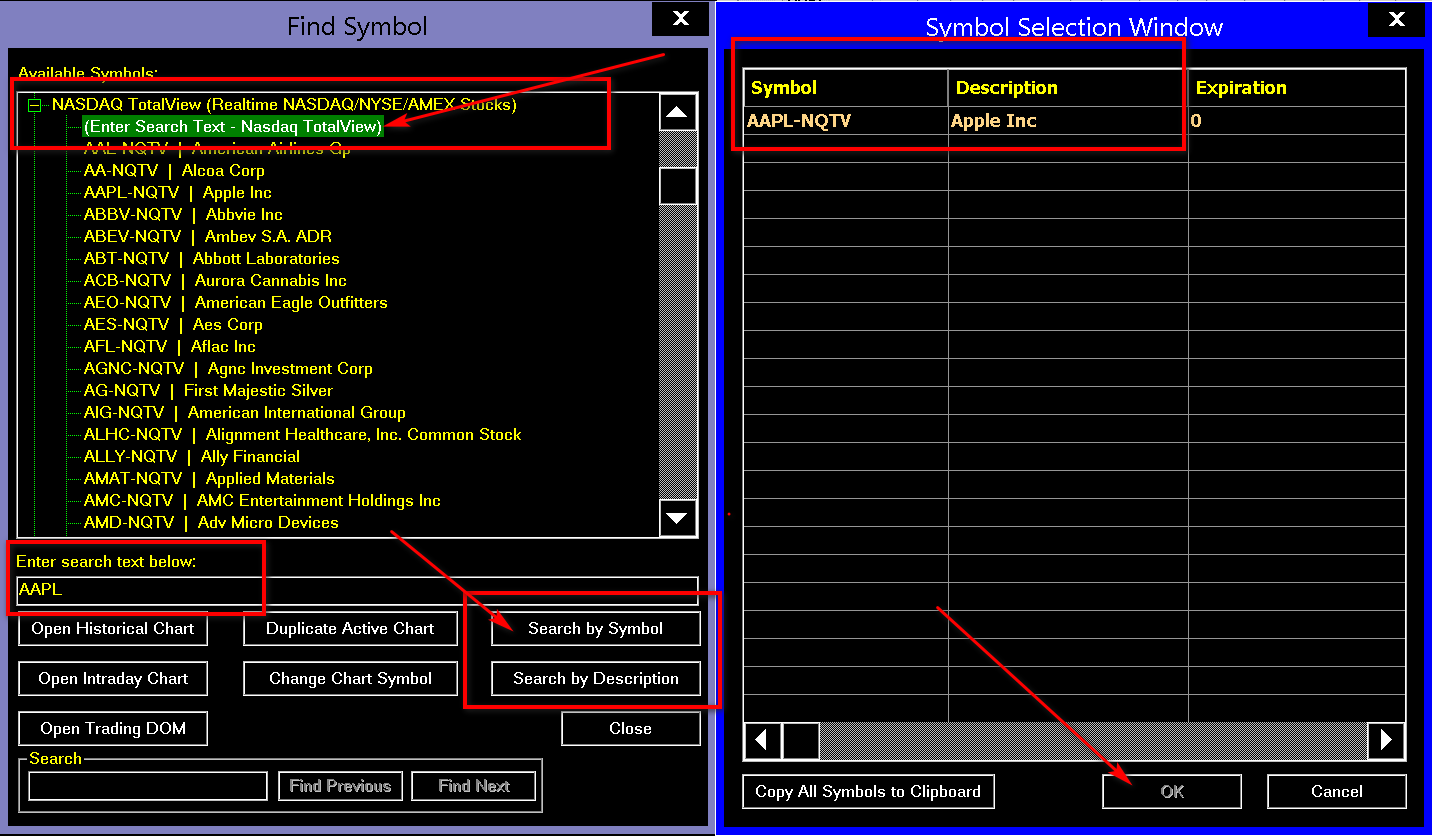
When using the Denali Exchange Data Feed or the Delayed Exchange Data Feed there is support for searching for stock symbols.
- Select File >> Find Symbol.
- In the list of symbols select one of the following:
- NASDAQ TotalView (Realtime NASDAQ/NYSE/AMEX Stocks) >> (Enter Search Text - Nasdaq TotalView)
- US Equities - Consolidated Tape >> (Enter Search Text - NYSE/AMEX/NASDAQ)
- US Equities - Consolidated Tape with Depth >> (Enter Search Text - NYSE/AMEX/NASDAQ with Depth)
- In the edit box titled Enter search text below:, enter the symbol or description you want to search for. Partial text is sufficient.
Preferred stocks are supported with the Denali Exchange Data Feed US Equities data. To search for preferred stocks, enter the main stock symbol. For example, BAC and then press the Search by Symbol button. All of the preferred stocks will then be listed. For example, one of the Bank of America preferred stocks symbols is: BACpB. - Press the Search by Symbol or Search by Description buttons depending upon whether you want to search by symbol or description.
- A Symbol Selection window will display with all of the results.
- Left click on the symbol in the list that you want.
- Press OK.
Searching for Futures Spreads Symbols
To search for futures spreads symbols, refer to Exchange Traded Spreads.
Searching for Available Symbols
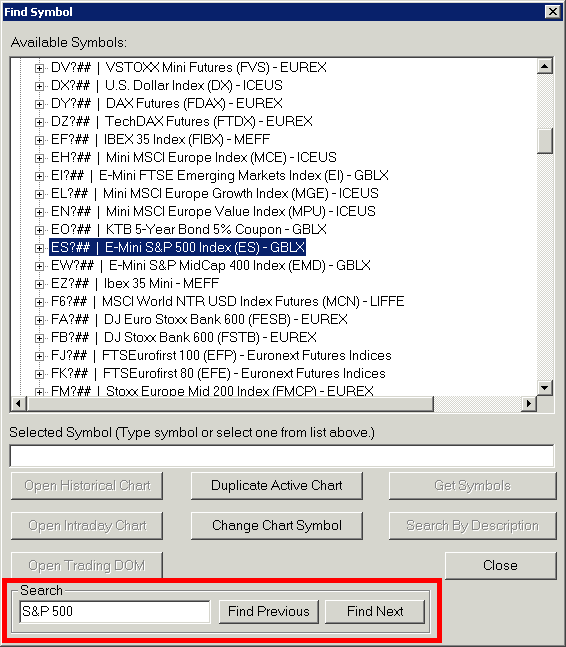
In order to search through the listed symbols on the Find Symbol page to find a particular symbol, use the following instructions:
- Select File >> Find Symbol.
- In the box titled Search, enter the text you want to search for.
- Press the Find Next or Find Previous to search forward through the list or backward through the list (respectively).
- When a match to the entered text is found, it will be highlighted in the Available Symbols section of the Find Symbol window. Select Find Next or Find Previous to continue searching for the next/previous match if needed.
- Once the desired symbol is found, select the appropriate button to open the symbol as desired.
Getting Symbols
Some Data/Trading services Sierra Chart supports, require that you first get the symbols before they will be listed in the File >> Find Symbol window.
Follow the below instructions for this.
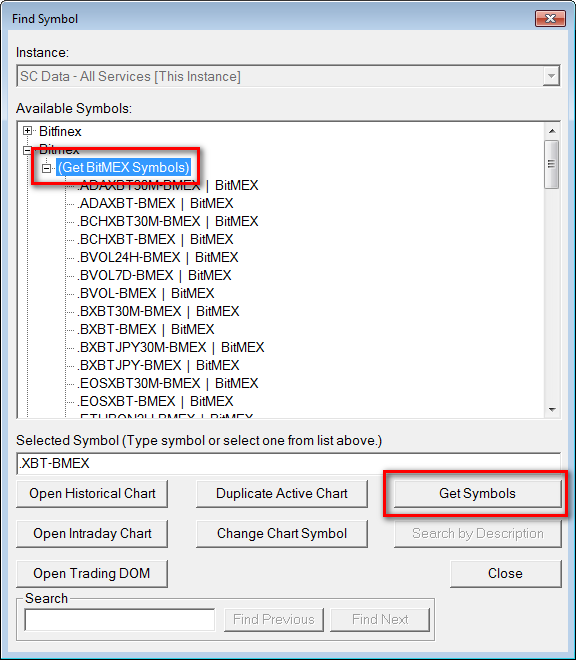
- Select File >> Find Symbol.
- Select a particular symbols category that you want from the list. Expand that category list.
- You will see an exchange item in parentheses like the following:
- (Get All CBOE Global Indexes Symbols)
- (Get BitMEX Symbols)
- (Get Binance Symbols)
- (Get Bitfinex Symbols)
- (Get Deribit Symbols)
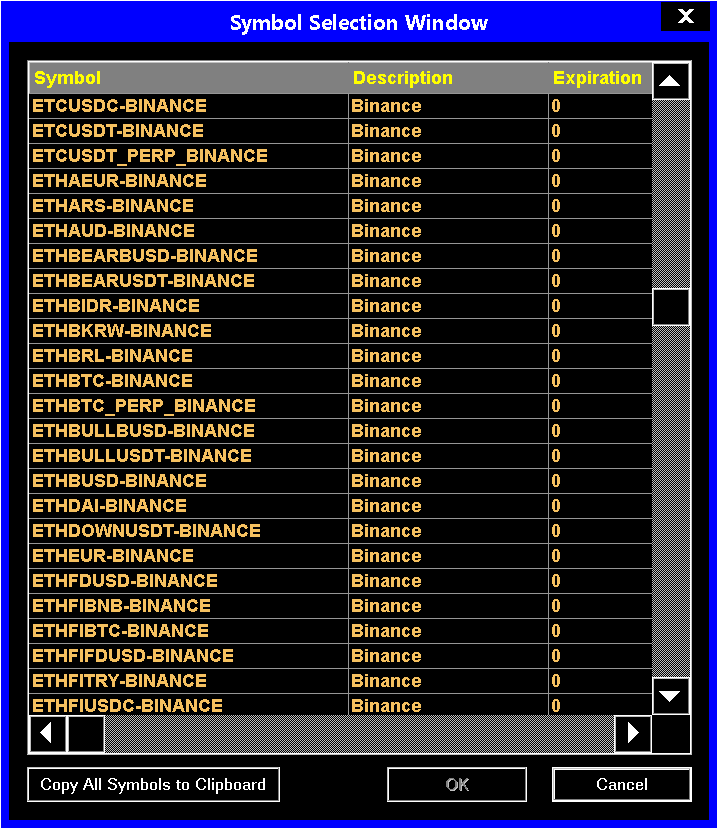
- Press the Get Symbols button. Within about 2 to 30 seconds, the symbols will be listed in a new window titled Symbol Selection Window. The amount of time for this window to open depends upon how long it takes for the symbols to be received from the remote server. See image below.
- Select the symbol that you want from that window and press OK.
- In the Find Symbol window, the symbol will then be entered into the Selected Symbol edit box. Press the Open Historical Chart or Open Intraday Chart button to open a Historical or Intraday chart.
In the case of the Find Symbol window opened from the Chart Settings window, you will need to press OK instead.
Open Trading DOM for Chart (File)
This command opens the Trading DOM for the active chart at the time of selection.
For complete documentation for the Trade DOM windows, refer to the Chart Trading page.
Open Trading DOM (File)
This command opens the Find Symbol window. Select the symbol from the list of available symbols and then press Open Trading DOM. If a chart is active at the time of selection of this command, then the symbol for that chart is automatically filled in to the Selected Symbol entry on the Find Symbol window.
For complete documentation for Trade DOM windows, refer to the Chart Trading page.
Close Active Window (File)
This command closes either the active chart window or Spreadsheet window. The active window can also be closed by pressing the X button at the top right of the window.
New Chartbook (File)
Creates a new Chartbook. For more information, refer to Chartbooks.
Open Chartbook (File)
Displays the Open file window. Chartbook files will be listed. For more information, refer to Chartbooks.
Open Chartbook Group (File)
Displays the Open Chartbook Group window. Chartbook Group directories will be listed. For more information, refer to To Open a Chartbook Group.
Close Chartbook (File)
Closes the active Chartbook.
Close All Chartbooks (File)
Closes all open Chartbooks.
New Spreadsheet (File)
Creates a new Spreadsheet window. For more information, refer to Working with Spreadsheets.
New Quote Spreadsheet (File)
Creates a new Spreadsheet which has Spreadsheet >> Quote Spreadsheet enabled. For complete documentation for Quote Spreadsheets, refer to Getting Quotes.
Open Spreadsheet (File)
Displays the Open Spreadsheet window. Spreadsheet files will be listed. Select the Spreadsheet file you want to open from the list and press the Open button.
For more information, refer to Working with Spreadsheets.
If you do not see the Spreadsheet open after pressing the Open button on the Open Spreadsheet window, then go to the CW menu. You should see the Spreadsheet file listed there. Select it from the list and then select Window >> Maximize. It could be offscreen but doing this procedure will then make it visible.
New Quote Board (File)
This command opens a new Quote Board. Refer to Quote Board.
Open Time and Sales Window (File)
Opens the Time and Sales Window for the active chart. A Time and Sales Window is associated with a chart and there must be an active chart to be able to open the associated Time and Sales Window. Otherwise, this command will be disabled. This command is also on the Chart menu. For more information, refer to Time and Sales.
Open Market Depth Window (File)
The Open Market Depth Window command opens the Market Depth Window for the active chart. A Market Depth Window is associated with a chart and there must be an active chart to be able to open the associated Market Depth Window. Otherwise, the Open Market Depth Window command will be disabled.
This command is also on the Chart menu.
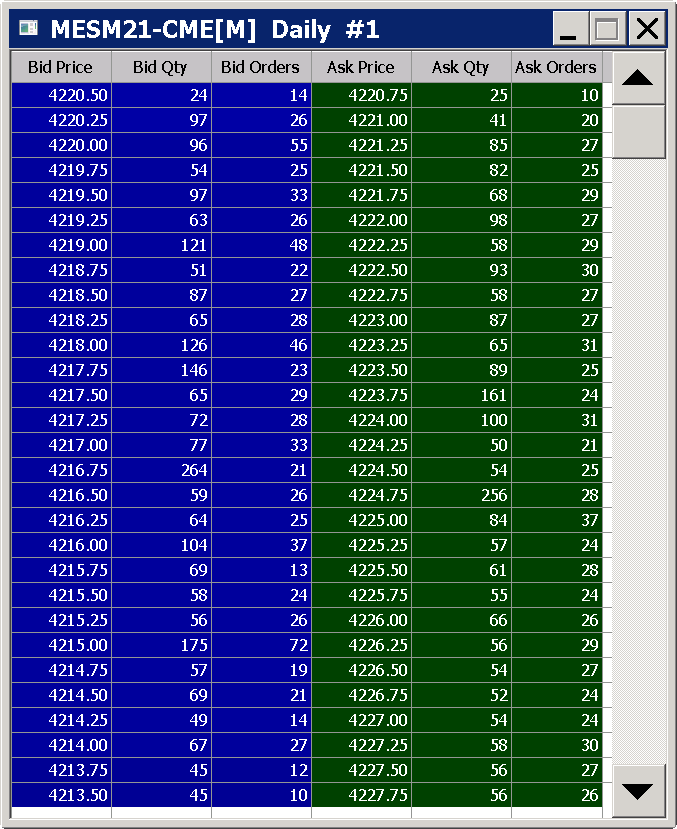
A Market Depth Window is a window that displays all of the available price and quantity data for limit orders for the Bid and Ask sides up to 500 levels. The number of market depth levels provided depends upon the number of levels provided by the exchange and could be limited by the particular Data or Trading service being used.
All of the Bid quantities and Ask quantities are summed separately and displayed at the bottom of this window.
To see market depth data it is necessary for Sierra Chart to be connected to the data feed with File >> Connect to Data Feed, and the data must be provided by the particular Data or Trading service you are using and for the particular symbol you have a chart or Trade DOM open for. Additionally, the market must be open for the symbol, to be receiving market depth data.
Market Depth data can be set up to be recorded and displayed during a chart replay. Refer to the section Replaying of Market Depth Data for instructions.
The text font in the Market Depth window is controlled by the Graphics Settings - Chart | Global >> Fonts >> Chart Text Font setting. For complete details, refer to Graphics Settings. Changes to the font setting may not go into effect for the Market Depth window until it is closed and reopened.
The colors in the Market Depth window are controlled by the following color settings in the Graphics Settings window.
- Market Depth: Bid Gradient Start Color
- Market Depth: Bid Gradient End Color
- Market Depth: Ask Gradient Start Color
- Market Depth: Ask Gradient End Color
There are various features in Sierra Chart which require Market Depth data. When connected to the data feed, when Market Depth data is required, you will see a message like this added to the Message Log: Requesting market depth updates for [symbol].
When connected to the data feed, when there are no longer any windows or features being used which require market depth data, then you will see a message like this added to the Message Log: Unsubscribed from market depth data for [symbol].
Not Receiving the Full Number of Market Depth Levels
- Make sure you are running an up-to-date version of Sierra Chart. To update, refer to Fast Update.
- The first step is to determine how many levels of market depth you can currently see. To do this, open the market depth window through File >> Open Market Depth Window.
- Check the value set in Chart >> Chart Settings >> Market Depth >> Maximum Market Depth Levels. Set this to 0 to display all available market depth levels. Or, set it to the desired number of levels to be displayed. Refer to Maximum Market Depth Levels for more information.
- If using a Sierra Chart provided Data Feed (example: Denali Exchange Data Feed), then select Global Settings >> Sierra Chart Server Settings.
Set Max Depth Levels to 0 to receive all the Market Depth levels available, or set it to the number of Market Depth levels required to be received from the server.
Note that this controls how many Market Depth levels are received and recorded within Sierra Chart. Refer to Max Depth Levels for more information.
You will need to reconnect to the data feed after changing this setting. - Select Global Settings >> Symbol Settings. In the list of symbols select the symbol or symbol pattern the Chart or Trading DOM is for. In the list of settings select Number of Depth Levels to Subscribe. Make sure the Default option is selected and it is 0.
You will need to reconnect to the data feed after changing this setting. - Make sure Sierra Chart is connected to the data feed with File >> Connect to Data Feed.
- Make sure the data feed you are using supports market depth data for the symbol you want to see market depth data for. In the case of the Denali Exchange Data Feed, refer to Adding Support for CME Market Depth Data.
For Sierra Chart provided data feeds, market depth data is available for: CME, CBOT, NYMEX, COMEX, NASDAQ TotalView, EUREX, CFE, LMAX, Crypto Currency markets. The Delayed Exchange Data Feed also provides market depth data. - If you are using one of the Real-time Exchange Data Feeds from Sierra Chart, make sure it is actually being used with the Trading service you are using. Refer to Integration with Trading Services.
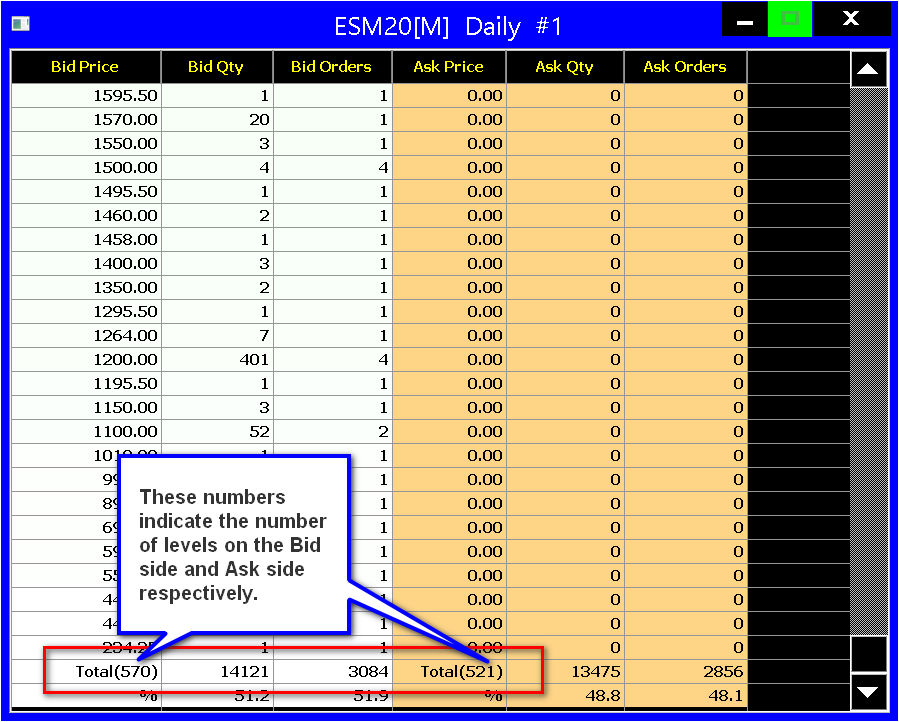
The following image shows how to determine the number of levels on the Bid side and Ask side.
Save (File)
Saves the currently visible Chartbook if a chart window is active. Or saves a Spreadsheet if a Spreadsheet window is active.
In the case of when a Chartbook is saved, this means all of the charts that are within the visible Chartbook are saved at once. There is no need to go to each chart and save each one individually.
When you want to save a Chartbook, make sure a chart window is active and not a Spreadsheet window.
Save As (File)
Displays the Save As window. Enter or select a Filename to save the active Chartbook or Spreadsheet as and press OK.
Save All (File)
Saves all open Chartbook and Spreadsheet files.
Data/Trade Service Settings (File)
Displays the Data/Trade Service Settings window.
Connect to Data Feed (File)
When this command is selected, it will connect Sierra Chart to the Data server. If the service you are using Sierra Chart with supports Trading, then this command will also connect to the trade server at the same time. In some cases, depending upon the particular service you are using, the data and trade server is the same server.
If Connect to Data Feed is disabled, this means Sierra Chart is already connected to the server or servers, or it is in the process of connecting.
To cause an immediate reconnect if Sierra Chart is in the waiting to reconnect state, select File >> Connect to Data Feed.
To cause Sierra Chart to automatically reconnect to the data and trading servers when the connection is lost, enable Global Settings >> Data/Trade Service Settings >> Reconnect on Failure.
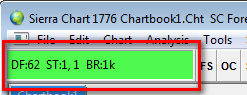
One way to determine if Sierra Chart is connected to the data feed is to look at the Status Bar on the Control Bar. If it is green, this indicates Sierra Chart is connected to the data feed. Refer to the image below.
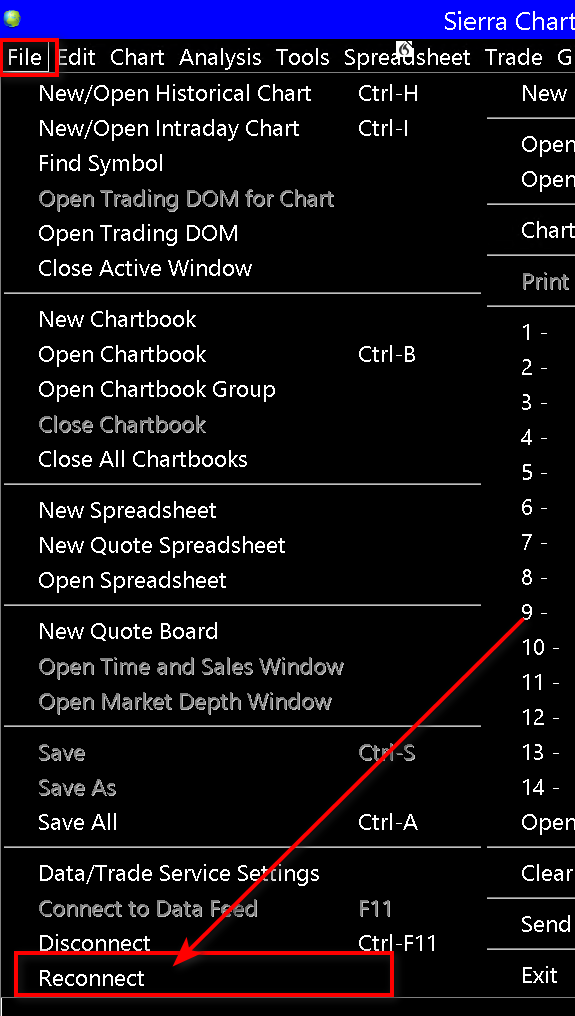
Procedure to Reconnect to the Data and Trade Servers
If Sierra Chart is connected to a Data only service, then it is only connected to the market data server of the Data service you are using.
If Sierra Chart is connected to a Trading service, then Sierra Chart will be connected to both a market data server and a trading server. These could be the same servers or separate. In almost all cases they are separate.
Follow the below procedure to reconnect to the market data and/or trading servers.
Select File >> Reconnect. This command exists in newer versions of Sierra Chart.
Disconnect (File)
Disconnects from the data and trade servers. Or cancels the reconnect status if Sierra Chart is waiting to reconnect to the servers.
This command will be disabled if Sierra Chart is already disconnected from the servers.
New Instance (File)
For complete documentation for this command, refer to the Using DTC Server for Data and Trading in Another Sierra Chart Instance documentation.
Open Study Summary Window (File)
For complete documentation for this feature, refer to Study Summary Window.
Print (File)
Print >> Charts
This command prints the active chart.
When this command is selected, a window will open for controlling various print related options. There should be a button, such as Preferences/Properties, to open your printer driver window. In this window you can set the chart to print in Portrait or Landscape mode.
If the chart background color is not a light color already, then it will be converted to white when printing. Therefore, it is not necessary to change the background color to a light color. This will happen automatically.
When printing, objects other than the background, if they are light, the color of them is darkened so they are more visible on the printed page.
When Global Settings >> General Settings >> Print Only In Black And White is enabled, all printing other than the background will be in black.
In the case where the chart background was not considered a light background and has been converted to white, colors which are considered very light are inverted to darker colors.
To print charts only in black-and-white, enable Print Only in Black-And-White in Global Settings >> General Settings.
In a chart window, there is a certain number of pixels between the chart bars. This number of pixels can be seen at the lower right of the chart.
When printing, usually printers have a much higher resolution and also will have a different height to width ratio than the chart window. The ratio between the printer width and the chart window width is calculated and this ratio is multiplied by the bar spacing in pixels. When printing, this new bar spacing in pixels is used. This can alter the first Date-Time that you see in the chart when printed. This cannot be changed.
If you need to be able to see exactly the same number of bars when printed as the chart window, then select Edit >> Copy to Chart.bmp. This will open up the exact chart in Microsoft Paint and it can be printed from there. It is only reasonable to do this if the chart has a white background.
Print >> Spreadsheets
Printing Spreadsheets is currently not supported.
Print >> Resolving Printing Problems
Sierra Chart does properly print charts following the specifications of the Windows API for printing.
If there is a problem with this, most likely it is going to be with the printer driver you are using even if you can print from other programs. In the case if there is a problem, the current driver you are using is unable to print the data that we have given the operating system which then in turn gives it to the driver.
Our recommendation, is to remove the existing printer driver for the printer you are using and install a new one through the Microsoft Printer Control Panel. Use the standard one provided by Microsoft.
To confirm that Sierra Chart is printing correctly, print to the Microsoft XPS Document Writer.
After printing to the XPS Document Writer, open the XPS document that has been created and you will see the printed chart. After opening the XPS document, you can then print it through the XPS viewer.
Most Recently Used Files (File)
On the right side of the File menu, you will see a list of the most recently opened files. Select a file to open it. Open All will open all of the files in the list.
You may want to use the File >> Clear Recent File List command and then reopen the particular Chartbooks and Spreadsheets that you normally want to have open and then later use the Open All command to open those same files with a single command.
Clear Recent File List (File)
Clears all of the recently open files on the right side of the File menu. This is useful to clear files you do not want to open when using the Open All command on the menu.
Send File to User (File)
When this option is selected the Send File to User window is opened which allows a file to be sent to another Sierra Chart user.
To send a file to a Sierra Chart user follow these instructions:
- Enter the recipient's Username/Account Name in the Sierra Chart Username/Account Name field.
- Press the Select File button to see a list of potential files to send.
- Select the desired file to send.
- Select the OK button to close the Select File window.
- If desired, select the checkbox next to Send Global Configuration (except account settings) to also send your Sierra Chart configuration file.
- Select OK to send your file(s).
Exit (File)
Closes all windows and exits Sierra Chart. You will be prompted to save your Chartbooks and Spreadsheets if Global Settings >> General Settings >> Display Save All Option on Exit is enabled.
*Last modified Saturday, 04th January, 2025.