Using the Basic Arithmetic Studies
- Introduction
- Arithmetic Studies Examples
- Displaying Calculated Value As a Single Text Value on the Chart
Introduction
In Sierra Chart it is possible to perform additional relatively simple calculations on the existing studies in Analysis >> Studies >> Studies Available, by using a combination of the Study Subgraph/Subgraphs Arithmetic studies which can be based on other studies including other arithmetic studies.
Alternatively, there is also the Spreadsheet Formula study.
The arithmetic studies are as follows:
- Study Subgraph Add
- Study Subgraphs Add
- Study Subgraphs Average
- Study Subgraph Standard Deviation
- Study Subgraph Subtract
- Study Subgraphs Subtract/Difference
- Study Subgraph Multiply
- Study Subgraphs Multiply
- Study Subgraph Divide
- Study Subgraphs Divide/Ratio
- Study Subgraphs Reference
- Study Subgraph Absolute Value
- Study Subgraph in Ticks
If you are not able to accomplish at all or easily, a custom calculation using the Arithmetic Studies, then use the Spreadsheet Study or Spreadsheet Formula study instead.
Or for more advanced programming use the Advanced Custom Study Interface and Language.
To create a custom calculated symbol, refer to Custom Calculated Symbols.
There is also the Add Additional Symbol study to load additional symbols into the chart and then you can use the various Arithmetic studies documented here with those data sets for each of the additional symbols to perform any custom calculations required.
Arithmetic Studies Examples
The following are examples of how to use the Arithmetic Studies.
Calculate an Upper Band 1.5 Times the Distance Between Two Study Subgraphs
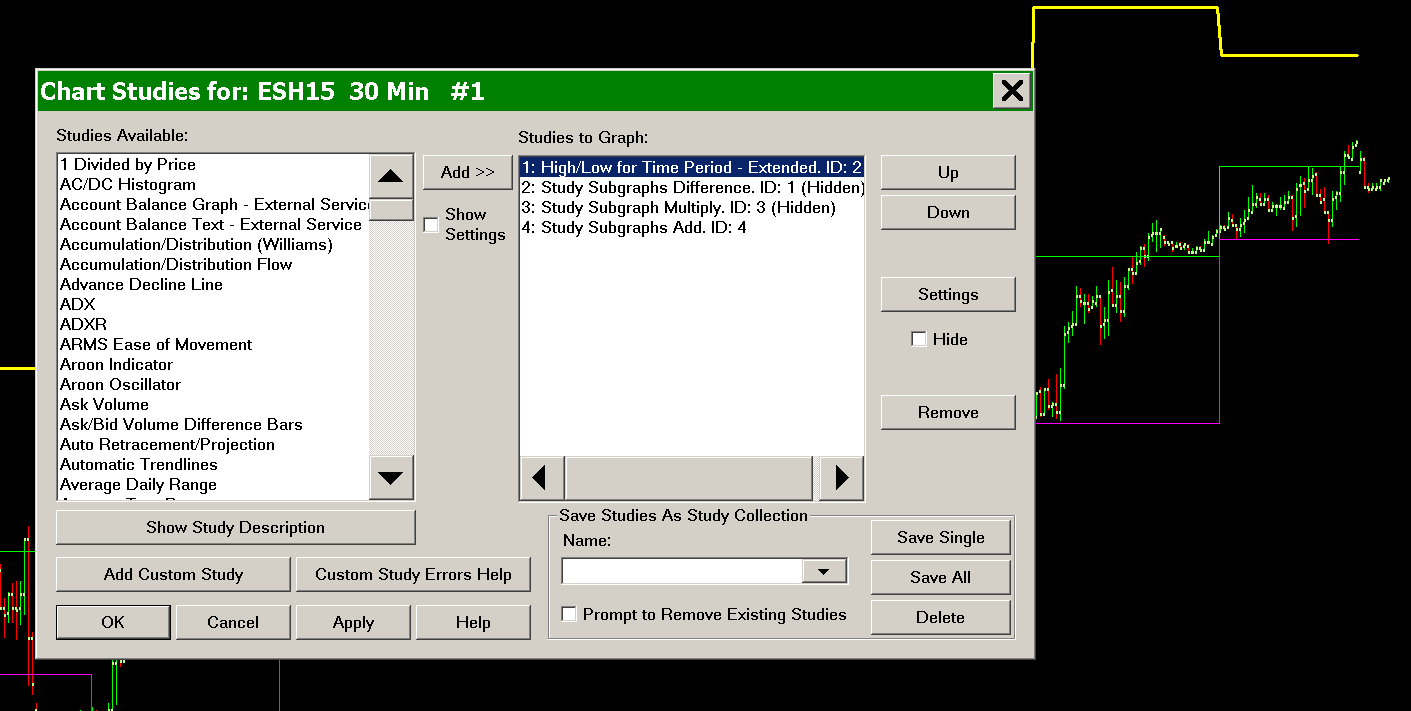
This example will calculate an upper band which is 1.5 times the distance between the two study Subgraphs of the High/Low for Time Period study.
Refer to the image below for the example.
- First add the study to the chart that you want to perform additional calculations on. In this particular example we are using the High/Low for Time Period study. Therefore, add this study to the chart.
- Add the Study Subgraphs Difference. Set it to calculate the difference between the two Subgraphs of the High/Low for Time Period study. Enable the Hide Study option in the Study Settings window for this study.
- Add the Study Subgraph Multiply study. Set it to be based on the Study Subgraphs Difference study and multiply it by whatever amount you require. In this example we are using 1.5. Enable the Hide Study option in the Study Settings window for this study.
- Add the Study Subgraphs Add study to the chart and set it to add the High line of the High/Low for Time Period study and the Study Subgraph Multiply study.
Calculate the Area Between Two Subgraphs (Integration)
This example will calclulate the area between Subgraphs. This is similar to an integration of the two Subgraphs, but due to the quantization of chart bars within Sierra Chart, only the difference between the Subgraphs at the location of chart bars is possible using the built-in tools. If a full integration is required, this would require programming in ACSIL.
To find the sum of the differences between two study Subgraphs follow these instructions:
- Place the two desired studies on the chart.
- Add the Study Subgraphs Subtract/Difference study to the chart.
- Go to the settings window for the Study Subgraphs Subtract/Difference study.
- Enter the first Subgraph information in the Input for Input Study 1.
- Enter the second Subgraph information in the Input for Input Study 2.
- Select OK.
- Add the Cumulative Sum of Study to the chart.
- Go to the settings window for the Cumulative Sum of Study study.
- Enter the information for the Study Subgraphs Subtract/Difference study in the Study and Subgraph to Reference Input.
- Select OK.
Displaying Calculated Value As a Single Text Value on the Chart
When using the arithmetic studies, you may want to display the calculated result as a single value on the chart and hide the studies themselves.
To do this, use the Text Display for Study study.
There is also the Study Subgraph Above/Below Bar as Text study.
To hide studies on the chart, use the Hide Study option on the Study Settings window for each of the arithmetic studies being used.
*Last modified Tuesday, 15th November, 2022.