Home >> (Table of Contents) Help/Frequently Asked Questions >> Help topic 30: High CPU Usage/Long Time to Load Chart Data
High CPU Usage | Inactive User Interface | Poor Performance | Long Time to Load Chart Data | Charts Reloading Often
Introduction
This page explains solutions to the problems of: High CPU usage. The user interface of Sierra Chart becoming inactive for a noticeable period of time. Dialog windows, such as the Chart Studies window, not appearing or not appearing right away. Excessive memory use. Charts Reloading Often. And general poor performance issues.
There are many possible reasons for all of these issues. This pages list the known conditions which can cause these issues and provides the solution in each case.
If the solutions listed below to reduce CPU usage and lessen the times when the user interface is inactive, are still not solving the problem, then run additional instances of Sierra Chart. For instructions to do this, refer to Using DTC Server for Data and Trading in Another Sierra Chart Instance. And refer to Sierra Chart Configuration for Most Low Response Time Trading.
Your computer should be using a minimum of a 6 core CPU with 16 gigabytes of memory for the best performance. It is also important to use SSDs (Solid-state drives). Adding more memory to your system may also help. There are processors available with even more CPU cores. It may also help to get more CPU cores, a faster CPU, more memory, and generally faster hardware. Although this is not necessarily the case. The first step is always to try to resolve the problem, with the software first rather than resorting to improved hardware.
For further details about solid-state drives, refer to use Solid State Drives.
If your computer is under very heavy load, and the user interface is often inactive or frozen and/or you cannot open any dialog windows (Example: Global Settings >> General Settings ), then the very first step is press the Escape (Esc) key on your keyboard and then disconnect from the data feed by selecting File >> Disconnect so you can work on resolving the problem.
The first help topic we recommend you start with in most cases, is 30.48 - Basic Steps to Resolve Performance Issue in Sierra Chart.
Never is the solution to a performance issue going to be to uninstall Sierra Chart and reinstall. We never recommend doing that!
- 30.1 - Too Much Data Loaded
- 30.2 - Spreadsheet Study
- 30.3 - Charts Reloading Often
- 30.4 - Inefficient Study Configurations or Advanced Custom Studies
- 30.5 - Chart Update Interval
- 30.6 - Too Many Charts Visible
- 30.8 - Antivirus/Anti-Malware Software
- 30.9 - References to Other Charts / Continuous Full Recalculation of Charts
- 30.10 - Short Bar Time Frames/Periods. Include Columns with No Data.
- 30.11 - Large Data Files
- 30.12 - Intraday Data Storage Time Unit. Historical Data Record Time Frame.
- 30.13 - Split Data Records
- 30.14 - Display Continuous Time Countdown (CountDown Timer)
- 30.15 - Highlight Tools Drawings
- 30.16 - What to do if Sierra Chart is in a frozen state for an extended time due to extended high CPU usage caused by an automatically or manually opened Chartbook
- 30.17 - Rebuilding Your Chartbook
- 30.18 - Studies that use the Internal Setting: UpdateAlways.
- 30.19 - Maintaining Too Many Time and Sales Records.
- 30.20 - Transparent Draw Styles
- 30.21 - Reducing File Sizes by Using Intraday Data File Management Feature
- 30.23 - Chart Tick Size and Volume at Price Processing
- 30.24 - Spreadsheet Windows Visible
- 30.25 - Excessive Memory Use Caused By Time And Sales Records Setting
- 30.26 - Too Many Chart Drawings
- 30.27 - ACS (Advanced Custom Study) Control Bar Buttons
- 30.28 - Memory or Graphics Device Interface Object Leak
- 30.29 - Solid State Drives / SSD
- 30.30 - Controlled Order Chart Updating
- 30.31 - System Memory Not Releasing
- 30.32 - Linking Scroll Position
- 30.33 - Dotted or Dashed Lines >= 2 Pixels in Width
- 30.34 - TPO Profile Chart Letter/Block Price Increment / Volume by Price Ticks Per Volume Bar
- 30.35 - Volume by Price Study Configurations
- 30.36 - Chart Data File Error/Out of Range Value
- 30.37 - Determining CPU Load from Sierra Chart
- 30.38 - Long Time to Download Historical Chart Data
- 30.39 - Average Time to Open Chartbooks
- 30.40 - Dialog Windows Do Not Display
- 30.41 - Slow Replay Due To Back Test Modes
- 30.42 - Detached Charts
- 30.43 - Bid and Ask Depth Bars Study
- 30.44 - Performance Differences Between Versions of Sierra Chart
- 30.45 - Detailed Continuous Futures Contract Logging
- 30.46 - Market Depth Combine Increment in Ticks
- 30.47 - Use Sub Instances to Distribute Processing Load
- 30.48 - Basic Steps to Resolve Performance Issue in Sierra Chart
- 30.49 - Studies Recalculating at Earlier Index and Study Dependencies
- 30.50 - Improving Performance of Chart or Trade DOM (Opens a new page)
- 30.51 - Very Large and/or Large Number of Trade Activity Files
- 30.52 - Recent Bid/Ask Volume | Current Traded Bid/Ask/Total Volume
- 30.53 - Causes of High Memory Usage
- 30.54 - Improving Chart Data Loading and Historical Data Downloading Times
- 30.55 - System Power Management and Process Priority
- 30.56 - Global Chart Values Tool / Global Cursor
- 30.57 - Operating System and Hardware Changes to Improve Performance
- 30.58 - Using Sierra Chart Timers for Faster Updates
30.1 - Too Much Data to Load or Loaded
Specifying too much data to load or loaded into one or more charts will increase the amount of time it takes for the chart data to load and for the studies on the chart to be calculated when there is a full recalculation of the studies.
The usual case which causes a full recalculation of studies is when the chart is opened as part of a Chartbook or Study Settings are changed.
To reduce the amount of days of chart data loaded into a chart, select Chart >> Chart Settings >> Data Limiting on the menu. Set the Use Number of Days to Load >> Days to Load setting to a smaller number. This issue primarily applies to Intraday charts. Not Historical Daily and higher timeframe charts.
Although with Historical charts, if you are using studies on those charts that are time-consuming to calculate, then reducing the number of days in the Historical chart can reduce CPU usage.
Reducing the Days to Load will definitely decrease the amount of time it takes to load Intraday chart data.
The amount of time it takes to load Intraday chart data with a particular Days to Load setting, is affected by the number of data records in that data file. The Global Settings >> Data/Trade Service Settings >> Intraday Data Storage Time Unit affects this and also the frequency of trading for the symbol. If the Intraday Data Storage Time Unit is set to 1 Tick, and there is a lot of trading that occurs for a symbol, it will take longer to load Intraday chart data compared to a symbol that trades less frequently.
Also, take note of the information given in 30.12 - Intraday Data Storage Time Unit. Historical Data Time Frame.
When you are loading a large number of days into a chart, have a lot of charts open, and a lot of studies on those charts, then as historical Intraday data is being downloaded, this can increase CPU usage.
Therefore, when large amounts of data are being downloaded or you are re-downloading Intraday data for a particular symbol, it may be a good idea to close your Chartbooks and open a small number of charts without studies to work with while you are performing operations like re-downloading data or other operations involving managing of chart data.
This is generally not necessary. However, it can be helpful with very complex Chartbook configurations. If you do this, then when Sierra Chart is finished with downloading data, you will no longer see Downloading Historical Data on the chart, at that time go ahead and open your usual Chartbooks.
Even when a study is set to be hidden, it will still be calculated and does not eliminate the calculations. Although it does eliminate the graphics processing if it is on a visible chart.
You are able to see the full recalculation time of a study in the Chart Studies window. For details, refer to Studies to Graph. In general the full recalculation time of a study is going to be reduced by reducing the number of days loaded in the chart.
30.2 - Spreadsheet Study
The Number of Rows input for a Spreadsheet Study is set to a very high number. This potentially can cause high CPU usage when new bars are added to the chart or there is a full recalculation of studies. You may want to reduce this to 1000. Refer to the Number of Rows Input description on the Spreadsheet Study Inputs documentation page for more information about when this can cause a problem.
Another possible reason for high CPU usage is you are using the same Spreadsheet file, which is used by the Spreadsheet Study, in more than one currently open Chartbook at the same time. Refer to the Number of Rows Input description on the Spreadsheet Study Inputs documentation page for more information about when this can cause a problem.
30.3 - Charts Reloading Often
If a chart is reloading itself often, then there can be two causes of this.
One cause is because the chart is being referenced by 2 or more charts, that contain a study that refer to other charts. In this case, each of the charts that is referencing the chart that is reloading often, has different Chart Settings.
These Chart Settings include the time period per bar, Session Times, and Number of Days to Load or Date Range settings. Differences between these settings among 2 or more destination charts will cause the source chart to reload to match the settings of the destination chart. This causes continuous reloading of the chart data in the source chart being referenced by those other charts.
To determine if a chart is being referenced by other charts, select Chart >> Chart Settings on the menu. Look at the top of the Chart Settings window. If the chart is being referenced by other charts, you will see the chart numbers referencing it after Ref. by: on the title bar of the Chart Settings window.
An indication that this is occurring will be indicated by messages like this in the Message Log:
Chart #1 has tagged chart #13 for full recalculation. Chartbook: Chartbook1.Cht
Chart #1 has tagged chart #13 for full recalculation. Chartbook: Chartbook1.Cht
Chart #13 is performing a full recalculation because it has been tagged. Chartbook: Chartbook1.Cht
Chart Settings have been synchronized between Destination chart number #13 and Source data chart number #1. Performing a chart reload of source data chart.
Other indications of this occurring is a chart switching between different time periods per bar or the cursor often changes to an hourglass.
Studies like the Difference study will refer to other charts. For example, given charts #1, #2, and #3, if studies on charts #1 and #2 both make a reference to #3, and #1 and #2 have different time periods per bar, then chart #3 will often reload and switch between different time periods per bar.
Studies like the Difference and Ratio studies make references to other charts for the necessary data they need.
The proper solution to this issue is to open another chart, and have the #2 chart refer to that new chart instead of #3. It could even be that you no longer need charts #1 and #2 to refer to #3 any longer and you just need to remove the studies that make reference to a source chart, from charts #1 and #2.
A second cause of this problem is an Advanced Custom Study which is changing one of the Chart Settings which is causing a reload of the chart. If this reloading is continuous, then the study is not functioning properly.
TPO Charts Reloading Often
Another scenario which can cause a chart to continuously reload its data is if the chart has a TPO Profile Chart study on it. This in and of itself will not cause a reloading problem, but there is a scenario where this can happen.
The TPO Profile Chart study will change the underlying timeframe per bar to 1 minute. When this happens and the chart is being referred to by another chart with a different timeframe for bar, then the chart will reload and set its timeframe per bar to be the same as the referencing chart.
After that reload completes, the TPO Profile Chart study will then set the chart back to 1 Minute per bar. This results in an endless cycle of reloading. In this case, make certain the TPO Profile chart is not referred to by any other chart.
30.4 - Inefficient Study Configurations or Advanced Custom Studies
One or more Advanced Custom Studies that you are using, is using a lot of CPU time. These are studies which are added through Analysis >> Studies >> Add Custom Study but excluding the Sierra Chart provided studies. This also includes studies from the "User Contributed Studies" DLL.
To confirm if these studies are the problem, restart Sierra Chart and on the Sierra Chart Login window, enable the Safe Mode option.
For complete details, refer to help topic 17.1.
If you no longer notice high CPU usage, then one or more of those studies was the problem. You need to contact the developer of the study or studies to correct this problem.
It is not unusual for user developed Advanced Custom Studies to use a high amount of CPU usage due to inefficient programming.
You are able to see the full recalculation time of a custom study and any study in the Chart Studies window. For details, refer to the Studies to Graph list.
During a full recalculation of a chart which happens when a chart is reloaded (like when changing the timeframe of chart bars), or when a Chartbook is opened and the studies are calculated, or when enabling and disabling Trade >>Trade Simulation Mode, then the study calculation time is going to take longer because of the full recalculation.
Sierra Chart Provided Studies
Sierra Chart provided studies can also be configured in a way which causes high CPU usage and inefficiencies as well. To determine which study is causing a problem, it is helpful to look at the full recalculation time of the study in the Studies to Graph list.
Another approach is to Remove one study at a time from the open charts to see which particular study is causing excessively high CPU usage and maybe causing a performance issue.
When you remove a particular study from a chart, and you notice a performance improvement this is a good indication, that study was causing a performance issue. You then need to look at the Input Settings of it.
Another way to reduce the calculation time is to decrease the Days to Load setting in Chart >> Chart Settings.
30.5 - Chart Update Interval
The Chart Update Interval is set to a small interval which causes increased CPU usage.
To increase the global Chart Update Interval setting, select Global Settings >> General Settings on the menu. Enter the value in the Chart Update Interval box in milliseconds. Try increasing it to 800 ms or higher.
Individual charts and Trade DOMs can override the global Chart Update Interval setting. Go to a chart and select Chart >> Chart Settings >> Display. Set the Chart Update Interval in Milliseconds setting in the Chart Settings to a nonzero value to override the global setting. For example, you can set an individual chart to update faster than the global Chart Update Interval. You can set this to a value of 100 ms.
To set the chart to use the global Chart Update Interval, set the Chart Update Interval in Milliseconds 0 to use the global setting.
If you are using a Chart Update Interval under 100 ms, then do not contact support for high CPU usage problems. Be aware that using an extreme setting like under 50 ms is not regarded as efficient and you should be aware of the potential negative consequences with CPU usage that this will cause. In other words, use these more extreme settings at your own risk!
For complete information about Chart Update Interval, refer to the Chart Update Interval documentation.
Also, refer to the 30.30 - Controlled Order Chart Updating setting. In almost all cases, Use Controlled Order Chart Updating should be disabled. It is only for use with special types of trading systems.
Using Higher Chart Update Interval for Charts Which Use a Lot of CPU Time
For charts that you know use a lot of CPU time it is recommended to use an independent Chart Update Interval for them. Go to those charts and select Chart >> Chart Settings >> Display. Set the Chart Update Interval in Milliseconds to a nonzero value. We recommend using a range of 1500 to 3000 milliseconds.
Or what you can do is increase Global Settings >> General Settings >> Chart Update Interval to a higher value, and in those charts that you want to update more frequently you can use a shorter Chart Update Interval for those.
Also refer to Sierra Chart Configuration for Most Low Response Time Trading section.
30.6 - Too Many Charts Visible
Having many charts visible at the same time may cause an issue. Although not typically. Try minimizing the charts that you do not need to see or reduce their overall size.
It is possible to hide a Chart window through Window >> Hide Window. Refer to Hide Window.
30.8 - Antivirus/Anti-Malware Software
Antivirus/Anti-Malware software programs can cause high CPU usage within Sierra Chart, a long time to load chart data, and longer times to download historical data.
To solve this, exclude files with a scid extension from being scanned by the Antivirus/Anti-Malware program, set the Sierra Chart folder (usually C:\SierraChart) to be excluded from scanning, or disable the Antivirus/Anti-Malware program altogether.
Antivirus/Anti-Malware programs can cause a significant increase in CPU usage if scid files are being scanned during real-time chart updating. If you exclude the scid file extension or the Sierra Chart folder from being scanned and you still notice high CPU usage, then disable your Antivirus/Anti-Malware program.
After disabling the Antivirus/Anti-malware program, it is necessary to restart Sierra Chart. You should in general not run these types of programs on a computer for trading. In our experience, Antivirus/Anti-Malware and firewall programs typically are the source of numerous problems on computer systems.
One indication that an Antivirus/Anti-malware program is causing high CPU usage is if you select File >> Close All Chartbooks and File >> Disconnect and you still notice high CPU usage by the Sierra Chart process as reported by the operating system, then this is a definitive indication that it is being caused by the Antivirus/Anti-malware program.
In some cases it is not enough to disable the Antivirus/Anti-malware program from your system and instead you must remove the Antivirus/Anti-Malware program completely from your system and confirm that is removed and confirm there are no left over Services from it. Disabling it is not sufficient. Our statements here are backed up with lots of experience. We have seen issues like this before. This is a definite step you need to take if you still notice the high CPU usage even after closing the Chartbooks and disconnecting from the data feed.
Microsoft Security Essentials : Many users of Microsoft Windows will be using the Microsoft Security Essentials anti-malware software offered by the Microsoft operating system. For users that are running Microsoft Security Essentials, it is essential that you set it to exclude the folder Sierra Chart is installed to from being scanned and also exclude scid file types.
30.9 References to Other Charts / Continuous Full Recalculation of Charts
Some studies, this includes the Difference (Bar/Single Line) and the Study/Price Overlay studies and others, will reference data on other charts.
You need to be aware of what are known as circular references. A circular reference is when two charts refer to each other. An example of this would be when Chart #1 has studies that reference Chart #2 and Chart #2 has studies that reference Chart #1. This kind of circular reference can lead to unreliable behavior with the studies.
Sierra Chart should detect this kind of circular reference and will prevent any consequence from it. However, what potentially can occur is that each of these charts would be continuously updated at the Chart Update Interval set in Global Settings >>General Settings.
This is what you will see in the Sierra Chart Message Log when the circular reference is detected:
You also need to be aware of indirect circular references. An example of an indirect circular reference is: #1 -> #2 -> #3 -> #1. This will cause continuous full recalculation of the charts. Sierra Chart will not be able to detect an indirect circular reference.
If there is continuous full recalculation of charts, as is evidenced by the Message Log messages below, or you have a circular reference, remove the studies that are causing the circular reference from one of the charts or have them refer to another source chart with a timeframe per bar and with the studies that you require, but which does not reference back to the destination chart which is referencing that source chart.
A chart continuously reloading can also cause these same messages and that is explained further below.
Below is an example of what you will see in the Sierra Chart Message Log as the result of an indirect circular reference:
Chart #2 has tagged chart #1 for full recalculation. Chartbook: Chartbook253.Cht
Chart #1 is performing a full recalculation because it has been tagged. Chartbook: Chartbook253.Cht
Chart #1 has tagged chart #3 for full recalculation. Chartbook: Chartbook253.Cht
Chart #3 is performing a full recalculation because it has been tagged. Chartbook: Chartbook253.Cht
Chart #3 has tagged chart #2 for full recalculation. Chartbook: Chartbook253.Cht
Another condition which can cause the above messages is a chart continuously reloading. In which case it will tag charts for a full recalculation, that reference it. For further information about this condition and how to solve it, refer to 30.3 - Charts Reloading Often.
To determine if a chart is being referenced by other charts, select Chart >> Chart Settings on the menu. Look at the top of the Chart Settings window. If the chart is being referenced by other charts, you will see the chart numbers referencing it after Ref. by: on the title bar of the Chart Settings window.
If Sierra Chart support referred you to this help topic subsection and you are very confused by all of this and do not know what to do, then select File >> Close Chartbook to close the Chartbook you are currently using, assuming it is that Chartbook which is causing the above continuous full recalculation messages.
This should stop the above messages. If not, continue closing Chartbooks until the messages stop. Do not use the Chartbook causing those messages again and create a new one with File >> New Chartbook. The Chartbook you closed has a circular reference condition which needs to be solved if you want to continue to use it.
Efficient Use of ACSIL Functions to Reference Data from Other Charts
If you are a custom study developer and you are using ACSIL functions to get main price graph or study data from other charts, then it is important to use these functions efficiently. Refer to the scsf_DifferenceBar function in the /ACS_Source/studies6.cpp file in the Sierra Chart installation folder for an example.
30.10 - Short Bar Time Frames/Periods. Include Columns with No Data.
Using a short time frame/period per chart bar or using the Include Columns with No Data option, especially with a high Days to Load setting, will cause very long Intraday chart load times with high CPU usage and an inactive user interface.
A short time period per bar includes using a time period under 1 Minute per bar, a small Number of Trades Per Bar, Volume Per Bar, or a small Range Per Bar setting. For example, a timeframe per bar of 1 Second is considered short. This will use a lot of memory if the number of days loaded in the chart is high like 30 days or more.
To change these settings, select Chart >> Chart Settings on the menu. Decrease the Days to Load setting. Uncheck the Bar Period >> Include Columns with No Data option. And increase the time period per bar in the Intraday Bars Period frame.
An example of a problem would be if you set the Intraday chart bars to 1 Number of Trades Per Bar, try to load 30 days of data, and there is tick by tick data in the chart data file. In this case you may be waiting a long time to load up that chart. The solution is to decrease the Days to Load setting or use a higher time period per bar. If you combine this issue with the issue discussed in subtopic 30.3, then you are going to have a real problem.
Another thing to understand is that if you are using Number of Trades or Volume chart bars, and the necessary data to calculate the number of trades or volume per bar is not available, then the Days-Minutes-Seconds setting will be used instead. If that is a small setting, such as under 10 seconds, then this also can cause long load times under some conditions.
30.11 - Large Data Files
Very large data files will cause long load times when you open a chart.
To reduce the size of files automatically, select Global Settings >> Data/Trade Service Settings >> Data File Management on the menu. For complete details, refer to Data File Management.
If using a Tick by Tick Data Configuration, this will cause larger data files.
30.12 - Intraday Data Storage Time Unit. Historical Data Record Time Frame.
Using a larger Intraday Data Storage Time Unit will reduce storage space used for Intraday chart data, reduce the time to read chart data from the Intraday data file any time that occurs, such as when opening Chartbooks or changing the timeframe of the chart bars, and will speed up historical data downloads significantly when downloading Intraday data when using Data and Trading services that use the Sierra Chart historical data server.
Related information can be found in the Improving Performance of Loading Chart Data section.
The amount of time to load Intraday data in a chart is dependent upon the number of days being loaded into a chart, the size of an Intraday data file (file sizes can be determined through File >> New/Open Intraday Chart, and whether Volume at Price data is required to be maintained or not. Antivirus/Security software can also have a detrimental impact.
If the Intraday Data Storage Time Unit is 1 Tick, then the downloading of tick by tick data can be very time-consuming. Unless you need charts that use a bar period of less than 1 minute or you use Number of Trades, Volume, Range, Reversal, Renko, Delta Volume, Price Change, Point and Figure Bars, you definitely should use an Intraday Data Storage Time Unit of 1 Second or higher.
This will reduce the storage space for Intraday chart data, reduce CPU usage, and reduce the amount of time to download historical data.
Even if you are using Number of Trades, Volume, Range, Reversal, Renko, Delta, Price Change bars, you probably will still want to increase the Intraday Data Storage Time Unit to 1 Second. The chart bars may not be 100% precise, but due to increased trading volumes, tick by tick data is simply burdensome on your system to work with. Therefore, you have to consider this and find what is a good balance. Sierra Chart will still produce reasonably accurate charts of these types from 1 Second data.
If you perform chart replays or you are using the Volume by Price study or other studies which require volume data in small time units, and you only use minute-based charts, then it is recommended to use an Intraday Data Storage Time Unit relatively small like 1 Second rather than 1 minute. This will still give you good performance improvements over 1 Tick.
To change the Intraday Data Storage Time Unit, select Global Settings >> Data/Trade Service Settings on the menu. Set the Intraday Data Storage Time Unit to a setting higher than 1 Tick.
After changing the Intraday Data Storage Time Unit, you may want to download all of the data again in the chart data file to get data at the higher timeframe per record. To do this, go to your chart and select Edit >> Delete All Data And Download.
Additionally, in the Global Settings >> Data/Trade Service Settings window, you may wish to reduce the Maximum Historical Intraday Days to Download setting from the default. For example, if it is 45 and you do not need that much data, you may want to reduce it to 10 in the case when you are downloading historical 1 Tick data. This will speed up the data downloading process.
If you set the Intraday Data Storage Time Unit to 1 Minute, you will notice a dramatic improvement with chart loading and overall performance. Although you do not have to go as high as 1 Minute. A good balance would be to use a setting of 2 seconds.
In the case of CQG historical data (provided by CQG), since Sierra Chart has only supported 1 minute data, or limited amount of tick by tick data from CQG, this is why when using CQG data, charts will load faster. Since there is less, a lot less, tick by tick data. You can solve this problem by using an Intraday Data Storage Time Unit of 1 Second or 2 Seconds or higher.
30.13 - Split Data Records
The Split Data Records option in Chart >> Chart Settings may increase the number of bars created in an Intraday chart when using Tick, Volume, or Range based bar charts. This potentially will cause increased chart loading times. This may especially be true when using a small number of Ticks or Volume per bar or a small Range per bar. Try disabling the Split Data Records option. Keep in mind if you disable the option, you may not have 100% constant Tick, Volume or Range charts. Although it can speed up load times.
Reducing the size of your data files as described in subsections 30.11 and 30.12 will also definitely help speed up chart loading times.
30.14 - Display Continuous Time Countdown (CountDown Timer)
When you are using the CountDown Timer study, and having enabled the Input Display Continuous Time Countdown Based on Real-Time Clock will cause the countdown timer to be updated at the Chart Update Interval. When this happens, the entire chart is redrawn.
This can cause high CPU usage, and it is recommended that this option only be enabled on 1 or 2 charts at any given time. The CPU demand may be even higher if it is enabled on detached charts.
The Clock - Realtime study will also cause the above described issue.
A solution to this is to increase the Chart Update Interval to a higher number.
30.15 - Highlight Tools Drawings
When you have used the highlight tools, Rectangle Highlight, Ellipse Highlight or Angle Ellipse Highlight, the drawings created can cause high CPU usage when they are visible on the chart. This high CPU usage will be when the chart is being redrawn. The reason for this is that they use an advanced method to create the transparency.
30.16 - What to do if Sierra Chart is in a frozen state for an extended time due to extended high CPU usage caused by an automatically or manually opened Chartbook
When a Chartbook is opened automatically or manually and Sierra Chart goes into a frozen state for an extended time because the Chartbook is using the full amount of available CPU usage for an extended time, then you may want to or need to avoid using this Chartbook. In this case you may want to Rebuild Your Chartbook.
In the case of an automatically opened Chartbook, you will need to prevent this Chartbook from opening automatically so that you can start Sierra Chart without it going into a frozen state.
The first step is to exit from Sierra Chart. If Sierra Chart is in a frozen state, you will need to terminate the process. This can be done through the Windows Task Manager.
Start Sierra Chart again. On the Login window press the Cancel button once to stop the login process. Enable the Safe Mode option and disable the Open Files on Startup option. This will prevent Chartbooks from automatically being opened and prevent the loading of custom studies which could also be the source of the problem. For detailed instructions, refer to Using Safe Mode. After this continue with the Login process.
It is then recommended that you simply rebuild a new Chartbook because there is something in that Chartbook configuration which is using high CPU usage for an extended time or it could be caused by a custom study. However, read further in this section to understand the possible reasons for the problem.
There are several reasons for this problem. There could be certain chart or study settings which are causing high CPU usage for an extended time and is freezing Sierra Chart.
There could be some kind of data error in the chart data file which is causing an unusual problem with certain types of bar period types.
The problem could be caused by custom studies from outside developers which will not be loaded when using Safe Mode. So you can try opening the Chartbook again manually through File >> Open Chartbook and see if you encounter the problem now that you are using Safe Mode.
One of the reasons for high CPU usage causing a Chartbook to freeze could be that the Tick Size is not set correctly and there is an excessive amount of Volume at Price data. This not only will cause a long time to build that data, but it will cause the primary thread to freeze when the primary thread is building that data or studies are using that data. For more information, refer 30.23 - Chart Tick Size and Volume at Price Processing.
When a chart is being loaded, the building of the Volume at Price data happens on a background thread. But it also happens on the primary thread when historical data is being downloaded gradually.
In the case of where a chart data file is causing a problem, in most cases is going to be an Intraday data file. Instead of avoid using the Chartbook which is freezing Sierra Chart, what you can alternatively do is delete the Intraday chart data file or files as explained below.
- Select Global Settings >> General Settings. Make a note of the file path in the Data Files Folder box.
- Select File >> Exit.
- Go to the Sierra Chart Data Files Folder on your system that you made a note previously.
- Locate the Intraday chart data files which are actively being used. The name of the file for a symbol will be the symbol and it will have a SCID extension.
- Delete the file or files.
- Start Sierra Chart again and then try opening the Chartbook again. Fresh Historical Intraday data will be downloaded from the server again.
30.17 - Rebuilding Your Chartbook
If you have reviewed all of the issues and solutions on this page and still have not found any reasonable solution to your high CPU usage problem and when you close your Chartbook or Chartbooks with File >> Close All Chartbooks, the CPU usage goes down to normal, then obviously there is something you are doing in one or more charts in those Chartbooks which is causing high CPU usage.
In this case it is then recommended that you rebuild a new Chartbook in order to start from a completely simple and clean state. Gradually as you rebuild your Chartbook, you should identify what is causing the high CPU usage when you begin to notice an increase in CPU usage from the particular settings and studies you are using.
For the charts in this new Chartbook, set the Days to Load setting in Chart >> Chart Settings to a small value.
30.18 - Studies that use the Internal Setting: UpdateAlways
Studies have an internal setting called UpdateAlways. When this is set to true, then the study will be continuously calculated and the chart window will be redrawn every chart update interval. However, the minimum interval is no less than approximately 300 ms when this setting is true. The only two studies that are built into Sierra Chart that use this are Countdown Timer, used only in some cases and discussed in help topic 30.14, and the SC Woodies Panel. What this setting means is that you will have higher CPU usage when using studies that use this setting and you will have higher CPU usage than normal even when disconnected from the data feed.
30.19 - Maintaining Too Many Time and Sales Records
If Global Settings >> Data/Trade Service Settings >> Common Settings >> Number of Stored Time and Sales Records is set to maintain set to a large number, like more than 50000 records, then this is definitely high and potentially, although not necessarily, can increase CPU usage.
It is recommended that if this is causing higher CPU usage, then reduce it to a smaller number.
30.20 - Transparent Draw Styles
If you are using the Transparent Draw Styles with a study or using the Transparency option with the Volume by Price study, then this will increase CPU usage. This is something to be aware of. The level of transparency can be controlled under Global Settings >> Graphics Settings. Whether this makes any difference with CPU usage, is not known.
30.21 - Reducing File Sizes by Using Intraday Data File Management Feature
As has been explained in sections 30.11 and 30.12, large Intraday data files or Intraday data files containing tick by tick data will take longer to load into a chart.
One solution to this issue is to reduce the size of these files by compressing older data in them by using the Intraday Data File Management feature.
It is strongly recommended to use this feature for older historical data if you have long Intraday chart data loading times.
30.23 - Chart Tick Size and Volume at Price Processing
When using studies that rely on the Volume at Price data, which include the Volume by Price, Numbers Bars, TPO Profile Chart, Volume Value Area Lines, TPO Value Area Lines and some other studies, it can potentially take an extended time to load chart data from the chart data file due to the Volume at Price data processing.
Or the chart may not load at all due to an extremely long load time and excessive memory usage.
Another effect of this, is that there can be very high memory usage by the chart.
Another problem is that there could be high CPU usage and potentially freezing, during real-time chart updating or chart scrolling due to excessive volume at price processing and an excessive number of price levels to draw on the chart.
This can be true when you have tick by tick data in the chart data file.
If the chart Tick Size in Chart >> Chart Settings >> Symbol is incorrectly set, and is too small, this can dramatically increase the time to load chart data and also increase memory use.
This type of issue is especially a problem with crypto currency markets where the chart Tick Size may be set to a small value and as a practical matter it is just too small. So you must increase it dramatically like sometimes 100 or a 1000 times larger.
Select Chart >> Chart Settings >> Symbol. Press the Apply Global Symbol Settings button to automatically set the Tick Size for known symbols. If it is still not set correctly, then Update the Symbol Settings.
After updating the Symbol Settings, apply them to the chart again using the Apply Global Symbol Settings button on the Chart Settings window.
If the symbol is not defined in the Global Symbol Settings or it needs to be manually increased, then you will need to manually set the Tick Size in Chart >> Chart Settings >> Symbol. When you manually set the Tick Size make sure that Auto Set from Data Feed is set to No in Chart >> Chart Settings >> Symbol.
Having an incorrect or too small of a Tick Size can also cause the chart to scroll slowly and result in high CPU usage and also high CPU usage during real-time updating of a chart.
Additionally, even when the Tick Size is set correctly, if there are a wide range of prices containing a large number of price ticks (based upon the chart Tick Size setting), this will increase the amount of time to load chart data, cause high CPU usage during real-time chart updating and cause the chart to scroll slowly. In extreme cases this will cause freezing of Sierra Chart. This is especially true with Historical Daily charts, higher timeframe per bar charts, and crypto currency symbols.
In the case of the foreign exchange market symbols, you will need to avoid using too small of a Tick Size and increase the Tick Size setting in Chart >> Chart Settings >> Symbol.
Or increase the Volume at Price Multiplier setting in Chart >> Chart Settings in the case of when charting a foreign exchange cash market symbol or in the case of Historical Daily Charts.
If the Days to Load setting in Chart >> Chart Settings is set too high, this will increase the time to load chart data when using any study that relies on the Volume at Price data.
When using studies that require the Volume at Price data on Historical Daily charts, then this will definitely slow the process of loading the Historical Daily data from the chart data file and will freeze the Sierra Chart user interface during the process of loading the data from the chart data file. The solution to this kind of problem with Historical Daily charts is to increase the Volume at Price Multiplier setting in Chart >> Chart Settings. It is recommended to use a minimum setting of 5 or even as high as 100 if necessary.
To avoid a problem where the Volume by Price study or other studies which require Volume at Price data are automatically added to a chart and where the default settings for the chart cause a very long chart data load time, make sure there is no Default Study Collection set to be applied to a chart.
Also refer to 30.35 - Volume by Price Study Configurations.
30.24 - Spreadsheet Windows Visible
While it is not a problem having a Spreadsheet window visible (these are the windows that are opened with File >> Open Spreadsheet or automatically opened by one of the Spreadsheet studies), if there is frequent updating of one of the visible sheets in a Spreadsheet such as by the Spreadsheet Study, then this will contribute to CPU usage and if you have many Spreadsheets visible, then that is even more CPU usage. The simple solution is to minimize the Spreadsheet window if you are not looking at it, if it's contributing a significant amount to CPU usage.
30.25 - Excessive Memory Use Caused By Time And Sales Records Setting
If the Global Settings >> Data/Trade Service Settings >> Common Settings >> Number of Stored Time and Sales Records setting is over 15000, then this can cause high memory use if Sierra Chart is tracking a very large number of symbols.
If it is significantly higher, then your memory usage can be very high. Reduce it to a smaller number and reconnect with File >> Reconnect.
30.26 - Too Many Chart Drawings
If you have hundreds of chart drawings (Lines, Rays, Text drawings, Price Retracements, Rectangles, ...) on a chart, then this can cause high CPU usage and sluggish chart performance.
Reduce the number of Chart Drawings on the chart by deleting some of the drawings. There are several ways this can be done including using Tools >> Manage Chart Drawings Window.
Refer to Erasing Chart Drawings.
30.27 - ACS (Advanced Custom Study) Control Bar Buttons
When using one of the Global Settings >> Customize Control Bars >> Control Bar # >> Tools - Advanced Custom Study Buttons (appears as CS# on the Control Bar), this button is been enabled on the Control Bar (this will be indicated by one of these buttons being selected), there is a custom study on the chart which has set sc.ReceiveMousePointerEvents= true, the Pointer or Chart Values Tool is active, and your Pointer is moved around the chart window, this can result in high CPU usage.
30.28 - Memory or Graphics Device Interface Object Leak
A memory leak in a custom Sierra Chart study or from some other software component running within the address space of Sierra Chart, will cause high memory use and slow Sierra Chart performance.
To see if there is a memory leak, start the Windows Task Manager. Go to the Processes tab. Select View >> Select Columns on the menu. Make sure the Memory - Working Set column is enabled. Press OK.
Locate the SierraChart.exe process in the list and see if the Working Set memory is increasing at an obvious rate or the memory use is very high.
In either of these cases, this is an indication of a possible memory leak. While a memory leak could be caused by Sierra Chart itself, this is extremely unlikely. Although keep in mind as Sierra Chart continues to run for an extended time, Intraday charts will use gradually more memory over time but this is a small increase over long spans of time.
In almost all cases excessively increasing memory is an issue with a custom study you are using or some other software component running within the address space of Sierra Chart using a lot of memory.
It is also known that when Sierra Chart is reading Intraday files, the operating system can cache the data and this will cause an increase in memory use which may not be released until Sierra Chart is exited. This increase in memory can also be caused by drivers which are monitoring files.
To prevent custom studies from being used if they are the cause of the memory leak, run Sierra Chart in Safe Mode.
A Graphics Device Interface object leak is something that is very rare, but has occurred in some cases. To determine if there is a GDI object leak, start the Windows Task Manager. Go to the Processes tab. Select View >> Select Columns on the menu. Make sure the GDI Objects column is enabled. Press OK. Locate the SierraChart.exe process in the list and see if the GDI Objects count is increasing. If you notice it increasing, let Sierra Chart support know.
30.29 - Solid State Drives / SSD
For the very best performance it is recommended that Sierra Chart be installed on a dedicated solid-state storage drive (storage device) on your system. Only Sierra Chart should be on that particular drive. It should not be used for any other purpose.
Solid-state drives are considerably faster than hard drives. This will greatly improve the performance of Sierra Chart especially with loading historical Intraday chart data and historical market depth data. And also ensures the best performance for Sierra Chart because no other program will be using that drive.
Another reason for this is when there are a lot of file I/O operations going on related to Sierra Chart, you do not want the operating system or other programs affected. For example, there will be a lot of data read from the storage drive when Intraday data is being read from a chart data file.
For example, you can have a very high performance system with solid-state drives and when a lot of Intraday charts are being opened at once, that could cause your system to freeze because Intraday data is going to be read at a very high rate from the storage drive due to the performance of the system and the speed of Sierra Chart, and that is going to block I/O operations being performed by the operating system and other programs causing your system to freeze at times.
We are not referring to a drive partition here. We are referring to a separate physical storage device on your system dedicated for the use of Sierra Chart only.
It is recommended to use a solid-state drive and in particular a NVME storage drive. For further details, refer to NVMe SSDs: Everything you need to know about this insanely fast storage.
Once you install an additional solid-state drive on your system, refer to help topic 15 to move Sierra Chart to that drive.
The ultimate solution is use a separate solid-state drive for Sierra Chart. And an additional solid-state drive for the Data Files Folder. So the Data Files Folder should have its own solid-state drive. In this solution, you will have a total of two additional solid-state drives on your computer system.
30.30 - Controlled Order Chart Updating
When Global Settings >> General Settings >> Charts >> Charts >> Use Controlled Order Chart Updating is enabled, then all of the charts within a Chartbook are updated and calculated at once, rather than separately if it is disabled. This can result in the user interface of Sierra Chart momentarily freezing while this is happening.
This option should only be enabled if required.
30.31 - System Memory Not Releasing
Sierra Chart is very memory efficient. It uses the absolute minimum amount of memory that is possible based upon what you are doing within Sierra Chart.
Memory is released by charts when they are closed and prior memory use within a chart is released when a chart is reloaded (Chart >> Reload and Recalculate).
To see what memory Sierra Chart is using, start the Windows Task Manager. Go to the Processes tab. Select View >> Select Columns on the menu.
Make sure the Memory - Working Set column is enabled. Press OK.
Locate the SierraChart.exe process in the list and look at the Working Set(Memory) column to see the memory use specifically for Sierra Chart.
If you notice your overall system memory use is high, this is from the operating system or other programs running on your system.
There are at least two possible explanations for increased memory use. The operating system may have cached the Intraday data read from Sierra Chart files. This is something Sierra Chart has no control over.
Another possibility is that anti-malware/antivirus software could be using excessive amounts of memory when it scans Sierra Chart data files. One way to isolate this as a problem is to restart your computer into Safe Mode with Networking Support to prevent this anti-malware/anti-virus software from loading and see if the excessive memory use goes away. If so, the problem is being caused by that software.
If there is a particular chart or charts within a Chartbook which are using a lot of memory, then first remove studies from those charts one by one to see if the memory use goes down significantly. Next, close those charts one by one and see if memory use goes significantly down. This will help you isolate where the problem is with high memory usage.
30.32 - Linking Scroll Position
When using the Chart Linking feature and linking the Scroll Position, that when scrolling charts, Then this will increase CPU usage and possibly could cause sluggishness with scrolling the chart.
Therefore, if linking the Scroll Position for more than two charts, and scrolling a chart that uses linking is sluggish, then try disabling the Scroll Position Chart Linking option to see if that solves the problem.
30.33 - Dotted or Dashed Lines >= 2 Pixels in Width
For any line drawn in Sierra Chart whether Study Subgraph lines, Order lines, Chart Drawing lines, or Grid lines, if the line width is greater than or equal to 2 pixels and they have a Line Style of any of the following:
- Dash
- Dot
- Dash-Dot
- Dash-Dot-Dot
Then these are drawn with what is called a geometric pen. This is an operating system drawing object.
Lines drawn with a geometric pen uses more CPU usage. For example, if a chart has a horizontal Grid using a line width of 2 pixels or more, a Line Style of Dot, and there are a lot of horizontal lines on the chart from the Grid, then as you scroll the chart, you will have a noticeable sluggishness which is caused by the high CPU usage from the geometric pen.
Therefore, the solution to this is to set the Line Style to Solid for efficiency.
30.34 - TPO Profile Chart Letter/Block Price Increment / Volume by Price Ticks Per Volume Bar
If there are a large range of prices displayed in the current view of a TPO Profile chart, it is possible that there are a large number of letters/ blocks displayed for TPO Profile.
When the chart is scrolled or when the chart is updated, the drawing of these TPO Profiles will be slow if there are a very large number of letters/blocks currently displayed.
There are two solutions to this problem.
The first solution is to increase the Letter/Block Price Increment in Ticks Input setting with the TPO Profile Chart study to a higher number. This may be especially important with Forex charts, which use a small Tick Size to begin with.
Increase the Letter/Block Price Increment in Ticks 1 at a time until you get a good balance between detail and minimum of CPU load.
The second solution is to set the Sub Period Price Display Style Input setting to Horizontal Bars. This will significantly reduce CPU usage of the TPO Profiles and allows you to continue to use a more detailed Letter/Block Price Increment in Ticks setting of 1 or 2.
In the case of when using the Volume by Price study, there can be the same kind of problem where there are too many volume bars per Volume Profile causing a performance issue. In this case, increase the Ticks Per Volume Bar Input setting.
30.35 - Volume by Price Study Configurations
There are certain Volume by Price study configurations which can cause high CPU usage and make the overall performance of Sierra Chart sluggish or cause momentary freezing.
The type of Volume Profiles which can cause high CPU usage would be long-term single profiles which are calculated relative to the last Date-Time in the chart. An example would be a 3 months or greater Volume Profile with a Volume Graph Period Type of One Period at End of Fixed Time Length.
The solution to this is to change the Volume Graph Period Type to From Start Date-Time to End and specify a Start Date and Start Time for the Volume Profile. This makes it efficiently calculated.
The Ticks per Volume Bar Input setting with the Volume by Price study could be set too low and cause an excessive number of price levels to be drawn on the chart which will make the chart drawing performance very slow. The degree of the slow performance depends upon the number of price levels, or volume bars, which are actually drawn on the visible area of the chart. To solve this problem if it exists, increase the Ticks per Volume Bar Input setting with the Volume by Price study.
For further information, refer to Volume by Price Settings.
30.36 - Chart Data File Error/Out of Range Value
A Historical Daily or Intraday chart data file that contains 80 data error or out of range value, can cause a long time to load chart data, excessive memory use and/or a long time to calculate studies. All of this can cause Sierra Chart to freeze for a period of time.
This is generally true when the Volume at Price data is being maintained for the chart. This is the case when using any of the following studies:
- Volume by Price
- Volume Value Area Lines
- Numbers Bars
- Numbers Bars Calculated Values
- TPO Profile Chart
- TPO Value Area Lines
Or any other study that requires the Volume at Price data.
The solution to this in the case of a Historical Daily chart is to fully re-download the data in the chart by selecting Edit >> Delete All Data and Download. Although this assumes that the server has the correct data.
Assuming the server has the correct data, a comprehensive solution to a data error in an Intraday chart data file is to delete the Intraday chart data file following the Deleting Intraday Chart Data file instructions.
30.37 - Determining CPU Load from Sierra Chart
This section describes how to determine what the load Sierra Chart is placing on your system CPU and if the maximum available CPU time used by the Sierra Chart primary thread of execution, has been reached.
Sierra Chart does use multiple threads, but the additional threads are for loading Intraday data and for some other specialized purposes. However, most processing which is occurring during real-time updating is on the primary thread.
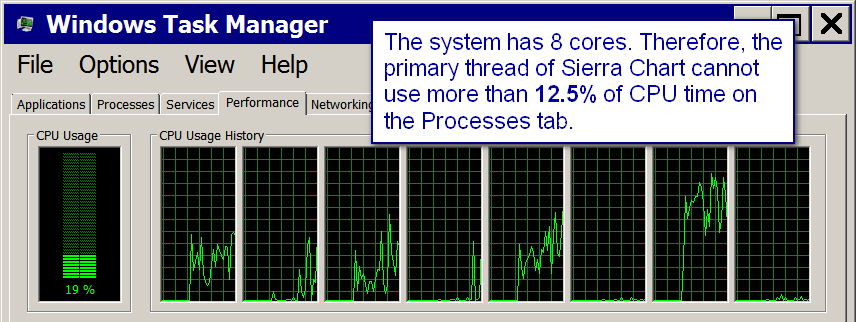
Go to the Performance tab of the Windows operating system Task Manager. Look at the CPU Usage History.
Make a note of how many windows there are showing CPU usage history. Refer to the image below.
Usually you will see anywhere from 2 to 8 windows. Each of these represents a CPU core. Divide 100 by the number of cores there are. This is going to be the maximum percentage a thread of a process can use. Make a note of this calculated percentage for the next step.
Look at the Processes tab of Windows Task Manager to determine the CPU load from the SierraChart.exe process. The CPU usage will be displayed in the CPU column which shows CPU usage by the process as a percentage.
If you see the SierraChart.exe process at or close to the percentage you made a note of previously, then Sierra Chart is under a very heavy processing load and Sierra Chart may not be processing real-time data fast enough. This can contribute to a data feed lag. If you notice the CPU usage is low, then the issue is not due to too much of a CPU load.
If it appears as though lagging or other slow performance issues is because your computer is not running Sierra Chart fast enough, then the next step is to review all of the solutions listed on this page
Long Time to Download Historical Chart Data
If it is taking a long time for the historical chart data to downloaded for a particular chart, then there can be more than one reason for this.
If you notice that Sierra Chart is in a frozen state and can not cannot be interacted with at times, then the issue is due to one of the other subtopics on this page. Refer to the list in the Introduction section.
Otherwise, this could be caused by a network connectivity problem. In this particular case, refer to Error when Downloading Historical Intraday Data from the Sierra Chart Historical Data Server. The solution could be to use Port 80 as explained.
Average Time to Open Chartbooks
The amount of time for a Chartbook to open depends upon how many charts are in it, the number of days being loaded in Intraday charts in the Chartbook, and the calculation time for studies.
A reasonably efficient Chartbook should open in less than 5 seconds. If a Chartbook is taking 30 seconds or longer to open, then this is considered a very long time and not acceptable under usual conditions.
The first thing to do is to refer to the following subsections on this page improve performance.
- 30.1 - Too Much Data Loaded
- 30.4 - Inefficient Advanced Custom Studies
- 30.8 - Antivirus/Anti-Malware Software
The next step is updating of your computer hardware. Your system should have a Solid State Drive, a 6 core CPU at a minimum, and a fast CPU clock speed.
30.40 - Dialog Windows Do Not Display
A dialog window is a window which contains various controls primarily to set global or chart specific settings. An example of a dialog window is the Chart Settings window opened with Chart >> Chart Settings. Another example is the Global Settings >> General Settings window.
When opening a dialog window in Sierra Chart, if it does not appear, then there can be different reasons for this. The first thing to do is to press the Escape (Esc) key on your keyboard to cancel the dialog operation so that you can interact with Sierra Chart.
The primary reason for this problem is the operating system level resources to create a dialog window are insufficient. This is an operating system level problem. It would help to close programs on your system. Also try reducing the number of open charts within Sierra Chart in particular detached charts which can be reattached to the main window. This can be done by going to the detached chart and selecting Window >> Detach/Attach Window.
This problem could also be because your computer or Sierra Chart is under a very heavy load, and prevents the dialog window from becoming visible. One thing you can do that should immediately reduce the CPU load is disconnect from the data feed by selecting File >> Disconnect. Also, increase the Chart Update Interval.
As a last resort you may need to restart your computer to overcome this issue with dialog windows not appearing.
Once again, this is a Windows operating system level problem and not some kind of problem within Sierra Chart itself.
In regards to the above, what we have found resolves the issue is force the immediate display of the dialog when it is opened. In the latest versions of Sierra Chart, this has been implemented for most dialogs but this causes the dialog to appear at the top left of the parent window rather than centered. If you continue to have this problem of the dialog windows not appearing, then let Sierra Chart know what particular dialog you are having a problem with and we will implement this workaround by forcing the immediate display of it.
Gradually the dialog windows in Sierra Chart will be replaced with a common resizable window to view and adjust settings. This is expected to be completed by June 2020. These new windows will not use the Windows operating system dialog functionality, and will be fully created by Sierra Chart and will work around this kind of issue.
30.41 - Slow Replay Due To Back Test Modes
When replaying a chart or charts, and the Replay Mode on the replay control panel opened with Chart >> Replay Chart >> Replay Chart (Control panel) is not set to Standard Replay, there will be a significant number of additional calculations which are performed during the chart replay which will increase CPU usage and cause the user interface to become less responsive.
If you are not performing any type of back testing of an automated trading system, then set the Replay Mode to Standard Replay.
You need to stop the chart replay first and start it again for any changes to the Replay Mode to go into effect.
30.42 - Detached Charts
We have observed that detached charts consume more operating system User objects and increase CPU usage. The reason for this would be strictly due to the operating system and is not related to Sierra Chart.
It is therefore recommended to keep charts attached and if you want to separate charts from the main window to instead use multiple instances of Sierra Chart. Refer to Using DTC Server for Data and Trading in Another Sierra Chart Instance (New Instances) for instructions.
30.43 - Bid and Ask Depth Bars Study
The Bid and Ask Depth Bars study potentially can use a lot of CPU time if there are many market depth levels it needs to process, like greater than 100. For instructions to reduce CPU usage for that study, refer to Improving Performance of this Study.
30.44 - Performance Differences Between Versions of Sierra Chart
If you seem to notice reduced performance in one version of Sierra Chart compared to another version, then understand that there can be many reasons for this.
First understand, reporting this to Sierra Chart support, in general is not helpful because we are not in a position to know what the cause is from. It would take an immense amount of analysis for us to really start to analyze this based upon what you are doing with Sierra Chart and your Sierra Chart configuration including its charts and studies and so many other things, including the software and configuration of your operating system and computer. This is simply something we will not do. So in general when we get these reports, they are almost never analyzed and are referred to this help topic.
If we are aware of a change in the program which may have some improvement in capabilities, but be more processing for that particular function, we will suggest that might be the cause. Although a change like this is very rarely the case.
In general newer versions of Sierra Chart deliver higher performance as compared to older versions because there are continuous performance enhancements that are made throughout the program. Therefore, a report of lower performance is completely contrary to what we know to be true. So that is why when someone mentions a performance issue in a newer version, we know that it must be something specific to their computer system / operating system or configuration and something unusual going on.
Now if you notice a performance issue after updating from a version 2 or more years ago, then yes it is possible there could be something that is less efficient perhaps may be related to formula processing due to more functionality available with that but this has been optimized as well. Although most likely, you are going to notice better performance in newer versions versus older versions. Most of the time this is the case.
You may be mistaken to believe the problem is with a newer Sierra Chart version, when the problem can be with your computer system itself. The capabilities of your computer system, and the current state of the system, can make Sierra Chart perform poorly. A possible solution is a restart of your system. We have heard this can resolve performance issues.
The particular configuration that you are using in Sierra Chart, related to the charts and studies and various other functionalities of the software, and the data loaded in the charts, could be on the margin of the capabilities of your system, and due to a small change in the structure of a new version of Sierra Chart, then makes the performance issue noticeable.
The more likely explanation for a performance issue allegedly related to a new version, is that over time there is an accumulation of data within your installation of Sierra Chart. There is more market data as time goes by, and there is more Trade Activity data.
Also, there are times when the market is more volatile and has a much wider range of prices as compared to previously. A wider range of prices absolutely does create more processing within Sierra Chart due to volume at price data processing.
And users will attribute version upgrades over time, with lower performance when in fact, the problem has to do with an increased amount of data that you have and the content of that data, creating lower performance as compared to previously.
Refer to the other items on this page to improve performance of Sierra Chart. The problem could also be what is explained in 30.8 - Antivirus/Anti-Malware Software. Security software on a computer system can treat a new version of Sierra Chart differently and possibly have a performance impact. We have seen issues like this in the past. Do not rule out this possibility because this is a very likely cause.
The issue could be caused by ACSIL Advanced Custom Studies. If so, run Sierra Chart in Safe Mode to prevent custom studies from being loaded and run.
To improve performance of the Chart/Trade DOMs, refer to Improving Performance of Chart / Trade DOM.
It is important to also understand Sierra Chart offers a broad amount of functionality and very advanced functionality. We offer Sierra Chart at very low prices. When you start doing a lot of things with the program, and creating a lot of charts and working with various studies and different configurations, you cannot expect us to be burdened with what you have done with Sierra Chart when you have a problem. This is for you to resolve. Not us.. Please understand that. We will not get burdened with users configurations.
This is why we have this page here to give you guidance on things to check. So it is a faulty analysis to think it is our responsibility to help you at no cost. We will not do that. You need to help yourself and we give you the information you need to help yourself through this page and the other documentation on this website.
From time to time we get reports from users after they update to a new version and they say they have a performance issue in that version. We are not able to reproduce that performance issue. And then later that same user will say they have updated again to the same version or to a later version and then say the performance issue is gone. And, yet we made no changes to resolve any performance issue which we could not identify to begin with. And of course, the overwhelming vast majority of other users, or all other users, are not having this same performance issue in that same version. You need to recognize performance issues are often system related. There are various circumstances where an instance of Sierra Chart can be affected by performance issues on your computer system.
An updated note: The Microsoft Windows operating system is in a state of deterioration. Microsoft at this point is a woke deranged company producing junk who has allegiance to tyrants. Longer term, they are on a course headed towards their demise (it could be many decades before this happens). This is one reason, Sierra Chart wants to create its own operating system. Microsoft operating systems are no longer serious or trustworthy. Many many years ago in the era of Windows 7, the Microsoft Windows operating system was stable and relatively decent although Windows has never been a high-performance quality operating system. As engineers we know Windows is of substandard quality, relative to Sierra Chart, and is not true high-performance quality at all. Although the Microsoft Visual C++ compiler is good, not referring to the development environment itself. In some ways Microsoft Windows is good with some of its core functions. But generally it is not good.
In the era of Windows 7 it was not very common for Sierra Chart users to be reporting problems. With the newer generation of Windows operating systems which are nothing more than a bunch of woke damn garbage, and we are being too polite here, there are all kinds of display issues users report. This is a whole new burden of reports. We cannot do anything about this garbage from Microsoft. It is very conceivable, that when you update Sierra Chart, the operating system is simply treating a new version of Sierra Chart differently and delivering you performance problems. To help resolve some of the problems, refer to 30.57 - Operating System and Hardware Changes to Improve Performance.
30.45 - Detailed Continuous Futures Contract Logging
When the Detailed Continuous Futures Contract Logging option is enabled, then this causes an excessive amount of messages to be added to the Message Log.
Disable this option to reduce CPU usage related to these messages, during the loading of a Continuous Futures Contract chart.
30.46 - Market Depth Combine Increment in Ticks
When using a Market Depth Combine Increment in Ticks in the Chart >> Chart Settings of 1 or greater, this can increase CPU load when there are a large number of market depth levels for the symbol, like over 100.
30.47 - Use Sub Instances to Distribute Processing Load
If you have charts open, especially ones that present a high graphics and/or calculation load, then you should run those in a sub instance of Sierra Chart to minimize the load on the main Sierra Chart instance which may be used for trading or may be causing Sierra Chart to be less responsive.
Use as many sub instances you need to distribute the load based upon the complexity of your chart setups and the number of charts and Chartbooks open.
For complete documentation regarding sub instances, refer to Using DTC Server for Data and Trading in Another Sierra Chart Instance (New Instances).
Additional things you can do to improve performance:
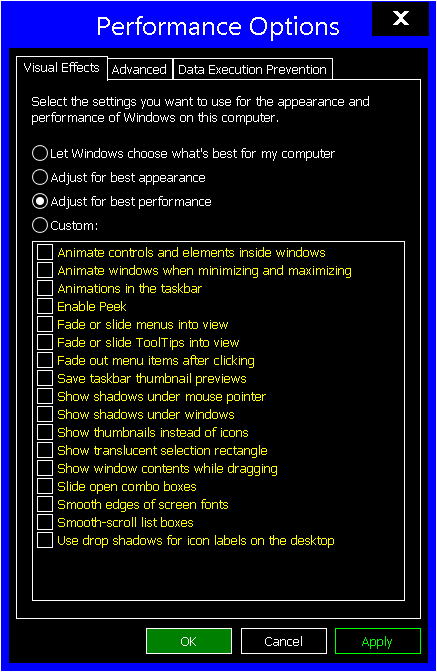
In your operating system control panel go to Control Panel >> System >> Advanced System Settings >> Performance >> Visual Effects and choose the Adjust for Best Performance option.
Upgrade the CPU with more CPU cores if you are using multiple instances of Sierra Chart. We recommend 8 or more cores. The more cores the better depending upon the number of instances of Sierra Chart you are running.
Use a dedicated NVME storage device/ drive. Refer to 30.29 - Solid State Drives.
30.48 - Basic Steps to Resolve Performance Issue in Sierra Chart
The following are the first items to go through, to resolve a performance issue you are having in Sierra Chart where the user interface is frozen at times or less responsive.
We need to make it clear, that Sierra Chart is a very powerful program that provides a lot of functionality and capabilities. Many of our users have many tens of or ~100 charts and a lot of complexity with those charts with the Chart Drawings and Studies on them.
The prices for Sierra Chart are kept very low. When a user has a performance issue in Sierra Chart, it is your responsibility to review the information on this page, and implement the recommendations and resolve this problem on your own.
We cannot be exposed to all of the complex set ups you have done over time and only you fully understand, and resolve this for you during a remote assistance session. We do not have the time, the inclination, or the resources for this and more importantly this is not included in the Sierra Chart prices. And besides this takes away time from our software development.
When the markets are more volatile, and there is a wider price range in a day, some studies can have longer calculation and drawing times. Although this depends upon the Input settings of the study. Studies that use the Volume at Price data will take longer to calculate and draw. This is one reason why you can notice a performance issue with increased market activity.
This would be resolved by reducing the number of days loaded in the chart, increasing the Tick Size of the chart, increasing the Tick Size related study Input like the Ticks per Volume Bar (Volume by Price study), using sub instances, increasing the Chart Update Interval, and obtaining faster computer hardware.
- First if Sierra Chart is in a frozen state for an extended time when opening your Chartbooks or upon connection to the data feed, then restart Sierra Chart, and disable Open Files on Startup on the Login window. Do not use your existing Chartbooks. For more details, refer to 30.16 - What to do if Sierra Chart is in a frozen state for an extended time due to extended high CPU usage caused by an automatically or manually opened Chartbook.
- Run Sierra Chart in Safe Mode. This is a mandatory step. Refer to the Using Safe Mode instructions.
- Select File >> Disconnect to disconnect from the data feed and make it easier to perform the following steps if you already have a significant performance issue. This is to eliminate the charts from updating and should have an immediate performance benefit while disconnected.
- Increase the global Chart Update Interval setting to 1000 ms. If charts have a nonzero Chart Update Interval less than this value, then set those to 0. For complete documentation, refer to 30.5 - Chart Update Interval.
- Use multiple instances of Sierra Chart to distribute processing load. Refer to 30.47 - Use Sub Instances to Distribute Processing Load.
Also refer to Sierra Chart Configuration for Most Low Response Time Trading. - Check study calculation times for each chart. Refer to 30.4 - Inefficient Study Configurations or Advanced Custom Studies.
The basic solution is going to be adjusting study Inputs appropriately which may reduce calculation time based upon the particular study and also reducing the Days to Load setting in the Chart >> Chart Settings. - In the case of studies that use Volume at Price data ( Volume by Price, TPO Profile Chart, Volume Value Area Lines, TPO Value Area Lines, Volume Weighted Average Price), to reduce calculation time it is recommended to increase the Tick Size setting of the chart. For example if it is .25, then increase it to 1.0 or higher. Even if you do not want to do this, do it anyway to see if it makes a performance improvement.
Alternatively, each individual study in most cases will have an equivalent setting. For example, with the Volume by Price study you would want to increase the Ticks per Volume Bar Input to 4.
For comprehensive information on this subject, refer to 30.23 - Chart Tick Size and Volume at Price Processing. - Increase chart bar spacing to reduce graphics load.
- Use OpenGL. If you have any issues with using OpenGL, then disable it and restart Sierra Chart.
- Increase the Intraday Data Storage Time Unit to 1 Second. For complete documentation, refer to 30.12 - Intraday Data Storage Time Unit. Historical Data Record Time Frame.. Be sure to re-download the data in the chart to store data at the larger unit which is more efficient. This will decrease Intraday chart data loading times.
- Install Sierra Chart on a dedicated solid-state drive. This is really important. Refer to 30.29 - Solid State Drives.
- There are other detailed items on this page covering specific subtopics to help improve Sierra Chart performance and reduce CPU usage. Refer to the Introduction section for the list of all of these.
- Use the Denali Exchange Data Feed for the most efficiently delivered and processed market data.
30.49 - Studies Recalculating at Earlier Index and Study Dependencies
There are some studies like the Zig Zag and High Low For Time Period studies which recalculate themselves at an earlier index as compared to the last bar updated in the chart during normal chart updating. Studies which are based upon or dependent some way upon the studies which are calculated that an earlier than normal index, will also calculate themselves at an earlier index.
Examples of dependent studies which could take more than an insignificant amount of calculation time would be the Spreadsheet Study, or the Color Bar Based on Alert Condition study. Although even these studies are generally efficient.
Depending upon the overall study configuration (the studies being used and their dependency upon each other), there can be an increase in calculation time.
To reduce calculation time it will help to reduce the Number of Rows Input with the Spreadsheet Study and also reduce Number of Bars to Calculate with the Color Bar Based on Alert Condition study.
30.51 - Very Large and/or Large Number of Trade Activity Files
Trade Activity data is stored in files contained within the /TradeActivityLogs subfolder in the Sierra Chart installation folder. Data is organized by Date and Trade Account. There are separate files for simulated and non-simulated trade activity.
If these files which are being queried are excessively large (in excess of 100 MB for a single file) or there are an excessive number of files, then depending upon the settings in a chart related to trade activity data, or the settings at the top of the Trade Activity Log, both of which query this data, these queries can take a long time, consume a lot of RAM memory on your system, and can affect the performance of Sierra Chart.
If there is a large OrderFillsToSend.data file, in the /TradeActivityLogs subfolder, then delete it. This will cause excessive memory usage and high CPU usage when starting and exiting Sierra Chart if it is a large file.
For example, when you start Sierra Chart and you do not open Chartbooks, if you see excessive memory usage and high CPU usage, this can be caused by a trade activity query being performed which is reading a large amount of data into memory based upon the Trade Activity Log settings.
Delete any unnecessary files in the /TradeActivityLogs subfolder. Also check the /Backups subfolder and remove TradeActivityLog_ files from that folder as well.
For more information, refer to Trade Activity Not Displaying or Clearing (Improving Trade Activity Query Performance).
To automatically delete Trade Activity files older than a specified number of days, use the Automatically Delete Trade Activity Log Files on Startup Older than Days setting.
30.52 - Recent Bid/Ask Volume | Current Traded Bid/Ask/Total Volume
When using the Recent Bid/Ask Volume or Current Traded Bid/Ask/Total Volume market data columns on a Chart/Trade DOM over time the number of price levels that data exists for these increases.
This potentially may be a performance issue if Sierra Chart has been running for many days, or if there has been a lot of market volatility.
To reset the size of these containers back to zero, to improve performance, assuming there is a performance issue, use the commands Clear Recent Bid/Ask Volume - All Symbols and Clear Current Traded Bid/Ask Volume - All Symbols.
30.53 - Causes of High Memory Usage
Below are links to the sections on this page for the different causes of high memory usage by the Sierra Chart process. Section 30.31 applies not to Sierra Chart specifically, but to the operating system.
- 30.1 - Too Much Data Loaded
- 30.10 - Short Bar Time Frames/Periods. Include Columns with No Data.
- 30.23 - Chart Tick Size and Volume at Price Processing
- 30.25 - Excessive Memory Use Caused By Time And Sales Records Setting
- 30.31 - System Memory Not Releasing
- 30.51 - Very Large and/or Large Number of Trade Activity Files
30.54 - Improving Chart Data Loading and Historical Data Downloading Times
Below are links to the sections on this page and elsewhere for the different causes and solutions related to long time to load chart data in the charts and long time to download historical chart data.
30.55 - System Power Management and Process Priority
Advanced CPUs in computers, have advanced power management. This power management, is controlled both by the operating system and by the system BIOS.
Power management settings, can have the effect of decreasing performance of the programs running on the system by reducing the available CPU resources to the programs.
Sierra Chart is also a very efficient program compared to other programs and therefore it may be allocated to a low-power CPU core causing its performance to be lower than what is possible on your system. It is possible that a new version of Sierra Chart where it provides higher performance and is more efficient, could actually run more poorly on your system because it is being allocated to a CPU core running at a lower speed or the CPU core for it reduces to a lower speed.
In your operating system control panel, go into Power Options and set the system for High Performance. You can also modify the details of the High Performance settings. The system BIOS may also contain various power management settings. Check those settings and adjust them as appropriate.
Additionally, it is also possible to increase the process priority of the Sierra Chart process. Follow the instructions below to do this.
- Open the Windows Task Manager.
- Select the Details tab.
- In the list of processes on the Details tab, select the SierraChart_64.exe process.
- Right click on this line, and select Set Priority. From the submenu select Above Normal. Do not use a process priority higher than above normal!
30.56 - Global Chart Values Tool / Global Cursor
There potentially is a lot of processing which can occur when using the Chart Values Tool. This can be the case based upon certain mouse/pointer input devices which cause a large amount of mouse/pointer movement messages to the program. Sierra Chart version 2583 has implemented optimizations to minimize processing with this Tool in these cases. Make sure you are running this version or higher.
Additionally when using the Chart Values tool, the horizontal and vertical lines are drawn with an Exclusive Or drawing mode. At the operating system level, this drawing method is much less efficient because the operating system has to create the color of every pixel of the lines based upon what is already on the screen. The efficiency of this is not within the control of Sierra Chart.
When using the Global Cursor, the processing of the Chart Values Tool increases. Therefore, if you do not need this functionality disable this option. Additionally, in version 2583 and higher there are optimizations to minimize processing when using the Global Chart Values Tool / Global Cursor.
30.57 - Operating System and Hardware Changes to Improve Performance
This is a list of Operating System configuration changes and Hardware configuration changes to improve performance of your system. We recommend these changes and this is what we do on all of our servers.
There is not a lot of detail here at this time on exactly how to do these. You will need to run Internet searches for information about how to do these for your specific operating system and hardware.
- Disable operating system paging file.
- Change operating system processor scheduling to give better performance for Programs versus background processes.
- Change power management for Maximum Performance.
- Disable virtual cores or hyperthreading on your CPUs. This is done through the system BIOS.
- Increase the amount of RAM on your computer system.
- Use a high-performance network router that has high throughput, in megabytes and packets per second.
- Disable any unessential operating system Services.
- Disable and remove any third-party security software. Disable any file scanning programs like antivirus programs. Disable any third-party security programs affecting network communication.
- In the Advanced System Settings, disable Visual Effects and use the "Adjust for best performance" option.
30.58 - Using Sierra Chart Timers for Faster Updates
Charts are updated through a timer. For complete details about how this works, refer to Global - Chart Update Interval.
Timer events can either be triggered by Sierra Chart and on a dedicated thread, or by the operating system. Operating system timer events, are throttled. Meaning, charts can update less frequently in some cases when using operating system timer events.
For more frequent chart updates, and more reliable chart updates, you need to use Sierra Chart timers. To enable Sierra Chart timers set Global Settings >> General Settings >> General >> Update Intervals >> Use OS Timer for Charts to No.
The disadvantage of Sierra Chart timers is that because charts are more faithfully updated according to the Chart Update Interval, if you are using too low of a Chart Update Interval and some charts have a high processing time, then this can cause freezing in Sierra Chart.
The following are the relevant settings with complete documentation.
*Last modified Wednesday, 19th March, 2025.