Features
Charting
Create and customize advanced and real-time Intraday and Historical charts for futures, stocks, commodities, indexes, mutual funds, currencies or any market.
|
Continuously updated charts as trades occur. Real-time tick by tick charting. Every trade received from the connected data feed is efficiently processed, stored and displayed, with none of them ignored. Charts scroll automatically as new bars are added. Ticks/trades can be stored as individual data records for highly precise charts. |
Complete technical analysis capabilities through the detailed and interactive charts, chart Drawing Tools, and Studies. |
Create Historical charts with a bar period of Daily, Weekly, Monthly, Quarterly, Yearly, or any number of days. Historical data for the charts is automatically downloaded from various supported services. The downloaded data is saved locally on your hard disk in a text format. You have the ability to easily edit the data, if necessary. Historical charts are updated in real time, so you always have a chart which is up to date with the latest trade.
|
Create Intraday charts with any bar period. The period can be less than 1 day or greater than or equal to 1 day. The bars can be based on any timeframe including: Seconds, Minutes, Hours, Days, Number Of Trades, Volume, Price Range, Delta/Difference Volume, Renko Value, Reversal Value.
|
High-performance Continuous Futures Contract feature with back adjustments. This feature allows you to instantly create continuous futures contracts without any additional data downloading, if the necessary futures data has already been previously downloaded, and optionally back adjust the data according to the rollover gaps between the contracts. This feature works with both Intraday and Historical charts. This feature works with all of the supported Data and Trading services including the Sierra Chart data services.
|
Detach chart windows from the main application window to place on multiple monitors.
|
Chartbook tabs. Chart window tabs. Spreadsheet window tabs. These tabs allow for direct selection of Chartbooks, charts and Spreadsheets.
|
Create watch lists of symbols that can be easily iterated through or selected.
|
Replay one or more Intraday charts at any speed and from any point in time in the available chart data. The replay speed can be anywhere from .1 to 100,000 times the normal speed of real-time data. You can perform simulated trading or back testing during the replay if you require. There is no need to have recorded the data previously. The replay feature can be used easily at any time. When replaying multiple charts, they stay synchronized with each other.
|
Multiple Monitor Support. Charts can be displayed on multiple monitors.
|
Advanced TPO Profile charts (also known as Market Profile). This is a powerful and interactive feature which provides a method of performing market analysis based upon the amount of time that price trades at particular price levels. TPO stands for Time-Price Opportunity . With TPO charts, you are able to analyze the amount of trading activity, based on time, for each price level the market traded at for any given time period.
|
Fully adjustable subregions within each chart window.
|
Fully customizable Vertical and Horizontal chart grids that can be hidden.
|
High-resolution chart Printing.
|
Linear or Logarithmic scale and many different Scale Range types.
|
Left side scale display on the charts. This can be enabled by selecting:
|
Display graph values for any point in the chart using the Chart Values / Crosshair tool. Use the Global Cursor feature to see the crosshair on all charts at the corresponding location. You can choose to synchronize charts, which automatically scrolls charts to the corresponding location. You can synchronize all charts or linked charts.
|
Chart Linking. Establish links between specified charts. Link the Symbol, Bar Period, Scroll Position and/or Session Times.
|
Graph Draw Types for charts include:
|
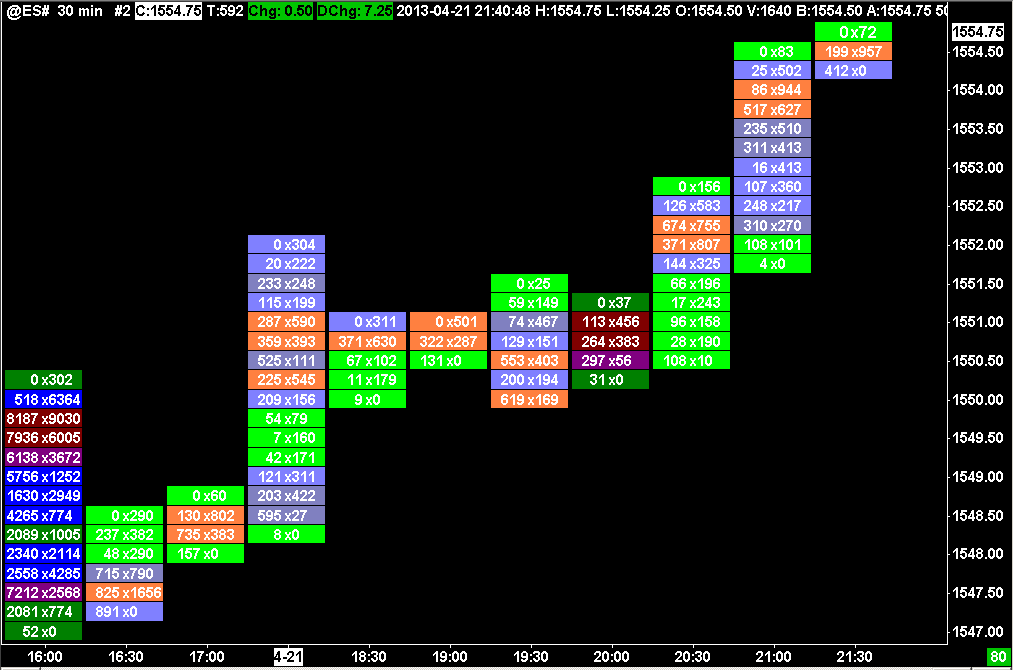
A Numbers Bars study to display numerically the Volume, Ask Volume, Bid Volume, Ask Volume and Bid Volume difference at each price level within each chart bar. Expansive color coding and volume profile display capabilities are supported.
|
Chart templates. You can also instantly Duplicate a chart to the same or another Chartbook. |
Customize colors for the chart graphics.
|
Load and work with an unlimited number of chart windows and Chartbooks. The Chartbooks can be saved to disk and loaded with all of your previous settings. Chartbooks are saved workspaces that contain all of your charts and related windows and the settings.
|
You can capture your charts or desktop and upload the images to be shared with others or for your own reference. |
Ability to adjust the Time Scale on charts to your local time zone or whatever time zone you require. Each chart can use its own independent time zone.
|
Ability to load multiple symbols into the same chart window. This provides a multiple symbol type of chart. All of the built-in studies can be based on those additional symbols. Arithmetic studies can be used to perform various calculations involving the historical data of multiple symbols.
|
Many more Features. This Features page only provides a general overview of the functionality available. |
Trading
Complete and Advanced Trading Functionality: Enter orders, view orders, manage orders, and view positions from a Trade Window, Chart, Chart DOM or standalone Trade DOM. Advanced Trading from the charts.
|
Advanced and highly configurable Trading DOM providing complete trading functionality. The order columns support entry of Limit, Stop, Stop-Limit, and Market if Touched orders. All other Order Types can be entered through the attached Trade Window or through the right-click Trade menu. The Trading DOM is fully configurable. You can set the colors, what columns to display and their order.
|
The Chart and Trade DOM/Order Entry Ladder can contain configurable market data columns. These columns include Bid and Ask Market Depth, Last Trade Size, Cumulative Last Trade Size, Profit and Loss, Recent Bid Volume, Recent Ask Volume, Current Traded Bid Volume, Current Traded Ask Volume, Current Traded Total Volume, Market Depth Bid/ Ask Pulling and Stacking. These market data columns can also be displayed independently of the order entry columns on either the Chart or Trading DOM. You can set the colors, what columns to display and their order.
|
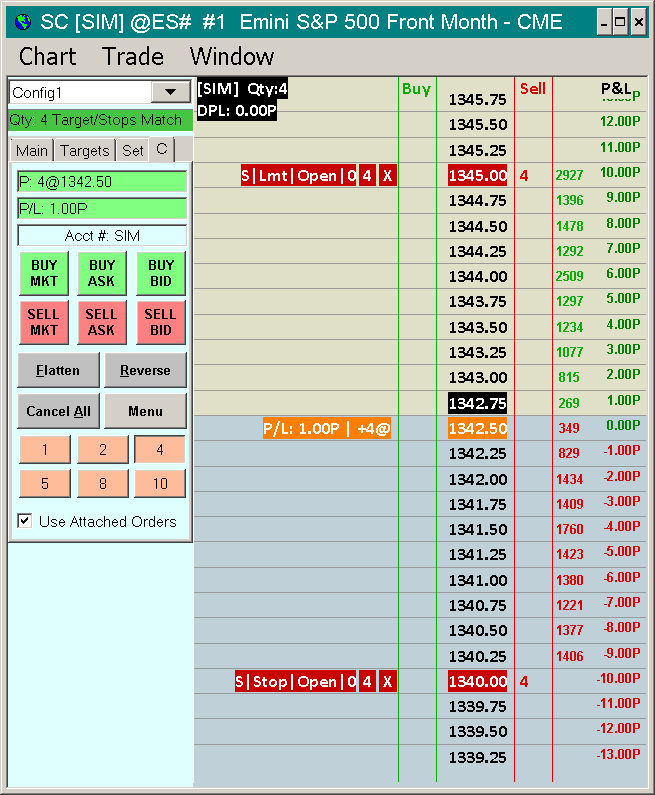
Advanced chart based trading interface (Chart DOM) which is a fully functional Trading DOM on the charts that functions just like a traditional trading DOM with optional market depth and other market data columns display. It supports entry of Limit, Stop, Stop-Limit, and Market if Touched orders. The Chart DOM is fully configurable. You can set the colors, what market data columns to display and the column order.
|
Advanced chart based trading interface for trading directly from the charts. Enter orders, modify orders, cancel orders and view Orders and Position in relation to the chart bars.
|
Advanced Trade strategies including: Targets, Stops, numerous types of Trailing Stops, and Move to Breakeven Stops, all fully managed with OCO functionality and automatic quantity management (Advanced Trade Management). Targets and Stops can be automatically entered when submitting the parent order or after.
|
Order types supported:
|
Trading Scale In and Scale Out functionality.
|
Create Automated Trading Systems based on your own custom criteria using Spreadsheets or the Advanced Custom Study Interface and Language. Spreadsheets provide a rapid and simple means of creating an automated trading system. |
Advanced and complete Trade Simulation. Trade simulation can be used during chart replays or with live market data. All of the Sierra Chart trading functionality works in the Trade Simulation Mode
|
Complete Trade Activity logging through the Trade >> Trade Activity Log. This window provides the ability to generate Trade Statistics with various performance related fields, a Trades list, and other performance reports for any period of time and based on other filters.
|
High speed back-testing with detailed trade reporting. Tick by tick back testing is supported. |
Support for multiple trade accounts if the connected Trading service supports multiple trading accounts on the logged in username. All of the available trade accounts are automatically discovered on the logged in trading account username and can be easily selected from a drop-down list through the Trade Window on a chart or Trade DOM. |
For supported Trading services that provide OCO (order cancels order) and/or bracket order functionality on the server side, Sierra Chart uses this server side functionality for the greatest safety for OCO and bracket orders. |
When you are trading the foreign exchange markets on Sierra Chart you have a trading environment which is more powerful than typically what is offered in Forex trading platforms. Easily visualize where you want to enter an order in relation to the current price and the historical prices by using the Trade DOM or Chart DOM. There is a full view of the depth of market. There is a single Position for every Forex pair. There is no need to be concerned with all of the smaller trades which make up the larger Position. When you want to flatten the Position or reverse, it is a simple one step procedure. Chart based trading is easy, straightforward, and flexible and provides all of the capabilities needed for advanced trading. |
Many more Features. This Features page only provides a general overview of the functionality available. |
Studies And Indicators
Over 400 fully customizable technical studies and indicators. For the current list of available studies and indicators go to Analysis >> Studies within Sierra Chart. Sierra Chart offers an Advanced Custom Study Interface and Language. This allows us or users to add studies very rapidly. There is also a large library of custom studies developed by other users that you can use.
|
Each study has inputs to modify the variables of the study. Various Draw Styles are available and can be customized for each subgraph of a study. Draw Styles include transparent styles as well.
|
Specify simple or advanced Alert Conditions on studies and the main price chart for continuous monitoring and scanning across a list of symbols. Alerts can play a sound, are logged, are displayed on the chart, and an email message can optionally be sent. Alert conditions can reference multiple studies on the chart and are specified using very flexible and powerful Excel type formulas. You have access to all of the available Excel operators and functions.
|
Color or paint bars based on any condition formula using the Color Bar Based on Alert Condition study. The condition formula can reference multiple studies on the chart. This condition formula is specified using the same Simple Alert formula you use for Alerts. There is also the Color Background Based on Alert Condition study that will color the background of the bars where your condition formula is true. |
Create your own custom studies, indicators, trading systems, and other analysis methods using the built-in Excel/Calc compatible Spreadsheets or use the powerful Sierra Chart Advanced Custom Study Interface and Language.
|
Take advantage of custom indicators and trading systems developed by other users or third-party developers. |
Receive e-mail notifications for any condition in Sierra Chart that plays an alert sound. This includes: Spreadsheet alerts, study alerts, trading conditions that play alerts, Chart Drawing alerts and Advanced Custom Studies that play alert sounds. |
Point and Figure, Three Line Break, Kagi, Heikin Ashi chart types supported. Point and Figure charts support the traditional X-O bars and the more practical Open High Low Close bars for a more detailed view. |
Volume by Price study for detailed volume analysis at each price level across any timeframe. Numerous and customizable time frames are supported. Sierra Chart maintains detailed Volume at Price data based upon the underlying data in the chart data file for the symbol when using the Volume by Price, Volume Value Area Lines, and TPO Profile Chart studies. This provides for 100% accurate and stable volume analysis across any timeframe per bar when using any of these studies.
|
Overlay multiple price graphs into a single chart. |
Base a study on another study with the Based On setting for studies. This provides a simple method to create studies based on other studies. For example, you can apply Bollinger Bands to a Stochastic. |
Display graphs in the chart for Volume, Open Interest, and Number of Trades per Bar. |
Spread and comparison charting. |
Add any number of studies to a chart. You can set the region to display a study in.
|
Save a configured collection of studies and apply them to a chart with one step.
|
Built-in Excel and Calc compatible Spreadsheets for containing continuously updating quotes, for creating custom studies, alerts and trading systems, or for general Spreadsheet use. Most Excel functions are supported. Supports simple and advanced formulas, and cell formatting.
|
A Variable Period Pivot Points study which calculates Pivot Points anywhere from 1 minute to 1 Year on any chart bar type.
|
Overlay Studies or primary price graphs from different timeframes or symbols onto a single chart. There is no limit to the number of overlays. For example, you can overlay 10 minute price bars on a 1 minute chart. Or you can overlay a Moving Average-Simple study from a 10 minute chart onto a 1 minute chart or do the reverse and overlay the moving average from a 1 minute chart onto a 10 minute chart. There is no limit to the possibilities. More information. |
Market Depth data display on charts. This includes the DOM Graph. And Market Depth studies: Market Depth Historical Graph study and Bid & Ask Depth Bars study which provides an indication of bid versus ask depth. Custom studies also have complete access to current and historical market depth data.
|
The Study Summary window provides a table view of the Study Subgraphs of studies in the charts in the open Chartbooks. The full set of Quote Board fields is supported as well in the same window. This functionality provides a radar screen type of view.
|
Many more Features. This Features page only provides a general overview of the functionality available. |
Drawing Tools
Complete set of Chart Drawing Tools and functionality. Tools include:
|
Chart Drawing Modification Functions include:
|
All Drawing Tools can be fully customized. Each drawing tool has 8 custom configurations which can be selected through the menu, the Control Bar buttons or keyboard shortcuts. These apply a preconfigured configuration to a Drawing Tool to be used.
|
Ability to Undo and Redo Chart Drawings drawn with a Tool. |
Set an Alert Condition on most Chart Drawings drawn with Tools (Lines, Rays, Horizontal/Vertical Lines, ...). When the Alert Condition becomes TRUE, a text and audible alert is given. An email, SMS, Twitter notice can also be sent indicating the particular alert.
|
True support for Chart Drawings on a Logarithmic scale. These drawings are drawn bar to bar and will fit the prices precisely and correspond with their location as if the scaling was set to Linear. You are able to select any point along the Chart Drawing with your Pointer and right click it any point on the Chart Drawing to bring up a menu specific to that particular Chart Drawing. |
Many more Features. This Features page only provides a general overview of the functionality available. |
Performance
Solid professional quality software. Designed for efficiency and ease-of-use. It has a straightforward and well-designed interface that can handle the most demanding applications. It is developed by an experienced and competent development team that stays on top of development. It has been proven and trusted by investors/traders/clearing firms for more than a decade. |
Automatically reconnects to the Data and Trading servers if there is a lost connection. |
CPU multi-core support for increased performance with historical data downloading, Chartbook loading, streaming market data processing, Intraday chart data file and market depth data file writing, network input and output, and Trade Activity Log records storage and retrieval. A CPU core can run one or two program threads at the same time. It will run two threads if it supports hyperthreading. A thread is a unit of execution within Sierra Chart.
|
Complete and detailed online and up to date documentation with numerous images.
|
Historical Intraday data is loaded from the local data file on a background thread for supersmooth and faster loading of data. This means the user interface is never busy during the loading process when opening an Historical chart or Intraday chart or Chartbook and this takes advantage of multiple CPU cores. Historical Intraday data downloaded from Data or Trading services that use the Sierra Chart server software/systems, is downloaded on a background thread also for faster and smooth performance. |
Sierra Chart is a stand-alone software program for Windows operating systems. We are working to add native support for Mac OS and Linux. This is an ongoing task. |
High quality and well engineered charting and trading software. |
Sierra Chart is written entirely in C++ with a focus on high performance in all areas of the program. This language has proven itself to be very fast. Sierra Chart does not use Java or .NET. Sierra Chart is high-performance code. All professional and serious applications where performance is critical, are developed in C++, the true development standard. .NET is a proprietary Microsoft technology that has high memory and performance overhead. Professional programmers use and trust C++. For example, consider web browsers, all the major web browsers are developed in C++. For the highest reliability and performance, a C++ based application is the only choice. Sierra Chart is a standalone high-performance program which you download and install and runs on your operating system (Windows, Linux or Mac OS). It has direct native integration to the operating system in the case of Windows. This gives you the highest degree of performance, stability and security possible. It is not web-based. |
Sierra Chart does not use the Windows registry in any way. |
Portable application. All program files, data files and configuration files are installed into the folder and sub-folders where Sierra Chart is installed to. Very easy to uninstall or relocate. Sierra Chart can easily be installed to a removable drive.
|
Multiple CPU processor/core support by running multiple copies of Sierra Chart at same time on a system. Each copy of Sierra Chart can share the data from other copies. One copy can act as a master, and the other as slaves. The most significant CPU load usually comes from charting, so slave copies can be dedicated for advanced charting purposes. Multiple back tests can be run by using multiple installed copies of Sierra Chart. You are able to install and use as many copies of Sierra Chart as you want on a system. Refer to Using Multiple Data and Trading Services at the Same Time. |
Widely known for its stable, open, and highly customizable design. Sierra Chart provides a wealth of functionality. All of which is stable and well engineered. Sierra Chart is developed by a team of highly experienced engineers with impeccable standards and who which continuously strive to design everything in the best possible way for the greatest stability and performance. |
No annoying pop-up windows which require acknowledgment. All messages from the program are organized into Log windows which do not interrupt the flow of user input. These log windows can be provided easily to Sierra Chart support for assistance without having to type or communicate the details of information or error messages because the Log windows contain the actual messages. |
The user interface of Sierra Chart uses a straightforward, well-organized, consistent and stable design. We do not believe in major changes with the user interface in order to provide consistency and familiarity for users. This is unlike Microsoft which has made numerous disastrous and harmful mistakes with their continuous changing of the user interface of the Windows operating system and their other programs which have caused major problems, frustrations for users and have rendered existing Windows user interface related documentation out of date. The internal architecture of Sierra Chart is well organized, very well programmed, stable and designed for maximum performance always. |
Fully touchscreen compatible. All interfaces of Sierra Chart can be interacted with completely with a touchscreen including manipulating Chart Drawings and orders on a Chart or Trading DOM Ladder. |
All file operations in Sierra Chart or file operations which involve trading, are all handled on a separate thread and with temporary memory caches so the operating system/hardware file system does not cause any slow down to the main thread of Sierra Chart. The exception to this in some cases, but not all, is the writing of historical daily bar data which is a fast operation. And when using Data/Trading services which Sierra Chart obtains historical data from outside of the Sierra Chart historical Data services. This is why it is always important to use Sierra Chart provided Data services. |
Sierra Chart does not use any prebuilt components. We build everything from scratch including the spreadsheet functionality. The only libraries we use relate to compression and encryption and XML and JSON parsing. The XML and JSON parsers, are just header files. We have the source code for compression functionality and encryption functionality. These libraries are built specifically for Sierra Chart. Sierra Chart works directly with the Windows API and uses the most minimal set of functions from that API. |
Sierra Chart uses numerous market data servers in many geographical locations. Sierra Chart will have multiple connections for market data at any given time. This provides a high degree of redundancy and decentralization. |
Supports low bandwidth connections, like satellite connections, through data compression. Can configure real-time data transmission interval. Proven connectivity on satellite connections including aircraft Wi-Fi. |
Many more Features. This Features page only provides a general overview of the functionality available. |
Data
All Sierra Chart service packages include a Real-Time and Historical Forex and CFD data service. Some packages include Historical Daily and Intraday data for stocks, futures, indexes, Forex, and mutual funds. |
Supports numerous external Data and Trading services as well as our own data services. This gives you access to many brokers and clearing firms throughout the world. We offer a complete trading and charting platform that you can use with most any broker that you choose. It is a trusted platform that is continuously being improved. It is offered at low prices to everyone.
|
Sierra Chart provides its own Market Statistics data feed that can be used alongside any supported Data or Trading service, to receive various market statistics for several exchanges and indexes.
|
Ability to correct errors in charts yourself without having to request a correction from the Data service.
|
Offline analysis. Chart data can be displayed at anytime whether you are connected to a Data or Trading service or not, since all data downloaded and received is stored locally on your computer. |
Display prices in any decimal or fractional format.
|
Time and Sales Window.
|
Complete data management functions including adjusting for stock splits, adjusting price and volume, adjusting for futures contract rollovers and mutual fund distributions, and adjusting Dates and Times.
|
Intraday Data Editor for easy correcting of errors in an Intraday chart.
|
Reads, charts and can automatically update Text/CSV/ASCII Historical Daily data directly. Imports Text/CSV/ASCII Intraday data and CQG Time and Sales data.
|
Use the powerful Find Symbol window to get a listing of the available symbols for any particular Data and Trading service and to search for additional symbols |
Many more Features. This Features page only provides a general overview of the functionality available. |
*Last modified Monday, 07th January, 2019.