Trade Activity Log
- Notes About New Trade Activity Log Window
- Viewing Historical Trade Activity
- Controls
- Menu Commands
- File >> Save Log As
- File >> Export
- File >> Import
- Edit >> Copy All
- Edit >> Copy Selection
- Edit >> Clear
- Edit >> Refresh Log
- Edit >> Disable Statistics, Trades, Period Tabs
- Edit >> Disable Trade Activity Log
- Trade Activity Data Editing Menu Commands
- Edit >> Flat to Flat Display for Trades List
- Edit >> Use Last In First Out Fill Matching
- Edit >> Filter Initial Fills Part of Existing Position
- Edit >> Descending Display Order
- Edit >> Include Blank Symbol and None Account in Current List
- Edit >> Include Begin/End Indicators in Trades List
- Window >> Always On Top
- Window >> Close Log
- Window >> Hide All Trade Windows
- Window >> Trade Orders Window
- Window >> Trade Positions Window
- Window >> Trade Account Monitor
- Trade Activity Field Descriptions
- Date-Time of Trade Activity Log Entries
- Saving the Log
- Clearing Trade Activity Data
- Clearing Trade Activity Data Through Files
- Column Widths and Font
- Trade Activity Fields
- Missing Order Fills from Trade Activity Log
- Missing Trade Activity
- Automatic Insertion of Missing Order Fills For Non-Simulated Trading
- Determining Historical Trade Position Quantity from Trade Activity Log
- Trade Data Chart Studies
- Providing Trade Activity Log Data Lines to Support
- Providing Trade Activity Log File to Support
- Restoring Backups of Trade Activity Logs
- Profit / Loss Calculations and Symbol Settings
- Importing and Exporting Data
- Trade Statistics Tab
- Trades Tab
- Overview
- Basic Instructions
- Flat to Flat Trade Display
- Reversing Display Order
- Trades Fields Descriptions
- Symbol
- Trade Type
- Entry Date Time
- Exit Date Time
- Entry Price
- Exit Price
- Trade Quantity
- Maximum Open Quantity
- Maximum Closed Quantity
- Profit/Loss
- Cumulative Profit/Loss
- Flat to Flat Profit/Loss
- Entry Efficiency
- Exit Efficiency
- Total Efficiency
- Maximum Open Profit
- Maximum Open Loss
- Flat to Flat Maximum Open Profit
- Flat to Flat Maximum Open Loss
- Total Profit/Loss
- Notes about Maximum Profit and Loss Fields
- Commission
- High Price While Open
- Low Price While Open
- Note
- Open Position Quantity
- Close Position Quantity
- Period Trade Stats Tab
- Trade Statistics for Charts Tab
- Account Statistics Tab
- Order Fill Matching and Flat to Flat Definition
- Questions About the Trade Activity Log Data
- Basic Analysis Procedure for Trading Question/Issue
- Profit/Loss Calculation Rounding Error
- Understanding Daily Trade Statistics Reset Time
- Understanding and Setting the Start Date-Time for a Trades List
- Automatically Aligning First Loaded Order Fill to Beginning of Position
- Trade Activity Not Displaying or Clearing (Improving Trade Activity Query Performance)
- Solving Trade Activity Incorrect Price Formatting and P/L Values
Notes About New Trade Activity Log Window
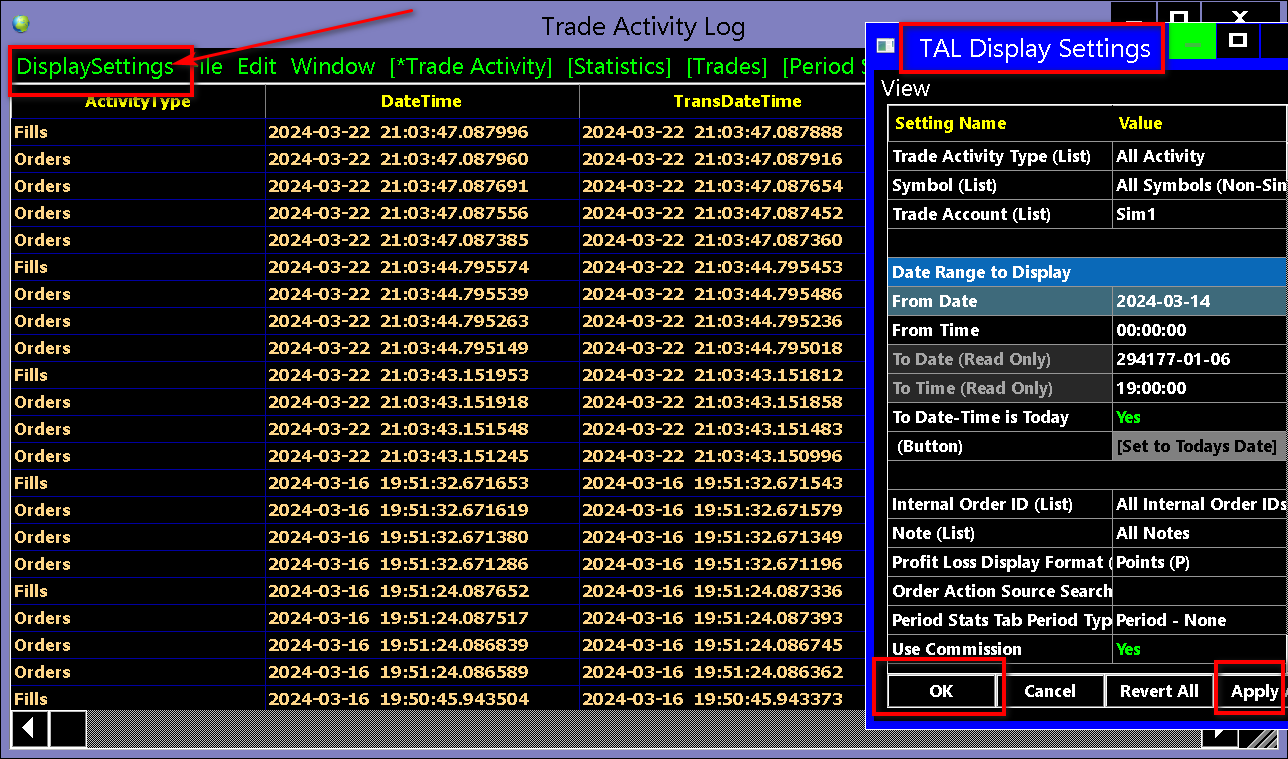
Newer versions of Sierra Chart use a different interface for setting what is to be displayed on the Trade Activity tab of the Trade Activity log and also affects other tabs which use the order fills from the first tab.
To access the settings, click on the DisplaySettings menu command on the Trade Activity Log window. The documentation on this page, still needs to be updated regarding this. Set the settings as you require and then press OK or Apply. Just one or the other.
These changes are to support the move away from Microsoft MFC in Sierra Chart which is critical task for us.
There were problems with the old interface. Sometimes settings you would set actually were not getting applied. This must have been a problem at the operating system level.
There is also more functionality that can be implemented this way with settings because there is only so much room at the top where the controls were previously. That was always an ongoing issue.
In an upcoming release we are adding text on the title bar of the Trade Activity Log the currently set settings. So you can visually see how the controls are actually set in a compact way at any time without opening the associated Settings window. The current query count, is already shown there if it is nonzero.
The settings window can be continuously open. And resized and moved off to a corner or the side.
And for some additional background information it is fairly recent that the "Apply" button, was added to the top of the Trade Activity Log due to various associated issues, with updating the log upon changes of the settings. There was just way too much complexity and inherent problems with this. And there simply is insufficient room to contain all of the necessary controls at the top of the log.
Viewing Historical Trade Activity
To open the Trade Activity Log, select Trade >> Trade Activity Log on the menu.
The Trade Activity Log logs trade order Activity and trade order Fills. Whenever there is a new trade order or a change with the order status (Status field in the Trade >> Trade Orders Window) of an existing order, there is a new line added to the Trade Activity Log. And there is a new line added whenever an order fills or partially fills. There is a separate line for each individual fill.
The Trade Activity Log is very useful to analyze precisely what has happened with a particular order and the source of all actions on that order. Every time the Status of an order changes, the prices of the order change, the quantity of the order changes, there is a change with any of the order identifiers, or there is an order fill, then there is a separate line added for the order in the Trade Activity Log.
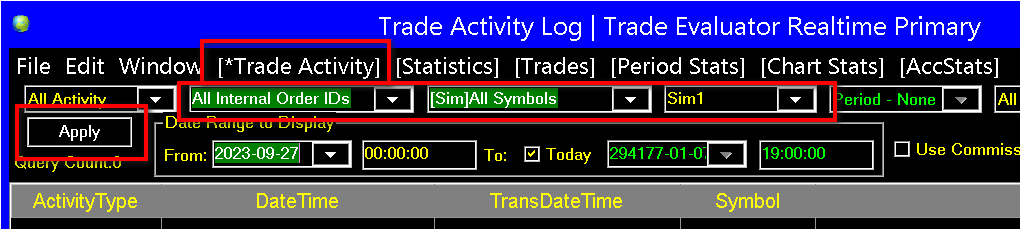
To determine all of the actions on an order, be sure to select All Activity in the list box at the top of the Trade Activity Log, containing these options. In the log itself, the field Order Action Source indicates what the source of the action on the order was. This field also provides other useful subfields of information. For additional information related to this field, refer to Determining the Origin of a New/Modified Order and the related Video.
In the case of Non-simulated trade activity in the Trade Activity Log, this trade activity is added to the log based on real-time order events received from the Trading service you are connected to and historical order fills and order data (if available) downloaded when connected to the Trading service. It is important to be aware that there can be missing order fills. For more information, refer to Missing Order Fills from Trade Activity Log.
- To view the Trade Activity Log, select Trade >> Trade Activity Log.
- Select the Trade Activity tab.
- Make sure Edit >> Disable Trade Activity Log is unchecked/disabled.
- From the Trade Activity Log menu at the top, click on DisplaySettings.
- In the Settings window, select the type of Trade Activity that you want to display, from the drop-down of Activity Types. This can be Orders, Fills, Positions, Account Balance, or All Activity.
- In the list of symbols select the symbol that you want to display trade activity for or manually type it.
In the case of simulated trading when using Sierra Chart Trade Simulation Mode, the symbol is prefixed with [Sim]. So you must select the symbol that has [Sim] in front of it to see simulated trading data. - To display non-simulated Trade Activity data for all symbols, select All Symbols (Non-Sim) in the list of symbols. This is Trade Activity with the external Trading service Sierra Chart is connected with.
To display simulated Trade Activity data for all symbols, select [Sim] All Symbols in the list of symbols. Simulated Trade Activity data is simulated Trade Activity recorded when Trade >> Trade Simulation Mode On is enabled. - In the list of Trade Accounts, select a particular Trade Account that the orders belong to. Or select All Accounts. This account must match the account used on the Trade Window for the Chart or Trade DOM the orders originated from. All simulated trading accounts are in the format Sim#.
For performance reasons, not all Trade Accounts are going to be listed if there are a lot of Trade Accounts, or if the history for a Trade Account is not recent. You just need to manually type the Trade Account into the box at the top of the Trade Accounts list box. - In the list box containing Internal Order IDs, select All Internal Order IDs unless you want to display only Trade Activity for a particular Internal Order ID. In that case select the particular Internal Order ID you want to display.
- Set the Date-Time controls in the Date Range to Display section to the Date-Time range that you want to display. It is essential that the From Date and Time corresponds to a point in time where the Position for a particular Symbol and Trade account was flat in order for there to be correct generation of Trade Statistics and Trades.
In the case of the Date field, either select a date from the list or manually enter one in the format YYYY-MM-DD. In the case of the Time field, manually enter the time in 24 hour format (HH:MM:SS).
For further details, refer to Understanding and Setting the Start Date-Time for a Trades List. - Press the Apply or OK button to apply any changes to the filter settings at the top of the Trade Activity Log.
Upon pressing the Apply or OK button, a background query for the data will be made and then will be displayed in the log list below. If this query does not complete within 5 seconds (normally less than a second), then refer to Trade Activity Not Displaying or Clearing (Improving Trade Activity Query Performance).
For field descriptions, refer to the Trade Activity Fields section.
Controls
This section documents all of the controls and menu commands on the Trade Activity Log. These are located at the top of the Trade Activity Log and on the menu.
Orders | Fills | Positions | Account Balance | All Activity Filter
This list box filter allows you to display Orders, Fills, Positions, Account Balances, or All Activity (all trading related activity).
Order Activity is the details of an order every time the order status changes, the order quantity changes or the price changes. New orders are also logged.
Fill activity is the details of a fill when an order fill occurs. One thing to understand about Fill entries in the Trade Activity Log is first there is an order update indicating a fill. In this case there will be an entry, with the ActivityType set to Order. And then there will be another second entry specific for the fill with the same Order Action Source field, with the ActivityType set to Fill.
Positions activity is every time there is a change in position quantity for a Symbol and Trade account.
Account Balance activity is anytime there is a change with the cash balance for the Trade Account but this is only used with trading services where Sierra Chart fully provides the server-side functionality. At this time it is only used with the Futures Trading Evaluator service.
Note: In the case of a fill, the Fill Price field is the price of that specific fill. In the case of Order Activity, the Fill Price field is the average price of all of the fills, if any, for the order at the time of the logging.
Internal Order ID Filter
This list box lists all of the Internal Order IDs that have Order and Fill activity available in the Trade Activity Log.
Select All Internal Order IDs unless you want to display only Trade Activity for a particular Internal Order ID. In that case select the particular Internal Order ID you want to display.
Symbol Filter
This list box lists the Symbols that have Order and Fill activity available in the Trade Activity Log. Select All Symbols (Non-Sim) to display Trade Activity for all non-simulated symbols. This filter also applies when using the Trading Evaluator services.
There is a performance optimization related to filling this list of symbols. The symbols are discovered from the Trade Activity files. Only those files, with dates in the recent months, will be scanned. This greatly improves performance. A symbol that is not listed can be manually typed in.
Select [Sim] All Symbols to display Trade Activity for all simulated symbols. This applies to trading performed when Trade >> Trade Simulation Mode On is enabled. Or, select a specific symbol to display only trade activity for that particular symbol.
Usually non-simulated symbols are for live orders. However, if you are connected to a simulated trading account with your Trading service, the these will actually be simulated orders. However, to Sierra Chart they would be considered live/non-simulated orders.
Symbols with [Sim] in front of them will display Trade Activity data for orders which are simulated and processed internally in Sierra Chart. This also includes Order and Fill Trade Activity for orders which were submitted from a chart or charts that were replaying or during an automated trading system Back Test.
These are simulated orders only because only simulated orders are possible when a chart is replaying or there is a Back Test being performed.
Trade Account Filter
This list box lists all of the Trade Accounts that any Trade Activity available in the Trade Activity Log for the account.
Select All Accounts to display Trade Activity for all trade accounts.
Simulated accounts begin with Sim.
This list box is not going to list the available trading accounts for the logged in Username until such time there is trading activity on those accounts and that activity has been logged.
Note Filter
This list box lists all of the notes (Text Tags) that have been entered and available in the Trade Activity Log. This allows for filtering based on the Note.
Select All Notes unless you want to display only Trade Activity that has a particular note. In that case select the particular note you want to display.
The Notes are created by entering a Text Tag on the Trading Window for the chart. For more information, refer to Text Tag.
Date Range to Display
the From >> Date and Time and To >> Date and Time controls set the period of time of the trade data to display on all of the tabs of the Trade Activity Log (Trade Activity, Trade Statistics, Trade, Period Stats).
Set these controls to the period of time that you want to display and press the Apply button to apply the changes.
In the case of the Date field, either select a date from the list or manually enter one in the format YYYY-MM-DD. In the case of the Time field, manually enter the time in 24 hour format (HH:MM:SS).
It is essential that the From Date and Time corresponds to a point in time where the Position for a particular Symbol and Trade account was flat in order for there to be correct generation of Trade Statistics and Trades.
For further details, refer to Understanding and Setting the Start Date-Time for a Trades List.
The From >> Date and Time and To >> Date settings are used to filter data based upon the Date-Time field of each trade activity entry. You need to keep in mind that when you are performing a chart replay, that all trade activity being recorded uses the Date-Time of the time being replayed and not the current time. So you need to keep that in mind when setting the From >> Date and Time setting.
Use Commission
The Use Commission checkbox on the Trade >> Trade Activity Log applies a round turn commission per quantity 1 for the Profit/Loss calculations on the Trade Statistics, Trades and the Period Trade Stats tabs of the Trade >> Trade Activity Log.
The actual Round Turn Commission currency value is set through Global Settings >> Symbol Settings for the symbol or symbol pattern. Select the Round Turn Commission value in the list of settings for the symbol or symbol pattern selected in the Symbols list in the Global Symbol Settings window.
Be sure to enable the Use Custom Symbol Settings Values option in the Global Symbol Settings for the Round Turn Commission value you have set to actually get used.
The currency of the commission value can be any currency and should be denominated in the currency of the symbol.
Since this is a round turn commission, it applies for every 2 units of the total filled quantity for a Trade. Therefore, if you set a Round Turn Commission of 1.00 and you buy and sell 10 shares or contracts, then this will be a total quantity traded of 20. The commission will be 10 in this case and the amount will be deducted from the Profit/Loss reducing the profit and increasing the loss.
In the case of stock shares where the quantities are much higher than futures, you need to take this into consideration when determining the commission value. For example, you may want to set a commission of .01 which would apply per share. So a trade of 1000 shares would have a commission of 10.
If there are any changes to the commission value in the Global Symbol Settings window, then to see these changes applied to the Profit/Loss calculations, select Edit >> Refresh Log on the Trade Activity Log menu when the Trade Activity tab is selected.
The Round Turn Commission value for a symbol has no effect on any other Profit/Loss values you see throughout the user interface in Sierra Chart. It only affects the Trade Statistics and the Trades tabs of the Trade Activity Log.
For further information, refer to Global Symbol Settings.
Profit/Loss (P/L) Format
The Profit/Loss Format setting sets the format for Profit/Loss values displayed on the Trade Statistics, Trades, Period Trade Statistics, Chart Trade Statistics, Account Statistics tabs on the Trade Activity Log. For descriptions for each of the formats, refer to Profit/Loss Format on the Chart Settings page.
When the selected symbol in the Symbol list on the Trade Activity Log is set to All Symbols, then the Profit/Loss Format is automatically implied to be Currency Value and therefore this setting does not have any effect on the Profit/Loss values displayed.
When a Profit/Loss calculation is performed using Points-Ignore Quantity, it is performed using all of the order fills which make up the particular Profit/Loss value and the quantity is ignored and considered to be 1.
Therefore, when looking a Profit/Loss value on the Trade Statistics Tab, which consists of many trades and the total quantity of those trades, it will be different than the summation of the Profit/Loss values which also ignore quantity on the Trades Tab.
The Profit/Loss calculation on the Trade Statistics tab is ignoring the quantity and a single calculation. Whereas on the Trades tab, the sum of all of the Profit/Loss values is ignoring the quantity trade by trade and is accurate. Whereas on the Trade Statistics tab the resulting Profit/Loss value which is ignoring quantity is inaccurate. This is explained in the paragraphs below.
Due to the fact that the profit/loss format is applied to a profit/loss value when it is displayed and the profit/loss values exist as currency values in the calculations within the Trades list, it is not possible to accurately apply a profit/loss format which ignores quantity to a profit/loss value which consists of multiple trades.
For example consider a trade that had a 10 Point profit with a quantity of 1. And another trade that had a 10 Point profit with a quantity of 100. So the resulting profit is 20 points with a total quantity of 101 which gives us a .20 Points profit when ignoring the quantity. However, this is not correct. The actual profit and Points when ignoring quantity is 10.1.
If you have any problems with the Profit/Loss calculations not being correct, then be sure to not use one of the "Ignore Quantity" Profit/Loss Formats.
Menu Commands
File >> Save Log As
For instructions to use this command, refer to Saving to a Text File.
File >> Export
For instructions to use this command, refer to Importing and Exporting Data.
File >> Import
For instructions to use this command, refer to Importing and Exporting Data.
Edit >> Copy All
This button copies all the lines in the Trade Activity Log to the system clipboard.
Edit >> Copy Selection
This button copies the selected lines in the Trade Activity Log to the system clipboard. Once you have copied these lines, you can paste them into any other document or into a Support Board message if asked by Sierra Chart Support. To select a series of lines, click one time on the first line with your mouse pointer, hold down the Shift key on your keyboard, and then click on the last line with your mouse pointer. To select multiple nonconsecutive lines, select the first line, then hold down the Control key on your keyboard while clicking on additional lines with your mouse pointer. To select all of the lines, press the Ctrl+A keys on your keyboard. Press the Copy Selection button to copy the lines.
Edit >> Clear
This command will clear the Trade Activity Log of all Order activity and Fill activity for the selected Symbol and Trade Account.
Edit >> Refresh Log
This command rebuilds the list of Trade Activity data and updates all of the tabs. This command will not cause any remote request of trade data from the server.
Sometimes this is useful after connecting to the data feed in order to have values displayed in a common currency or if there has been a change with the Tick Size or Currency Value per Tick settings.
Edit >> Disable Statistics, Trades, Period Tabs
When this menu command is enabled, then specifically the Trade Statistics, Trades, and Period Stats tabs of the Trade Activity Log are in a disabled state. You can enable this to reduce the processing related to those tabs.
When Sierra Chart is in Risk Manager Mode this is automatically enabled to reduce calculations related to these tabs.
Edit >> Disable Trade Activity Log
When this menu command is enabled, then the entire Trade Activity Log is in a disabled state. You can enable this to reduce the processing related to the Trade Activity Log.
Trade Activity Data Editing Menu Commands (Trade >> Trade Activity Log)
The following commands are on the Trade >> Trade Activity Log window. Select the Trade Activity menu command on that window to see the fills.
- Edit >> Edit Trade Activity Entry: This command opens a window to allow editing of all of the fields of the selected Trade Activity line.
For this command to be active, the Trade Activity tab must be selected. - Edit >> Delete Trade Activity Entry: This command will delete the selected trade activity rows in the Trade Activity list.
For this command to be active, the Trade Activity tab must be selected. - Edit >> Insert Trade Activity Entry: This command will display the Trade Activity Entry window to insert into the Trade Activity list a new Trade Activity data entry.
The selected row will pre-fill the displayed window with values to allow an existing Trade Activity entry to be use as a template for a new one. This will make inserting a new entry much easier.
For this command to be active, the Trade Activity tab must be selected.
Edit >> Flat to Flat Display for Trades List
When this option is enabled, then the Trades list on the Trades Tab will group all of the sub trades together that are part of a Flat to Flat trade sequence into a single line.
Edit >> Use Last In First Out Fill Matching
When this option is enabled, then order fills are matched according to a last in first out matching method rather than a first in first out matching method.
To perform a Last In First Out fill matching method in a chart, use the setting Chart >> Chart Settings >> Trading >> Use Last In First Out Fill Matching.
Edit >> Filter Initial Fills Part of Existing Position
Refer to Automatically Aligning First Loaded Order Fill to Beginning of Position.
Effective with version 2067, each chart has its own equivalent setting to filter initial fills which are part of an existing position, for the fills loaded into the Trades list in the chart. The setting is Chart >> Chart Settings >> Trading >> Filter Initial Fills Which Are Part of Existing Position.
Edit >> Descending Display Order
When this menu item is checked/enabled, then the entry lines in the Trade Activity tab of the Trade Activity Log will be displayed in descending order according to the Date-Time of the entry. This command is disabled when any other tab of the Trade Activity Log is displayed.
Edit >> Include Blank Symbol and None Account in Current List
When this option is enabled, then Trade Activity records which have no Symbol or no Trade Account will still be displayed on the Trade Activity tab.
Edit >> Include Begin/End Indicators in Trades List
When this option is enabled, then the suffixes indicating the beginning and ending of a Trade Position (going from flat to flat) will be displayed after the Entry Date-Time, Exit Date-Time, FlatToFlat Profit/Loss fields in the Trades list. The definitions of the suffixes are as follows: BP = Begin Position. EP = End Position. F = Final.
Window >> Always On Top
With this menu item is checked, the Trade Activity Log window will be on top of all other windows on your system desktop. Unless the window is minimized.
Window >> Close Log
This command closes the Trade Activity Log window.
Window >> Hide All Trade Windows
This command hides all the trading related windows. They can be restored through the Window >> Restore All Trade Windows command on the main Sierra Chart menu.
Window >> Trade Orders Window
This command displays the Trade Orders Window.
Window >> Trade Positions Window
This command displays the Trade Positions Window.
Window >> Trade Account Monitor
This command displays the Trade Account Monitor.
Trade Activity Field Descriptions
The following are descriptions for the available fields for the Trade Activity tab in the Trade Activity Log.
- OpenClose: This field is for informational purposes only and is not used by Sierra Chart for order fill matching. It indicates whether the fill is an opening fill or closing fill based upon the Side of the fill (Buy/Sell), and the current Position Quantity, if any. It is for informational purposes and it does not have any effect at all, with order fill matching. This field can be inaccurate and has a significant probability of being inaccurate for various reasons.
Date-Time of Trade Activity Log Entries
The Date-Time field in the Trade Activity Log is in the Global Time Zone setting.
All entries except for historical order fills downloaded from the trading server, in the Trade Activity Log are timestamped in UTC using your local computer clock. The computer time is converted to UTC time. Therefore, it is important that your computer's clock is set accurately. For more information, refer to help topic 38. These UTC Date-Times are converted to the Global Time Zone when they are displayed.
Historical order fills downloaded from the trading server are timestamped using the UTC timestamp with the fill itself.
Saving the Log
The Trade Activity Log data is automatically saved to the TradeActivityLogs subfolder in the Sierra Chart installation folder. There is one file for each day and Trade Account combination. The format is a custom binary format.
Simulated Order data and Fills are also included in the Trade Activity Log.
Also refer to Importing and Exporting Data.
The price values when using the File >> Save Log As function for the Trade Activity Log, are in what is considered an adjusted format. This is with the Symbol Price Multiplier applied which usually is 1 but can be other than 1.
In the case of when using the File >> Export command, the price values are exported in an unadjusted format which means they are saved as they exist before applying the Symbol Price Multiplier.
Saving to a Text File
Any of the tabs of the Trade Activity Log can be saved to a text file. This data can be viewed in a text editor or opened in a Spreadsheet program including using File >> Open Spreadsheet from within Sierra Chart.
The fields in the text file are separated with a tab character. The Date-Times remain as they are currently displayed in the Trade Activity Log.
When using the Trade Activity Log File >> Save Log As command, the Date-Times will be exactly as they are seen in the visible Trade Activity Log. The prices will also be exactly as they are seen in the visible Trade Activity Log and they will not be in the exchange native format like you would see when exporting.
Follow these instructions to save the selected tab to a text file:
- Select the tab on the Trade Activity Log that you want to save. This can be either Trade Activity, Trade Statistics, Trades, Period Trade Stats, Trade Statistics for Charts.
- Only what is displayed on the tab is actually saved to the file. Therefore, use the filtering controls at the top of the Trade Activity Log, to display the data that you require to actually save, before saving the file. To save the Fill Activity, select the Trade Activity tab and make sure the Fills are displayed by selecting Fills or All Activity in the list box at the top of the window containing these options.
- Select File >> Save Log As on the Trade Activity Log menu.
- On the Save Trade Activity Log window, enter the file name in the Filename box and press Save.
- In the file, the fields along a line are separated by tab characters. Saving it to a file is useful to view it in a Spreadsheet for a more advanced view and special processing.
- You can open the saved Trade Activity log text file in Sierra Chart as a Spreadsheet by selecting File >> Open Spreadsheet.
Change the File Type from "Sierra Chart Spreadsheet" to "Text Files". The files are located in the SavedTradeActivity subfolder. Select the file you have saved and press the Open button.
Printing A Saved Log File
If you have saved the log as explained in the Saving to a Text File section above, then you can print it by opening the log text file in a text editor such as Windows Notepad or Wordpad and printing it from that program.
Clearing Trade Activity Data
This section documents clearing simulated or non-simulated Trade Activity data from the Trade Activity Log. Data can be cleared for a particular Symbol or a particular Trade Account or a combination of the two.
To quickly clear all the Simulated Order and Fill activity for all Symbols and all simulated Trade Accounts from the Trade Activity Log, select Trade >> Clear Trade Simulation Orders and Data on the main program menu. If this is all that you want to do, you can stop here.
Before clearing the Trade Activity data for a particular Symbol and/or Trade Account, you should also be aware that you can edit an entry/row in the Trade Activity tab in the Trade Activity Log by selecting that row and using Edit >> Edit Trade Activity Entry on the Trade Activity Log menu.
For step-by-step instructions to clear Trade Activity Data, follow the instructions below.
The reasons why you would want to clear the Trade Activity Log data for a particular Symbol and/or Trade Account is that you may not need the data any longer. Or, possibly the order fill data for a period of time has a significant number of missing fills, in which case it may not make sense to hold that data since it cannot generate proper Trades and Trade Statistics.
It is important to be aware that clearing Trade Activity Data could take a significant amount of time if there are a lot of Trade Activity data files in the TradeActivityLogs subfolder, or these files are large. For complete details, refer to Trade Activity Not Displaying or Clearing (Improving Trade Activity Query Performance).
- Open the Trade Activity Log by selecting Trade >> Trade Activity Log on the menu.
- Select the Trade Activity tab from the menu.
- In the list of Internal Order IDs at the top of the Trade Activity Log, select All Internal Order IDs.
- In the list of Symbols at the top, select the particular symbol you want to clear Trade Activity data for.
The symbols for simulated trading activity are prefixed with [Sim].
Select All Symbols (Non-Sim) to clear Trade Activity for all non-simulated symbols. Select [Sim]All Symbols to clear Trade Activity for all simulated symbols. - In the list of Trade Accounts at the top, select the particular Trade Account you want to clear Trade Activity data for, or select All Accounts to clear Trade Activity for all Trade Accounts.
- The Date Range setting is not relevant. All Trade Activity data for the selected Symbol and Trade Account will be cleared.
- Press the Apply button.
- Select Edit >> Clear to clear the data. Press Yes to confirm.
- If you have cleared Non-Simulated (Live) Trade Activity, then you may want to disconnect from the trade server by selecting File >> Disconnect and reconnect by selecting File >> Connect to Data Feed.
By reconnecting to the server, all of the available Non-Simulated (Live) order fills on the server will be re-downloaded and inserted into the Trade Activity Log if they currently are not there.
Usually only 1 day of fills will be downloaded because that is all the trade server will have.
Clearing Trade Activity Data Through Files
A method by which Trade Activity data can be deleted for a particular range of Dates and Trade Account is to delete the corresponding files in the TradeActivityLogs subfolder in the Sierra Chart installation folder. Deleting the files will bring about a performance improvement if there are a large number of files and they are excessively large.
Follow the instructions below.
- Make a note of the installation folder in Window >> Message Log. Scroll to the top of the log and look for the text Program path:. The complete path to Sierra Chart is located after that text. If you cannot find this, select Edit >> Clear Log and check again.
- Exit from Sierra Chart with File >> Exit if it is running.
- Through your operating system File Manager, go to the Program path folder.
- Go to the TradeActivityLogs subfolder in this folder.
- All of the trade activity logs are located there and they are organized by the date and the trading account in the filenames.
- The file name format for non-simulated trading is as follows: TradeActivityLog_YYYY-MM-DD_UTC.[TradeAccount].data.
- The file name format for simulated trading is as follows:TradeActivityLog_YYYY-MM-DD_UTC.[TradeAccount].simulated.data.
- Delete the files that you no longer need.
- Run Sierra Chart again.
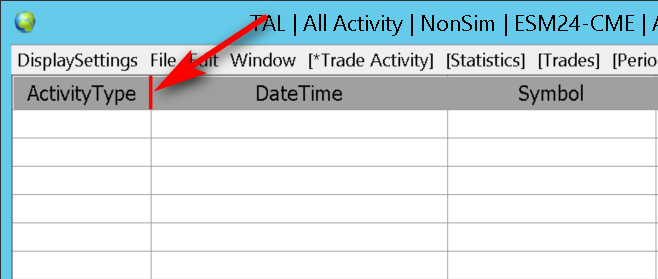
Column Widths and Font
The column widths of data on any of the tabs at the Trade Activity Log can be adjusted larger or smaller by left clicking on the boundary between the columns on the header and dragging to change the width. Refer to the image below.
All of the font properties of the Trade Activity Log text can be changed through the Global Settings >> Graphics Settings >> Font tab. The Text Windows font is what controls the font properties. For more information, refer to Fonts.
Trade Activity Fields
- ActivityType: For the possible values and descriptions for this, refer to Activity Type Filter.
In the case when trade activity is encoded using JSON, the values are as follows: UNDEFINED = 0, ORDER_STATUS_CHANGES = 1, ORDER_FILL = 2, POSITION_UPDATE = 3, ACCOUNT_BALANCE_UPDATE = 4. - DateTime: The Date-Time of the Order update, Order Fill, Position update or Balance update. In the case of trading which is not from a replay or back test, this Date-Time is based upon your local computer clock.
Otherwise, the time is from the Date-Time in the chart during the replay or back test at the point in time in which the order update or fill occurred.
The format is: YYYY-MM-DD HH:MM:SS.US. US equals the true microsecond of the event. Although if necessary it will be incremented in order to create a unique timestamp for every Trade Activity Log entry to prevent entries having the same timestamp. It is incremented until a unique time is found.
If an order fill has an incorrect timestamp or a slightly incorrect timestamp, then it may not match with the correct chart bar in the case of order fills displayed on a chart. It is important the computer's clock is set accurately in the case when order fills use that clock (which is not usually the case). To correctly set your computer's clock, refer toHelp topic 38.
During a chart replay, time stamping of the related order activity is always done according to the chart bars, so it is not affected by an inaccurate computer clock.
Effective with version 2359 this Date-Time is based upon the local computer clock at the time the Trade Activity entry is added to log. - TransDateTime: This field is new in version 2359. It is the transaction Date-Time of the order or fill activity. For live trading in some cases it is provided by the exchange for order fills. For simulated trading, it is based upon your local computer clock. During a chart replay, time stamping of the related order activity is always done according to the chart bars
- Symbol: The symbol of the order or order fill.
- Order Action Source: In the case of a new order, this field indicates the source of the order. This would be the particular chart the order originated from (Symbol and Chart #). If the order is from an automated trading system, then this will specify the Automated Trading Study name.
In cases other than a new order, when there is an update on the order or some action on the order, this will provide descriptive text indicating the source of the order update or the reason for the action on the order. In the case of non-simulated orders, this descriptive text may also include text from the connected Trading service. This information is very useful to determine the reason for the order update and any problems with an order.
In the case when trade activity is encoded using JSON when accessing through the web-based API, Order Action Source will be Base 64 encoded and has to be decoded.Descriptions for Order Action Source for Delayed Actions
- Modifying of order is being delayed: This means an order modification has been submitted but it cannot be processed immediately because the order is in an Order Sent, Pending Open, Pending Modify, or Pending Cancel Status. It will be processed as soon as the Order Status returns to Open.
- Canceling of order is being delayed: This means an order cancellation has been submitted but it cannot be processed immediately because the order is in an Order Sent, Pending Open, Pending Modify, or Pending Cancel Status. It will be processed as soon as the Order Status returns to Open.
- Removed # prior delayed modifications due to later modification: This means there is already a pending modification on an order that has been queued to be submitted when possible, and another modification has been submitted. The prior pending modification has been removed and the latest one has replaced it.
- Removed # prior delayed modifications due to order cancellation: This means there is already a pending modification on an order that has been queued to be submitted when possible, and an order cancellation has been submitted. The prior pending modification has been removed and the order cancellation has replaced it.
- Delayed modification of order is being processed now: This means a pending modification on an order is now being processed.
- Delayed canceling of order is being processed now: This means a pending cancellation on an order is now being processed.
- Delayed modification of order is being ignored because there is no longer a quantity to submit: This means a pending modification is being ignored because it has been determined that the order quantity has now reached 0.
For related information, refer to Determining the Origin of a New/Modified Order.
Other Order Action Source Descriptions
- [trading service name] Historical fills data (Restored) : This indicates an order fill inserted into the Trade Activity Log which was downloaded from the trade server upon connection to the server. These are inserted when order fills are not received in real-time. This indicates an order fill occurred when Sierra Chart was not connected to the server, had lost connectivity, or for some reason the server did not send the real-time notification of the order fill. What the reason for the lost connectivity is, the Trade Activity Log does not indicate that.
Inserted order fills will not have the Order Type or Internal Order ID set. Only the necessary fields for an order fill are set.
The insertion of an order fill does not affect the current Trade Position quantity. It also does not affect the Position Quantity field for other lines in the Trade Activity Log. - Canceling due to no order update | Internally marking as canceled. No order update from server.: When Sierra Chart connects to a Trading service server, it requests all of the Open orders for each of the Trade Accounts on the logged in username. If Sierra Chart has a non-simulated order in its order list with the status of Pending Child-Server, Pending Open, Open, Pending Modify, or Pending Cancel and this order is not in the list of Open orders sent by the Trading service, then it will be internally marked as canceled. What this means, is that it is simply set to a Canceled state within Sierra Chart. Sierra Chart does not cancel the order with the Trading service because the Trading service does not know about the order.
- Internally modified order: This only applies to orders which have a Pending Child status. This means that the order modification was internally performed within Sierra Chart and not sent to the external trading service. Simulated orders will not be sent to the external trading service, but unless they have a Pending Child status, they will not show they are internally modified in the Order Action Source field when modified, even though they are internally modified.
- Auto-order modification: This means an ACSIL (Advanced Custom Study Interface and Language) study modified the Price or Quantity of the order.
- Notice - An overfill UpdateOrder call has occurred. Overfill Quantity: #. Total filled quantity: #. Order quantity: #: This means that an order fill has been received for the order and the prior filled quantity plus the quantity of the new order fill exceeds the most recently specified Filled Quantity of the order. The order fill was ignored in this particular case.
- Internal Order ID: The Internal Order ID. The Internal Order ID of an order is the order number assigned to it by Sierra Chart.
- Order Type: The order type. For example: Market, Limit, Stop, (others).
- Quantity: The order quantity. When Activity Type is Fill the Quantity is the quantity of the individual fill for the order. Otherwise, this is the total quantity of the order.
- BuySell: The side the order is on. This can be either Buy or Sell. In the case when trade activity is encoded using JSON, the values are as follows: UNDEFINED = 0, BUY = 1, SELL = 2.
- Price: The first price of the order, if it applies.
- Price2: The second price of the order, if it applies.
- Order Status: The Status of the order at the time it was logged in the Trade Activity Log. For complete descriptions of the different order statuses, refer to Order Status.
- Fill Price: In the case when the Activity Type field is Order, this is the average fill price of all of the fills for the order, if there has been a fill. In the case of when the Activity Type is Fill, this is the price of the order fill itself, if that value is available from the Trading service.
In the case of Trade Simulation Mode, since there are no partial fills, this will be the price of the single fill for the entire order. - Trade Account: When Sierra Chart is in Trade Simulation Mode, this will be the simulated account number which always begins with Sim. For orders that are sent the connected Trading service, this is the account identifier of the account the order is in.
- Parent Internal Order ID: In the case of Order Activity or a Fill from an Attached Order, this is the Internal Order ID of the parent order.
- OpenClose: This will be Open if the order fill is opening a Trade Position or increasing the quantity. It will be Close if the order fill is closing or reducing a Trade Position quantity. This is determined from the current Position Quantity for the Symbol and Trade Account at the time of the order fill.
- FillExecutionServiceID : This is the unique ID for order Fills from an external trading service to uniquely identify the fill.
- Position Quantity: This field indicates the current Trade Position Quantity after the fill occurred that existed at the time of an order fill or update on the order. Not all Trade Activity lines will contain a Position Quantity field.
Use this field to determine what the current Trade Position Quantity is at any moment in time for each order fill and each order update. If the Trading server has changed the Trade Position Quantity, then this field will be updated as well but it will happen on an approximately 10 second delay. - High During Position: This field is for order fills, and is the highest price during the Trade Position which would existed at the time of the order fill. The highest and lowest prices during the Position are reset at every order fill. So this would be the high just before the reset.
- Low During Position: This field is for order fills, and is the lowest price during the Trade Position which would existed at the time of the order fill. The highest and lowest prices during the Position are reset at every order fill. So this would be the low just before the reset.
- Note: This contains the Text Tag which originates from the Trade Window for the order. In the case of an automated trading system this is a TextTag variable in the s_SCNewOrder structure.
Missing Order Fills from Trade Activity Log
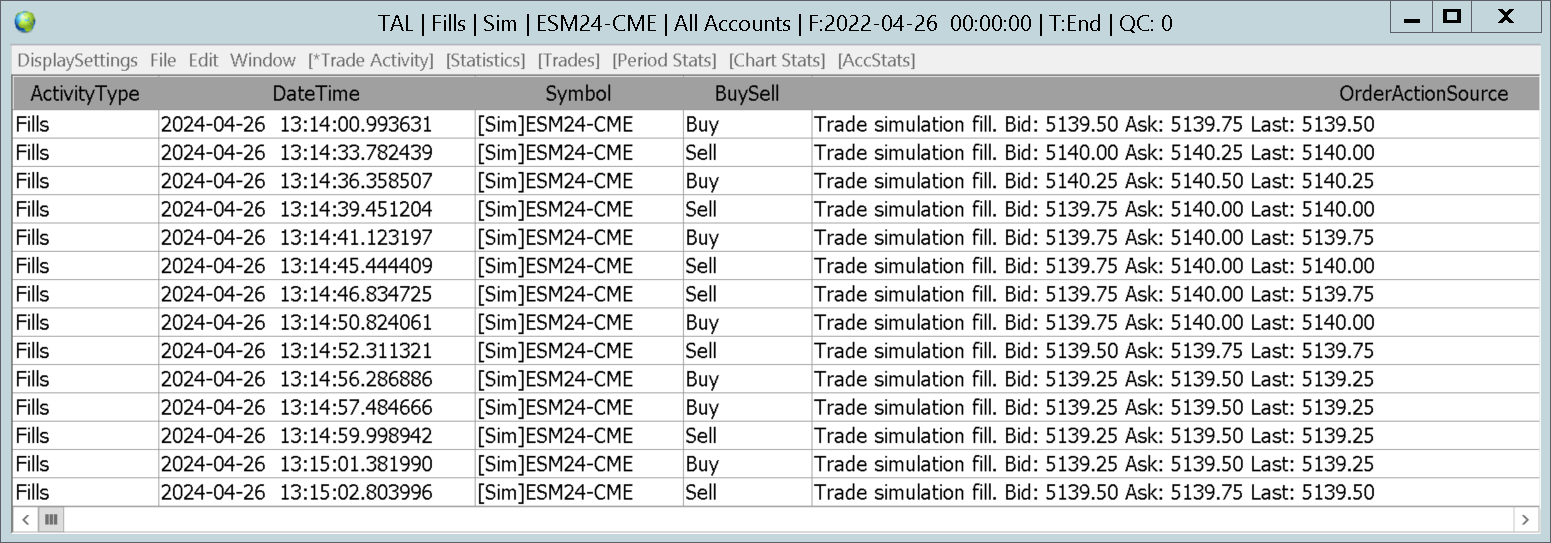
Follow the instructions in the Viewing Historical Trade Activity section to view order fills. At the top of the Trade Activity Log, in the list which lists the Order Activity Types, set it to Fills to see only order fills.
When the settings at the top of the Trade Activity Log are set correctly including the Trade Account (control that lists Accounts) and the Date Range to Display settings, then all of the order fills which can be displayed based upon those settings, and are already stored by Sierra Chart will be displayed.
If you do not see the order fills you want to see, then they were never received in real-time by Sierra Chart from the trading server and Sierra Chart was not able to request them from the trading server. For additional information about this, refer to Automatic Insertion of Missing Order Fills For Non-Simulated Trading.
In general, the only way to be assured all the time of Sierra Chart receiving an order fill is for the order to have been entered from Sierra Chart, and for Sierra Chart to be connected to your Trading service trading account at the time of the order fills. Otherwise, there are various conditions can cause the order fill not to be received by Sierra Chart.
The order fills need to have a correct timestamp when they are provided as historical fills and the time on the computer needs to be accurate for order fills received in real time. If the time on the computer is not accurately set, this can cause a condition where you can see a real-time received fill in the correct order in the Trade Activity Log but when the Trade Activity Log is refreshed, you will not see it in the same place because it will be moved to the correct location based on its actual Date-Time. However, the time on a computer would have to be significantly off for this to be an obvious problem. For information about setting the computer's Date-Time, refer to help topic 38.
Automatically Inserting Missing Order Fills
You can insert missing order fills automatically by following the instructions below. To the extent this works is conditional upon the amount of historical order fill history available with the particular Trading service being used. There may be none available, depending upon the service.
When using the Teton Order Routing Service, there is order fill history available for at least three weeks. There may be more available than this.
There are backups made of the affected Trade Activity Log files, placed in the Backups subfolder in the Sierra Chart installation folder, when trade activity is deleted. Therefore, the data is never permanently deleted.
- If you are using sub instances of Sierra Chart (started with File >> New Instance), then the below procedure needs to first be followed in the main primary instance of Sierra Chart, and then can be performed after for any sub instances as needed.
- Select Global Settings >> Sierra Chart Server Settings. Set the Max Historical Order Fills Days to Download to the maximum amount of days of historical order fills you want to download. No matter what you set this to, if you set it to a value greater than what is available on the server, only what is available on the server will be returned. Press OK.
- Go to Trade >> Trade Activity Log from the main Sierra Chart menu.
- Select the Trade Activity tab with the menu command at the top.
- Select the DisplaySettings command from the menu. The following settings, refer to settings within this window.
- Select Fills for the Trade Activity Type.
- Set the Trade Account to the specific trading account identifier you want to insert missing order fill history for. You must select a specific account and not All Accounts.
- Set the Symbol to All Symbols.
- Set the Note to All Notes.
- Set the Date Range to Display >> From to the starting Date-Time that you want to delete the order fills starting from. This is relative to the time zone you have Sierra Chart set to. If there are missing Order Fills and you want to download the missing fills, then use a Date-Time just before the missing fills.
- Set To Date-Time is Today to Yes.
- Press OK. Wait for the query to complete. Wait for Q:0 to show on the title bar of the Trade Activity Log.
- Go back to the Trade Activity Log window. Select all of the fills from the top of the list to the very end by selecting the very first fill at the top by left clicking on it, and then holding the Shift key on your keyboard and then selecting the very last fill at the end of the list. Use the scrollbar as necessary.
- Select Edit >> Delete Trade Activity Entry. Confirm deletion. There is always a backup file made of the affected files in the /Backups subfolder.
- Reconnect to the data feed with File >> Reconnect.
When Sierra Chart connects to the Trading server, there will be a request for the missing order fills for the trade accounts, from the date-time of the most recent fill for each of the individual trading accounts associated with the logged in username.
Manually Inserting Missing Order Fills
You can insert missing order fills manually by following the instructions below.
- Select Trade >> Trade Activity Log from the main menu.
- Select the Trade Activity tab.
- At the top left of the Trade Activity Log, select Fills so only order fills are displayed.
- Press the Apply button.
- For more details, follow the instructions in the Viewing Historical Trade Activity section to view the existing trading activity for the Symbol, Trade Account and Order Activity source.
- Select an existing order fill in the Trade Activity list, if you can find one. A fill is identified with Fill in the ActivityType field. An existing order fill will pre-initialize the Insert Trade Activity Entry window to make it easier to set fields.
- Select the Edit >> Insert Trade Activity Entry command on the Trade Activity Log menu.
- Set all of the fields as required.
- Press OK.
- It may take a moment for the new order fill to be displayed in the Trade Activity log.
Missing Trade Activity
If the trading activity you expect to see in the Trade >> Trade Activity Log >> Trade Activity tab, it is not displaying, then the very first step is to carefully follow through the instructions in the Viewing Historical Trade Activity section on this page to make sure the filter controls at the top of the Trade Activity Log are set to display the information that you require.
In almost all cases, this is the source of a problem of apparent missing data. However, keep in mind that only order and fill activity from orders entered and filled while Sierra Chart is running, is guaranteed to be in the Trade Activity Log.
There is no guarantee, that any order entered outside of Sierra Chart, is going to be logged in the Trade Activity Log. You should assume this is not going to be the case unless you are using a Sierra Chart trading service like Teton or the Simulated Futures Trading service.
Order and fill activity from trading performed outside of Sierra Chart, is not guaranteed to be in the log. Order fills which occurred when Sierra Chart is not running are not guaranteed to be in the log.
Another reason for missing Trade Activity data is an unlikely condition where there is an error was encountered when writing data to the Trade Activity Log. At the time this occurs, a message will be added to the Trade >> Trade Service Log.
You can have also deliberately cleared trade activity for a particular Symbol and Trade Account and this is another reason for missing trade activity data.
Automatic Insertion of Missing Order Fills For Non-Simulated Trading
For Sierra Chart provided Trading services which include the Trading Evaluator, Teton Order Routing, and LMAX, historical order fills are requested when Sierra Chart makes a connection to the remote data and trade servers (File >> Connect to Data Feed).
Other trading services may have historical order fills but they would be very limited and only for the current trading day and they clear at the end of the day.
However, when using the Teton Futures Order Routing Service or the Simulated Futures Trading Service, there is extensive historical order fills available. This is a dramatic difference compared to the usual 1 day of historical order fills available with other futures trading platforms!
When Sierra Chart connects to the trading server, the missing order fills since the Date-Time of the last order fill that Sierra Chart has in the Trade Activity Log for the Trade Account, are requested.
Sierra Chart processes these historical order fills and inserts into the Trade Activity Log any missing order fills received. If there are missing order fills inserted, the Trade Statistics, Trades, Period Trade Statistics tabs of the Trade Activity Log are rebuilt.
The Trades list in a chart, if the chart is maintaining a Trades list and if the Symbol and Trade Account of the chart matches the symbol of the inserted order fills, is also rebuilt.
If the missing order fills are not available from the server and you are still missing order fills in the Trade Activity Log for a particular symbol, then you may want to follow the Clearing Trade Activity instructions for a symbol to reset the Trade Activity for that symbol back to a clean state. And then if you reconnect to the data feed, whatever historical order fills are available on the server will then be downloaded, if Sierra Chart supports downloading them from the particular Trading service being used.
Or the other possibility is to manually insert missing order fills with Edit >> Insert Trade Activity Entry on the Trade >> Trade Activity Log menu.
For additional information about inserting Trade Activity entries, refer to Trade Activity Data Editing Menu Commands.
Determining Historical Trade Position Quantity from Trade Activity Log
At any historical point in time when there is order activity for a symbol, and in some cases when there is a connection to the trading server, you can determine the Trade Position Quantity for a symbol.
Refer to the Viewing Historical Trade Activity section on this page for instructions to set the Trade Activity tab to list trading activity for a specific Symbol, Trade Account and Date-Time range.
In the list of activity types at the top of the Trade Activity Log you will want to select All Activity or Positions.
In the Trade >> Trade Activity Log >> Trade Activity tab there is a column named Position Quantity which indicates the Trade Position Quantity at every order update.
You may also see a line in the Trade Activity Log when connecting to the trading server which indicates the Internal Trade Position Quantity has been synchronized to the Service Position Quantity and it includes the Trade Position Quantity from the server at that point in time for the symbol. Example:
| Order | GC-201404-CME | 2014-02-12 17:46:07.000 | Synchronized Internal Position to current Service Position. Current Position quantity: 0 |
Trade Data Chart Studies
To view the Closed Profit/Loss historically on a chart, use the Trading: Closed Profit/Loss study on a chart of the same symbol that you want to view this for.
Providing Trade Activity Log Data Lines to Support
Sometimes support will need to see the lines in the Trade Activity Log >> Trade Activity tab for an order or orders. Follow these instructions to provide this to Sierra Chart support.
- Select Trade >> Trade Activity Log on the menu.
- On the Edit menu of the Trade Activity Log make sure that Disable Trade Activity Log is unchecked/disabled.
- Select the Trade Activity tab. This is the first tab. This is the tab that we need to see data from.
- Select All Activity in the list box at the top. If Support specifically asked you for "Fills", then instead select Fills from this list box at the top.
- In the list of Symbols at the top of the Trade Activity Log, select the symbol of the order. Do not select All Symbols. Simulated trading has the prefix [Sim] in front of the symbol. For simulated order activity you will need to select the symbol with that prefix.
- In the list of Trade Accounts at the top of the Trade Activity Log, select the particular trade Account the order is for. In this particular case, you can select All Accounts if you are not sure of the account.
- In the Date Range to Display frame, make sure the From Date is set to the same day or earlier than the Order Activity that you want to view. Make sure that Today is checked. Press the Apply button.
- The relevant orders should now be displayed. Each order has multiple lines within the Trade Activity tab. The ordering is in time ascending order as long as Edit >> Descending Display Order is not selected.
An order can be identified by its DateTime, Symbol, Internal Order ID, OrderType, and the other fields. These lines indicate the various statuses and other data for the order. Support needs to see all of the lines for a particular order or orders that you have a question about. - Click on the first line in the list using your Pointer device for the first order or orders that you have an issue with. Press and hold the Shift key on your keyboard. Go to the last line for the order or orders you have an issue with and left click again. This will highlight the order lines. Release the Shift key.
- Select Edit >> Copy Selection on the menu.
- As an alternative you can just copy all of the data that is currently displayed in the Trade Activity Log. To do this, select Edit >> Copy All. It is preferred that you do not do this because it provides too much data.
- Go to your e-mail message or Support Board message, right-click and select Paste to paste a copy of the order activity.
Providing Trade Activity Log File to Support
If Sierra Chart Support has referred you to this section, then we want to get one or more Trade Activity Log files rather than a copy of some of the lines within the Trade >> Trade Activity Log window.
To provide Sierra Chart support a Trade Activity Log file, follow these instructions.
- Open the Message Log with Window >> Message Log. If the message log does not appear select Window >> Reset Windows. It will then appear.
- Scroll to the top of the Message Log.
- You will see a line like the following: Program path: C:\SierraChart\ | (date-time). You will need this for the next step.
- Navigate through your operating system file manager window, to that folder obtained in the prior step which in this case is C:\SierraChart\.
- Within that folder open the \TradeActivityLogs subfolder.
- This folder contains the trade activity log data files. There is a separate file for each day and each trade account. The file name format for non-simulated trading is as follows: TradeActivityLog_YYYY-MM-DD_UTC.[TradeAccount].data. The file name format for simulated trading is as follows:TradeActivityLog_YYYY-MM-DD_UTC.[TradeAccount].simulated.data.
The time range contained within each file is from 00:00:00.000 to 23:59:59.999 UTC (universal coordinated time) time. - You will need to provide the files which contain data for the particular dates and Trade Account that you have a question about or Sierra Chart has specifically requested.
- Copy these files and provide them to Sierra Chart support either as a Support Board attachment or as an email attachment. In the case of the Support Board, the files will be made private by default. So only Sierra Chart support has access to them.
Restoring Backups of Trade Activity Logs
Follow the instructions below to restore a backup of a Trade Activity log file.
- Backups are made of the affected Trade Activity log files in the /TradeActivityLogs subfolder in the Sierra Chart installation folder, for any operation that you perform which deletes trade activity data.
Whether this is deleting specific Trade Activity entries, or performing a Clearing Trade Activity Data operation. These backup files are stored in the /Backups subfolder in the Sierra Chart installation folder on your computer.
This is an example file name: 2021-10-12 014240.TradeActivityLog_2021-08-27_UTC.Sim1.simulated.data. - To restore one of these files, you will need to exit from Sierra Chart.
- Move these files back into the /TradeActivityLogs subfolder and rename the file without the Date-Time and dot portion to the left of TradeActivityLog_.
- If a particular file being moved already exists in the destination folder, then you will need to delete the one that already exists before moving the original one into the the destination folder.
- Another technique is to move the file back into the /TradeActivityLogs folder, and remove the Date-Time portion of the filename and change the account identifier portion of the filename to some other nonexistent account identifier.
You can then export the order fills for that account, and then import them back into Sierra Chart and they will be imported into the correct existing Trade Activity files. - When done with the file management, start Sierra Chart again.
Profit / Loss Calculations and Symbol Settings
Profit/Loss calculations and the display format for Price values in the Trade Activity Log, rely on the Symbol Settings in Global Settings >> Symbol Settings. These settings include the Value Format, Tick Size, and Currency Value Per Tick. These need to be set correctly for the symbol. If the Global Settings >> Symbol Settings change for a particular symbol, you need to reapply the settings in the Trade Activity Log. This can be done by going to the Trade Activity tab in the Trade Activity Log and selecting the Edit >> Refresh Log command.
The same symbol settings that you see in the Chart >> Chart Settings window have no affect on the Trade Activity Log in any way. Those are specific for the individual chart only.
Importing and Exporting Data
It is supported to export and import data on the Trade Activity tab of the Trade >> Trade Activity Log.
The visible contents of the Trade Activity tab can be exported/saved to a tab delimited text file.
The Order Fills from this text file can be later imported into the same or different installation of Sierra Chart. Only the Order Fills from this text file will be imported. Lines in the file where the ActivityType is "Order" or other types will not be imported. Also, duplicate Order Fills will be ignored. More details about this are explained below.
The Date-Times of the exported order fills will be in the UTC time zone. If you do not want to import this data, and you want the Date-Times in the global time zone setting you have Sierra Chart set to, then instead use Saving to a Text File.
The prices of the exported order fills will be in the exchange native format. This will usually mean, that these prices have a larger value than the adjusted format which is displayed.
If you do not want prices in this format, then instead use Saving to a Text File.
If you are running multiple automated trading system back tests for the same Symbol and Trade Account, and want to export this data and later import it, it is recommended for each back test, you use a different Trade Account to keep these tests separate from each other before starting each back test. Refer to Selecting Trade Account for instructions.
In the case of when using the File >> Export command, the price values are exported in an unadjusted format which means they are saved as they exist before applying the Symbol Price Multiplier.
Follow the instructions below:
- To export the Trade Activity data, select Trade >> Trade Activity Log on the main window menu.
- Select Trade Activity tab at the top of the Trade Activity Log window.
- Follow the Viewing Historical Trade Activity instructions to display the order fills that you want to export.
- At the top left of the Trade Activity Log in the list of Activity Types it is essential to select either Fills or All Activity if you want to export order fills. Otherwise, they will not be exported. The reason this is essential, is if you are importing this data into another instance of Sierra Chart, nothing is going to get imported because only order fills are imported.
- On the Trade Activity Log window select File >> Export.
- Enter a File Name and press the Save button. The data is exported to the specified file into the SavedTradeActivity folder in the folder that Sierra Chart is installed to. Any error message related to the export will be displayed in Window >> Message Log.
- To Import the data which was previously exported with the Export command, select File >> Import on the Trade Activity Log menu.
- Select the file and press Open.
The Order Fills will be imported and duplicates will be ignored. It is important to understand how a duplicate is determined. A duplicate is solely determined based upon the Fill Execution Service ID field. If another order fill in the Trade Activity Log with the same identifier is encountered, then this imported order fill will be discarded and not imported.
Any error message related to the import will be displayed in Window >> Message Log.
If you are importing order fills from a source other than Sierra Chart, it is essential that the FillExecutionServiceID field is present for each order fill and is unique for each individual fill.
Trade Statistics Tab
Overview
The Trade Statistics tab displays various statistics which are documented in the Trade Statistics Fields Descriptions section, for All Trades, Long Trades, Short Trades and Daily Trades.
This statistics information is based upon the order fills currently displayed on the Trade Activity tab. The information does not update dynamically unless there is a new order fill added to the Trade Activity tab.
Basic Instructions
To use the Trade Statistics tab, follow these instructions:
- Select Trade >> Trade Activity Log on the main menu to open or go to the Trade Activity Log.
- Select the Trade Activity tab.
- From the list box at the top containing the Activity Types, select either Fills or All Activity. This is essential.
- At the top of the Trade Activity Log, select the Symbol that you want to view Trade Statistics for, from the list of symbols. If you want Trade Statistics for all symbols there is Trade Activity data for, then select All Symbols for non-simulated trading, or [Sim] All Symbols for simulated trading while using Trade Simulation Mode.
For trading statistics for trades made while Trade >> Trade Simulation Mode On is checked, you must select the symbol that has [Sim] in front of it. If you do not see the symbol with [Sim] in front of it, then this means there is no simulated order activity for the symbol available. - In the list of Trade Accounts, select the Trade Account that you want Trade Statistics for. For simulated trading, you must select a Sim# Trade Account.
- In the Date Range to Display frame at the top, select the period of time that you want the Trade Statistics for. Press the Apply button after changing any of the controls at the top of the Trade Activity Log.
It is important to understand that the very first fill displayed is going to be considered the start of a new Trade Position and an entry fill. Refer to Understanding and Setting the Start Date-Time for a Trades List
It is important to understand that Trade Statistics can only be calculated from order fills that Sierra Chart has and you see listed on the Trade Activity tab. - Choose the Profit/Loss display format that you require from the P/L list box. Note: If you have selected All Symbols from the symbol list box, then the profit/loss setting is ignored and the profit/loss values will always be Currency Value.
- Confirm that Edit >> Disable Statistics, Trades, Period Tabs is unchecked.
- Press the Apply button to apply the changes. If the Trade Statistics list does not show the result right away, then refer to Trade Activity Not Displaying or Clearing (Improving Trade Activity Query Performance).
- After you have completed these steps, select the Trade Statistics tab, if it is not already selected, to see the trade statistics based upon the settings you have set at the top of the Trade Activity Log.
Trade Statistics Fields Descriptions
The following are the descriptions of the different fields available on the Trade Statistics tab. Where a statistic applies to Flat to Flat trades, for a description of a Flat to Flat trade, refer to Order Fill Matching and Flat to Flat Definition.
The trade statistics are displayed in a group of rows and columns. The columns break the statistics out into the following groups:
- All Trades: All long and short trades that match the filter conditions selected at the top of the Trade Activity Log are included in this column.
- Long Trades: All long trades that match the filter conditions selected at the top of the Trade Activity Log are included in this column.
- Short Trades: All short trades that match the filter conditions selected at the top of the Trade Activity Log are included in this column.
- Daily Trades: All long and short trades, that match the filter conditions selected at the top of the Trade Activity Log and are contained within the last Date of the fills, are included in this column. The starting time of the date of the last fill starts at the Date Range to Display >>From >> Time setting at the top of the Trade Activity Log window. Therefore, all fills including those closing out trades in prior days, that have the same date as the last fill on the Trade Activity tab and are after the starting time are included in the Daily statistics.
The first two rows provide the following information:
- Symbol: The selected symbol used for the report is displayed. This can be All Symbols if the Trade Statistics report is for all symbols there is order fill data available for.
- First Fill: The Date/Time of the first fill included in the report.
- Last Fill: The Date/Time of the last fill included in the report.
- Daily Date: The Date used for the Daily Trades column.
The following statistics are provided:
- Closed Trades Profit/Loss: Total profit or loss for all closed trades.
- Closed Trades Total Profit: Total profit for all winning trades.
- Closed Trades Total Loss: Total loss for all losing trades.
- Profit Factor: Profit factor is the ratio of Closed Trades Total Profit over Closed Trades Total Loss. There is not a way to calculate the Profit Factor if there is a zero loss. In this case it just remains at 0.
- Equity Peak: The largest profit, that was reached during the entire sequence of all closed Trades. This value will always be positive.
- Equity Valley: The profit or loss value of all Closed Trades, which is updated every time the Maximum Drawdown decreases.
- Maximum Runup: Maximum Runup, is initially 0 and is updated any time the value goes greater than the previous Maximum Runup. It is calculated as the Profit/Loss of all Closed Trades minus the Equity Valley.
- Maximum Drawdown: Maximum Drawdown, is initially 0 and is updated any time the value goes less than the previous Maximum Drawdown. It is calculated as the Profit/Loss of all Closed Trades minus the Equity Peak.
- Maximum FlatToFlat Trade Open Profit: The maximum open trade profit among the individual Flat to Flat Trades that the Trade Statistics are for.
If this field is not accurate, then refer to the Notes about Maximum Profit and Loss Fields section.
This is also known as MFE - Maximum Favorable Excursion. - Maximum FlatToFlat Trade Open Loss: The maximum open trade loss among the individual Flat to Flat Trades that the Trade Statistics are for.
If this field is not accurate, then refer to the Notes about Maximum Profit and Loss Fields section.
This is also known as MAE - Maximum Adverse Excursion. - Average Trade Open Profit: The maximum open trade profit reached during a trade, among the individual Trades that the Trade Statistics are for divided by the number of trades.
- Average Trade Open Loss: The maximum open trade loss reached during a trade, among the individual Trades that the Trade Statistics are for divided by the number of trades.
- Average Winning Trade Open Profit:
- Average Winning Trade Open Loss:
- Average Losing Trade Open Profit:
- Average Losing Trade Open Loss:
- Maximum Trade Open Profit: The maximum open profit reached in individual fill to fill Trades that the Trade Statistics are for. The Trades can be viewed on the Trades tab.
If this field is not accurate, then refer to the Notes about Maximum Profit and Loss Fields section.
This is also known as MFE - Maximum Favorable Excursion. - Maximum Trade Open Loss: The maximum open loss reached in individual fill to fill Trades that the Trade Statistics are for. The Trades can be viewed on the Trades tab.
If this field is not accurate, then refer to the Notes about Maximum Profit and Loss Fields section.
This is also known as MAE - Maximum Adverse Excursion. - Highest Price During Positions: This is the highest price the symbol traded at during the duration of all of the Trade Positions the Trade Statistics are for.
- Lowest Price During Positions: This is the lowest price the symbol traded at during the duration of all of the Trade Positions the Trade Statistics are for.
- Total Commissions: Total of all commissions for trades.
- Total Trades: Total number of trades. A trade consists of an opening fill and a closing fill. Only completed trades are indicated.
- Total FlatToFlat Trades: Total number of Flat to Flat trades. Only completed trades are indicated.
- Total Filled Quantity: Total of the quantities of all orders making up all trades even the trades that are not yet completed.
- Percent Profitable: Percent of trades that are profitable.
- FlatToFlat Percent Profitable: Percent of Flat to Flat trades that are profitable.
- Winning Trades: The number of winning trades. A winning trade is simply a trade that has a positive profit or zero profit.
- Winning FlatToFlat Trades: Number of winning Flat to Flat trades. A winning trade is simply a flat to flat trade that has a positive profit or zero profit.
- Losing Trades: Number of losing trades. A losing trade is simply a trade that has a loss.
- Losing FlatToFlat Trades: Number of losing Flat to Flat trades. In this case a trade is considered going from a flat position, to a nonzero position and back to a flat position again. A losing trade is simply a trade that has a loss.
- Long Trades: Number of long trades.
- Long FlatToFlat Trades: Number of long Flat to Flat trades. In this case a trade is considered going from a flat position, to a nonzero position and back to a flat position again.
- Short Trades: Number of short trades.
- Short FlatToFlat Trades: Number of short Flat to Flat trades. In this case a trade is considered going from a flat position, to a nonzero position and back to a flat position again.
- Average Trade Profit/Loss: This is the total profit of all trades plus the total loss of all trades, then divided by the number of trades.
- Average FlatToFlat Trade Profit/Loss: This is the total profit of all Flat to Flat trades plus the total loss of all Flat to Flat trades, then divided by the number of Flat to Flat trades.
- Average Winning Trade: Average profit for winning trades.
- Average FlatToFlat Winning Trade: Average profit for winning Flat to Flat trades.
- Average Losing Trade: Average loss for losing Flat to Flat trades.
- Average FlatToFlat Losing Trade: Average loss for losing trades.
- Average Profit Factor: Average profit factor is ratio of average trade profit over average trade loss.
- Average FlatToFlat Profit Factor: Average Flat to Flat profit factor is ratio of average trade profit over average trade loss.
- Largest Winning Trade: Profit for largest winning trade.
- Largest FlatToFlat Winning Trade: Profit for largest Flat to Flat winning trade.
- Largest Losing Trade: Loss for largest losing trade.
- Largest FlatToFlat Losing Trade: Loss for largest Flat to Flat losing trade.
- Largest Winner % Of Profit: Largest winning trade profit as a percentage of total profit.
- Largest FlatToFlat Winner % Of Profit: Largest Flat to Flat winning trade profit as a percentage of total profit.
- Largest Loser % Of Loss: Largest losing trade loss as a percentage of total loss.
- Largest FlatToFlat Loser % Of Loss: Largest Flat to Flat losing trade loss as a percentage of total loss.
- Max Consecutive Winners: Maximum number of Consecutive Winning trades.
- Max Consecutive Losers: Maximum number of Consecutive Losing trades.
- Average Time In Trades: Average time in trades.
- Average Time In Winning Trades: Average time in a winning trade.
- Average Time In Losing Trades: Average time in a losing trade.
- Longest Held Winning Trade: Longest time held for winning trades.
- Longest Held Losing Trade: Longest time held in losing trades.
- Total Quantity: Total quantity/shares for all combined trades.
- Winning Quantity: Total quantity/shares for all winning trades.
- Losing Quantity: Total quantity/shares for all losing trades.
- Average Quantity Per Trade: Average quantity/shares per trade for all trades.
- Average Quantity Per FlatToFlat Trade: Average quantity/shares per Flat to Flat trade for all trades.
- Average Quantity Per Winning Trade: Average quantity/shares per trade for all winning trades.
- Average Quantity Per FlatToFlat Winning Trade: Average quantity/shares per trade for all winning Flat to Flattrades.
- Average Quantity Per Losing Trade: Average quantity/shares per trade for all losing trades.
- Average Quantity Per FlatToFlat Losing Trade: Average quantity/shares per trade for all losing Flat to Flat trades.
- Largest Trade Quantity: Largest quantity of any Trade.
- Largest FlatToFlat Trade Quantity: Largest quantity of any Flat to Flat trade.
- Maximum Open Position Quantity: This is the maximum open Position Quantity reached at any point in time during the period of the Trade Statistics.
- Last Trade Profit / Loss: The Profit/Loss of the last completed Trade. This refers to the last completed fill to fill Trade.
- Last Trade Quantity: The quantity of the most recent Trade whether open or closed.
- Expectancy: The following is the formula for Expectancy as of version 2165: (AverageFlatToFlatTradeProfit for the Trade Statistics * TotalWinningFlatToFlatTradesPercent) + (AverageFlatToFlatTradeLoss for the Trade Statistics * TotalLosingFlatToFlatTradesPercent)
If there are currently open Trades as shown on the Trades tab, then the following Trade Statistics are provided which are up to date according to the last fill. It is possible there are multiple open Trades and these Trade Statistics apply to all of those open Trades.
- Number of Open Trades: Number of currently open Trades as listed on the Trades tab.
- Open Trades Open Quantity: The total quantity currently open among the Trades that are currently open. Keep in mind that when using Flat to Flat Order Fill Grouping, that the open quantity within that Trade may be less than the maximum quantity during the life of that Trade.
- Open Trades Average Entry Price: Average entry price for the open Trades. The average price is calculated from those order fills which make up the currently open Trades. This can be calculated either by LIFO or FIFO depending upon the Edit >> Use Last In First Out Fill Matching menu setting.
Trades Tab
Overview
The Trades tab of the Trade Activity Log, displays various fields detailing Trades made.
In the case when Edit >> Flat to Flat Display for Trades List is unchecked, a Trade is defined as a trade order fill which increases the Trade Position quantity for a symbol and an offsetting trade order fill which reduces that Trade Position back to the previous Trade Position quantity or takes the Trade Position back to flat. This will be considered 1 Trade. The 2 order fills used in the Trade will have the same quantity. The quantity of the Trade will be the smaller of the two order fills which are matched together to form the Trade. Any excess quantity on either the open fill or the closing fill, is then allocated to a separate Trade.
In the case when Edit >> Flat to Flat Display for Trades List is cchecked, a Trade is defined as a trade order fill or fills which increases the Trade Position quantity from a zero Trade Position for a symbol and an offsetting trade order fill or fills which reduces that Trade Position back to a zero Trade Position. This will be considered 1 Trade. Any excess fill quantity on the final closing fill for the Trade will be allocated to a separate Trade.
For more information, refer to Order Fill Matching and Flat to Flat Definition.
The Trades are derived from the individual order fills based upon the selected Symbol, Days Range to Display, Trade Account , and the other settings at the top of the Trade >>Trade Activity Log. You can see the individual fills by selecting the Trade Activity tab of the Trade Activity Log and selecting Fills at the top left of the log.
The order fills must be in the Trade Activity Log for the particular Trades you want to see. If they are not, then refer to Missing Order Fills.
Basic Instructions
To use the Trades tab, follow these instructions:
- Select Trade >> Trade Activity Log on the main menu to open or go to the Trade Activity Log.
- Select the Trade Activity tab.
- From the list box at the top containing the Activity Types, select either Fills or All Activity. This is essential.
- Select the Trades tab
- At the top of the Trade Activity Log, select the Symbol that you want to view Trades for, from the list of symbols. If you want Trades for all symbols there is Trade Activity data for, then select All Symbols for non-simulated trading or [Sim] All Symbols for simulated trading while using Trade Simulation Mode.
To view Trades while Trade >> Trade Simulation Mode On is checked, you must select the symbol that has [Sim] in front of it. If you do not see the symbol with [Sim] in front of it, then this means there is no simulated order activity for the symbol available. - In the list of Trade Accounts, select the Trade Account that you want Trades for. For simulated trading, you must select a Sim# Trade Account.
- In the Date Range to Display frame at the top, select the period of time that you want the Trades for. Press the Apply button after changing any of the controls at the top of the Trade Activity Log.
It is important to understand that the very first fill displayed is going to be considered the start of a new Trade Position and an entry fill. Refer to Understanding and Setting the Start Date-Time for a Trades List.
However, in the case of when using Trade Simulation Mode (Trade >> Trade Simulation Mode) within Sierra Chart and when the Service in Sierra Chart is set to Trading Evaluator or Trading Evaluator - Delayed, it is essential that the From Date-Time is at or earlier than a fill which is the start of a new Trade Position. Otherwise, if the first fill encountered is within an existing Position, that fill and subsequent fills will get filtered out until the order fill which starts a new Position is encountered.
It is important to understand that Trades can only be calculated from order fills that Sierra Chart has and you see listed on the Trade Activity tab.
When setting the From Time, it is important to understand Daily Trade Statistics Reset Time. - Choose the Profit/Loss display format that you require from the P/L Format list box.
- Confirm that Edit >> Disable Statistics, Trades, Period Tabs is unchecked. Confirm that Edit >> Disable Trade Activity Log is unchecked.
- Check that Edit >> Flat to Flat Display for Trades List is set as you require. For more information, refer to Order Fill Matching and Flat to Flat Definition.
- Check that Edit >> Use Last In First Out Fill Matching is set as you require.
- Press the Apply button to apply the changes.
- The Trades tab has a 100% dependency on correct order fills for the period of time selected. You need to be sure there are no missing order fills, no duplicate fills, and the order fill prices and quantities are correct. If necessary, this must all be manually verified on the Trade Activity tab. For information about missing fills, refer to Missing Order Fills from Trade Activity Log.
Flat to Flat Trade Display
It is supported to display a summary of individual sub trades from a flat position and back to a flat position, as a single line. In this case, the Entry Price and Exit Price fields are weighted average prices.
To enable this display mode select the Trades tab on the the Trade Activity Log and enable Edit >> Flat to Flat Display for Trades List on the Trade Activity Log menu.
Reversing Display Order
It is supported to reverse to display order of the individual trades on the Trades tab of the Trade Activity Log in a time descending order.
To enable this display mode select the Trades tab on the the Trade Activity Log and enable Edit >> Descending Display Order on the Trade Activity Log menu.
Reversing the display order on the Trades tabs not supported when Edit >> Flat to Flat Display for Trades List is enabled.
Trades Fields Descriptions
Symbol
The symbol of the trade.
Trade Type
This is either Long or Short based on the initial direction of the first fill of the trade.
Entry Date Time
The Date-Time of the opening fill of the trade.
Where a Trade starts a new Position from a quantity of 0, BP (Begin Position) will be displayed after the Date-Time.
Exit Date Time
The Date Time of the closing fill of the trade.
Where a Trade ends a Position resulting in a Position quantity of 0, EP (End Position) will be displayed after the Date-Time.
Entry Price
The fill price of the entry fill in the trade.
Exit Price
The fill price of the exit fill in the trade.
Trade Quantity
The quantity of the trade.
Maximum Open Quantity
This is the maximum Position Quantity that existed during the life of the Trade.
Maximum Closed Quantity
When a Trade is closed, the Maximum Closed Quantity for an open trade is incremented by the quantity of that Trade. It is also incremented when the Trade itself is closed by its own Trade quantity. So it represents the quantity of other trades closed during its existence and its own quantity.
Profit/Loss
This is the profit/loss for the Trade. This is not set until the Trade is closed. The format is controlled through the Profit/Loss (P/L) Format setting at the top of the Trade Activity Log.
Cumulative Profit/Loss
This is the summation of profit/loss for the Trades for a particular Symbol and Trade Account up to and including the current Trade. This calculation only includes those Trades for the same Symbol and Trade Account.
So it is tracked individually for a particular Symbol and Trade Account unique pair even if the Trades list is set to display All Symbols and/or All Accounts.
This field is only set when a Trade is closed.
If you want to see the total Profit/Loss of all trades for all Symbols and all Trade Accounts being listed on the Trades tab, then you need to look at the Total: at the end of the Trades list under the Profit/Loss column.
Or refer to the Total Profit/Loss for Closed Trades field on the Trade Statistics tab.
Flat to Flat Profit/Loss
This is the running summation of profit/loss for all Trades starting from the Trade that established a new Position from a zero Position Quantity up to and including the current Trade. So it resets every time the position quantity goes back to 0.
This field is only set when a Trade is closed.
Entry Efficiency
A percentage between 0 and 100% identifying the entry price relative to the price range of a Flat to Flat trade.
If there is only one entry and one exit during a Position, then this will always be 100%. In other words, the very first entry for a new Position will have an Entry Efficiency of 100%.
For example, for a long trade, buying the low tick of the price range that existed during the Trade will be 100% entry efficiency.
The Entry/Exit/Total efficiency calculations are based on the range of the instrument while in the trade (Maximum and minimum price while the Position is open). Most simple definitions use Minimum price, maximum price, entry price and exit price for a single trade of Quantity 1.
Exit Efficiency
A percentage between 0 and 100% identifying how close the exit price came to being the perfect price based on the price range of the symbol being traded, during the duration of the Trade. For example, for a long trade, selling the high tick of the price range that existed during the Trade will be 100% exit efficiency.
The calculation is as follows Denominator = FlatToFlatMaximumOpenPositionProfit - FlatToFlatMaximumOpenPositionLoss.
ExitEfficiency = (Denominator == 0) ? 0.0 : (ClosedProfitLoss + Commission - FlatToFlatMaximumOpenPositionLoss) / Denominator.
Total Efficiency
A percentage between -100% and +100% identifying how close the entry and exit prices came to being perfect prices based on the price range of the symbol being traded, during the duration of the Trade. This value represents the amount of the price range during the duration of the Trade, that the Trade was able to capture.
The calculation is as follows Denominator = FlatToFlatMaximumOpenPositionProfit - FlatToFlatMaximumOpenPositionLoss
TotalEfficiency = (Denominator == 0) ? 0.0 : (ClosedProfitLoss + GetCommission) / Denominator.
Maximum Open Profit
This is the maximum profit that the Trade experienced at any moment during the life of the Trade. Also known as Maximum Favorable Excursion (MFE). This value will be 0 until the Trade is closed with an opposing fill.
The calculation is based on the High/Low Price While Open Trades list fields for the Trade.
If this field is not accurate, then refer to the Notes about Maximum Profit and Loss Fields section.
Maximum Open Loss
This is the maximum loss that the Trade experienced at any moment during the life of the Trade. Also known as Maximum Adverse Excursion (MAE). This value will be 0 until the Trade is closed with an opposing fill.
The calculation is based on the High/Low Price While Open Trades list fields for the Trade.
If this field is not accurate, then refer to the Notes about Maximum Profit and Loss Fields section.
Flat to Flat Maximum Open Profit
In the case of trading where there is more than one entry during a Flat to Flat Trade, then this field is going to be different to Maximum Open Profit.
When a new sub Trade during a Flat to Flat Trade is opened, the Flat to Flat Profit from the prior closed sub trades is set into the Flat to Flat Maximum Open Profit field for the new sub Trade.
After this, whenever an individual sub Trade is closed, this field for that particular Trade and this field for any other currently open Trades, is incremented by the Maximum Open Profit of the closed Trade. This profit also considers the quantity of the Trade. This lets you analyze the maximum profit which was experienced at a particular Trade which was currently open at any moment in time during a larger Flat to Flat Trade.
This field only indicates the summation of the Maximum Open Profit for the individual Trade itself and any other trades which were closed during the life of that Trade and any other prior closed profit from previously closed trades in the overall Flat to Flat Trade. It does not indicate the Maximum Open Profit of all of the Trades during a Flat to Flat Trade. Only those sub Trades which existed during the life of the Trade itself.
If this field is not accurate, then refer to the Notes about Maximum Profit and Loss Fields section.
This is also known as MFE - Maximum Favorable Excursion.
Flat to Flat Maximum Open Loss
In the case of trading where there is more than one entry during a Flat to Flat Trade, then this field is going to be different to Maximum Open Loss.
When a new sub Trade during a Flat to Flat Trade is opened, the Flat to Flat Loss from the prior closed sub trades is set into the Flat to Flat Maximum Open Loss field for the new sub Trade.
After this, whenever an individual sub Trade is closed, this field for that particular Trade and this field for any other currently open Trades, is incremented by the Maximum Open Loss of the closed Trade. This Loss also considers the quantity of the Trade. This lets you analyze the maximum Loss which was experienced at a particular Trade which was currently open at any moment in time during a larger Flat to Flat Trade.
This field only indicates the summation of the Maximum Open Loss for the individual Trade itself and any other trades which were closed during the life of that Trade and any other prior closed Loss from previously closed trades in the overall Flat to Flat Trade. It does not indicate the Maximum Open Loss of all of the Trades during a Flat to Flat Trade. Only those sub Trades which existed during the life of the Trade itself.
If this field is not accurate, then refer to the Notes about Maximum Profit and Loss Fields section.
This is also known as MAE - Maximum Adverse Excursion.
Total Profit/Loss
This is the profit/loss for all of the Trades for a particular Symbol and Trade Account. It is listed at the bottom of the list of Trades for a particular Symbol and Trade Account.
This calculation is done using the Profit/Loss represented internally as a currency value. It is then converted to the particular Profit/ Loss Format selected at the top of the Trade Activity Log.
When using one of the Ignore Quantity Profit/Loss Format options, Total Profit/Loss is not going to match the sum of the individual profit/loss values of the listed Trades. What you see is the sum of the profit/loss of all individual trades as a currency value and then divided by the total quantity of those Trades.
Notes about Maximum Profit and Loss Fields
The Maximum Open Profit, Maximum Open Loss, Flat to Flat Maximum Open Profit, Flat to Flat Maximum Open Loss, Entry Efficiency, Exit Efficiency, Total Efficiency fields are based upon the market data prices for the symbol, that occurred during the life of the Trade.
The highest and lowest market data prices are recorded by Sierra Chart when connected to the data feed or when replaying a chart, for the order fills which make up the Trade, during the life of the Trade. If these values are inaccurate or zero, it will result in inaccurate calculations or zero values.
For each order fill, these values are on the Trade Activity Tab and are High During Position and Low During Position. For an order fill which occurred when the prior Position Quantity was 0, these will be 0.
For each trade on the Trades tab, there are the High Price While Open and Low Price While Open fields which are used to calculate the Maximum Open Profit, Maximum Open Loss, Flat to Flat Maximum Open Profit, Flat to Flat Maximum Open Loss, Entry Efficiency, Exit Efficiency, Total Efficiency values. If those two prices are not as expected, then that is the reason for the incorrect value or values. These particular fields are based upon the High During Position and Low During Position fields for the order fills on the Trade Activity tab for the particular order fills that make up a Trade.
If you are performing simulated trading and a Trade has been open both during a chart replay and during real-time chart updating, this can definitely cause an inaccuracy with the Runup, Drawdown, Maximum Open Position Profit, Maximum Open Position Loss calculations.
There are also the Highest Price During Positions and the Lowest Price During Positions fields on the Trade Statistics tab. These represent the highest high and lowest low market data recorded values for all of the Trades that are displayed in the Trades tab.
When using the Order Fill Calculated Trade Positions, the Highest/Lowest Price During Positions and the High Price While Open and Low Price While Open fields will be zero, meaning that the Trades fields which rely on them will be 0.
In the case of non-simulated trading, Sierra Chart must be connected to the data feed to update the High Price While Open and Low Price While Open fields.
Commission
This is the total commission for the Trade. The round turn commission is multiplied by the quantity for the Trade.
To use a commission, refer to Use Commission.
High Price While Open
This is the highest price traded for the symbol during the life of the individual Trade. This refers to the trading activity in the symbol itself from the data feed.
When using the Simulated Trading Service, this field is recorded in the fills. So when the fills are downloaded or re-downloaded this field is provided so all other fields which depend upon this will be complete and accurate.
Low Price While Open
This is the lowest price traded for the symbol during the life of the individual Trade. This refers to the trading activity in the symbol itself from the data feed.
When using the Simulated Trading Service, this field is recorded in the fills. So when the fills are downloaded or re-downloaded this field is provided so all other fields which depend upon this will be complete and accurate.
Note
This is the Note which has been specified for the entry order. To set a Note, refer to Text Tag.
This is used to label individual Trades to categorize and identify them. You are able to display only those Trades containing a specific Note, by choosing a particular note from the list box at the top of the Trade Activity Log containing the notes.
Open Position Quantity
At the time a Trade is established through an entry fill, this field is the Position Quantity at that time which also includes that new order fill establishing that particular Trade.
Close Position Quantity
At the time a Trade is closed through an exit fill, this field is the Position Quantity at that time which also includes that new order fill closing that particular Trade.
Period Trade Stats Tab
Overview
The Period Trade Stats tab of the Trade Activity Log calculates and displays various trading statistics fields for the general time period specified for the selected Symbol, Trade Account, and the other settings at the top of the Trade Activity Log.
The Time Period does not specify a specific Date-Time range. Instead the trade statistics repeat for each Time Period based upon the time range of the order fill data available.
For example, if you select Daily, then for each day there is order fill data available for, you will see trading statistics for each of those days.
Basic Instructions
- Select the Trades you are interested in by following the Basic Instructions for the Trades tab.
- Use the list box at the top of the Trade Activity Log containing the various supported periods to select the period to display. The choices are: Period - None, Hour of Day, Half Hour of Day, Day of Week, Month of Year, Daily, Weekly, Monthly.
- Confirm that Edit >> Disable Statistics, Trades, Period Tabs is unchecked.
- Press the Apply button to apply the changes.
Period Trade Stats Fields Descriptions
- Period: This is the starting time, day of week, month or date the statistics are for. The statistics are based on completed Trades. A Trade will fit into a particular period according to its Entry time.
- Running P/L: This is the running or cumulative profit/loss of Trades accumulated across each period as you move down through the rows for each period.
- Profit/Loss: This is the profit/loss for all Trades within the period.
- Gross Profit: This is the total profit of all winning Trades within the period.
- Gross Loss: This is the total loss of all losing Trades within the period.
- Num Trades: The number of Trades within the period.
- % Winners: The precentage of Trades that were winners within the period.
- Avg Trade: Average net profit per Trade within the period.
- Avg Winner: Average profit for winning Trades within the period.
- Avg Loser: Average loss for losing Trades within the period.
- Largest Winner: Profit for largest winning Trade within the period.
- Largest Loser: Loss for largest losing Trade within the period.
- Drawdown: Drawdown across the Trades within the period.
- Runup: Runup across the Trades within the period.
- % Of Trades: Number of Trades in this period over the total Trades across all periods.
Account Statistics Tab
Overview
The Account Statistics tab has a single line of trade statistics for a combined Symbol and Trade Account pair. This provides a consolidated view of trading data based on symbol and account per line.
It is very useful for monitoring the trading activity of other users when trading activity has been shared by those users.
Fields like the Open Profit/Loss and Net Profit/Loss update in real time using the current data.
Basic Instructions
Account Statistics Tab Fields Descriptions
Trade Statistics for Charts (Chart Stats) Tab
The Trade Statistics for Charts tab of the Trade >> Trade Activity Log window provides a centralized view of the trading data, for all symbols you are currently trading and you have chart or Trade DOM window open for.
To display this tab, go to Trade >> Trade Activity Log and select Chart Stats at the top menu.
The Trade Statistics for Charts tab displays various trading statistics data for the current Trade Position and for the Closed Trades, both Daily and Cumulative, for charts which are maintaining their own internal Trades list.
Charts that are in Chart Trade Mode, charts that have a Trade Window open, charts with trading related studies, and Trade DOM chart windows will maintain their own internal Trades list from the order fills for the Symbol and Trade Account of the chart.
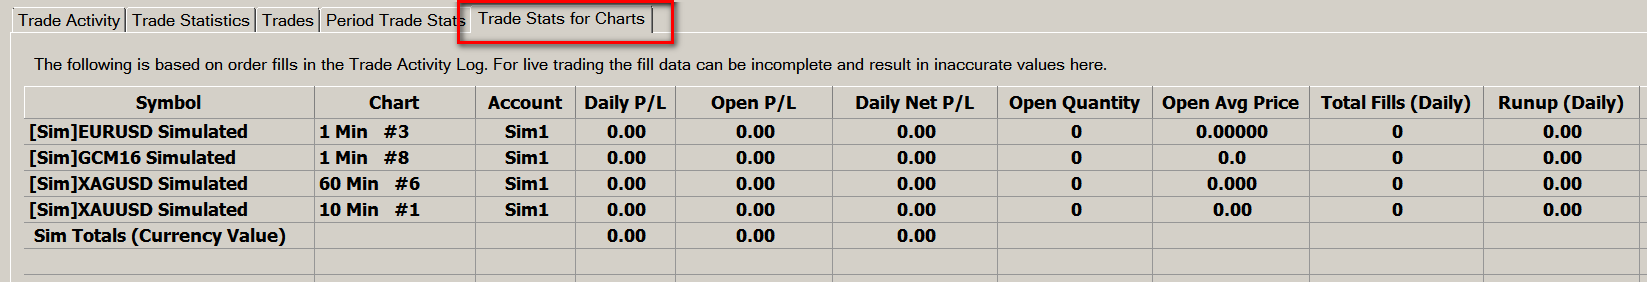
The data displayed on the Trade Statistics for Charts tab is calculated from the order fills for the particular Symbol and Trade Account the stats are for, which are available in the Trade >> Trade Activity Log.
In the case of non-simulated trading, for the Trade Statistics for Charts tab fields to be accurate, there needs to be a complete set of order fills for the Symbol and Trade Account being traded for the period of time you want to view the statistics for and the start Date-Time of the calculations needs to be set correctly. If there is any inaccuracy, then refer to the Solving Inaccurate Trade Statistics for Charts Field Values section.
For further information about controlling the starting Date-Time in the Trades list in the chart, refer to Understanding and Setting the Start Date-Time for a Trades List.
The Trade Statistics for Charts tab displays either non-simulated or simulated trading data, but not both.
When Trade >> Trade Simulation Mode On is checked, then the Trade Statistics for Charts tab will display simulated trading data only.
When Trade >> Trade Simulation Mode On is unchecked, then the Trade Statistics for Charts tab will display non-simulated trading data only.
In the case of simulated trading which is simulated within Sierra Chart, the Trade Statistics for Charts tab is the only way to see the current Trade Positions outside of the charts themselves.
The Trade Positions window contains non-simulated Trade Positions data only.
The order fills that are within the Trades list in a chart start at the Chart >> Chart Settings >> Trading >> Order Fills Start Date-Time setting or if this is not set, there are other rules which control the starting Date-Time of the order fills loaded into the Trades list in a chart. For complete details, refer to Order Fills Start Date-Time.
In the case of non-simulated trading, the list of order fills held in the Trade Activity Log is from order fills received in real-time and also downloaded from the trade server upon connection to the server.
Therefore, there is a good probability, that the information displayed in the Trade Statistics for Charts tab over time is not going to be accurate. There is a solution to this. Refer to Solving Inaccurate Trade Statistics for Charts Field Values.
On the Trade Statistics for Charts tab, there will only be one line for each Symbol, Trade Account, Order Fills Start Date-Time, Non-Simulated/Simulated, Replaying/Not Replaying, unique combination, whether this originates from a Chart or Trading DOM. The charts/Trading DOMs are searched sequentially and the ones listed are not necessarily the ones you are trading from.
For description of all of the fields, refer to Chart Stats Field Descriptions.
The data is based upon all of the Trades, both Long and Short which have been completed and are also still Open. Not just the current Daily trades.
Setting the Profit/Loss Format
To set the format for the Profit/Loss values displayed on the Chart Stats tab, select the format you want from the Profit/Loss list box at the top of the Trade Activity Log window.
For a description of the various formats, refer to Profit/Loss Format on the Chart Settings documentation page.
The Chart Stats tab can use a different Profit/Loss Format as compared to the chart itself which the data originates from. To set the format in a chart, refer to Profit/Loss Format in the Chart Settings documentation. This is something to be aware of in case you see differences between the Profit/Loss values in a chart as compared to the Chart Stats tab for the same chart.
For the Profit/Loss Totals for the lines in the Chart Stats tab, the totals are always provided as a Currency Value. This is necessary because the totals are calculated across different symbols.
Open Profit/Loss Calculation And Update Interval
The Trade Statistics for Charts tab of the Trade Activity Log updates every 3 seconds. It does not update at the same time as the Trade Windows belonging to charts. Therefore, you can notice a difference with the Open Profit/Loss value for a Symbol and Trade Account compared to the Trade Window for the chart because they are updating at different points in time. They are not synchronized with each other.
The Open Profit/Loss can be calculated against the last trade price or the Bid or Ask depending upon whether the Position is Long or Short. This is controlled by the Use Bid/Ask for Open Profit/Loss Calculations setting.
Solving Inaccurate Trade Statistics for Charts Field Values
If any of the displayed field values on the Trade Statistics for Charts tab for a particular Symbol and Trade Account are not correct, for example an incorrect Open Quantity for the current Trade Position or there is an inconsistency of field values between charts, then this is caused by missing order fills for the Symbol and Trade Account of the chart, or an incorrect Order Fills Start Date-Time or Start Time for Trades List settings.
It is essential to understand how these calculations are done. For an understanding of how the Open Quantity field is calculated as well as all of the other fields, refer to Open Quantity Field Calculation Method. The most relevant field is the Open Quantity because that gives you a clear indication of the current Open Position Quantity based on the matching of the order fills being processed.
The information in this section also applies to when using the Order Fill Calculated Trade Position.
This section is also relevant to inconsistencies with the Trade Statistics data for a given Symbol and Trade Account, among charts.
The order fills for the Symbol and Trade Account can be viewed on the Trade Activity tab of the Trade >> Trade Activity Log. For instructions, refer to Viewing Historical Trade Activity.
To solve problems with these chart Trade Statistics so they are consistently accurate use the Teton Futures Order Routing Service, assuming you are trading futures.
Follow the instructions below to correct a calculation error with the Trade Statistics for Charts field values for a particular chart by adjusting the Order Fills Start Date-Time setting.
Setting Chart Order Fills Start Date-Time
- Go to the Trade >> Trade Activity Log >> Chart Stats tab.
- Look at the Chart column to see the particular Chart Number which has an inaccurate Open Quantity or other values. Take note of the Chart Number (#).
- On the main Sierra Chart program go to the CW menu and locate that particular chart number.
- Select Chart >> Chart Settings >> Trading for that chart.
When opening the Chart Settings window, you are opening the Chart Settings for the chart which is active. Each chart has its own settings. - In the Order Fills Start Date-Time boxes enter the starting Date-Time for the order fills that make up the current Trade Position for the Symbol and Trade Account for the chart or Trade DOM you are trading from. The Date is in the left box in the format is: YYYY-MM-DD. The Time is the right box in the format is: HH:MM:SS.
If the Trade Position is currently flat for the Symbol and Trade Account, then enter the current Date-Time.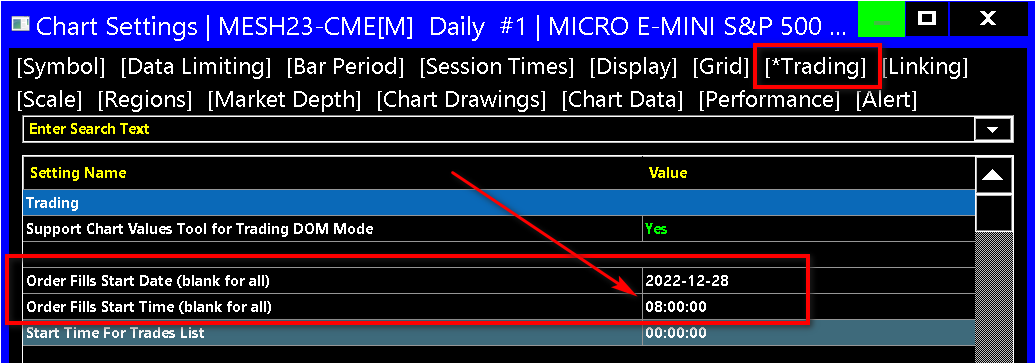
- This Date-Time is relative to the Time Zone setting in Sierra Chart or for the Chart.
- For complete details about how Order Fills Start Date-Time is used, refer to Open Quantity Field Calculation Method.
- If you set the Order Fills Start Date-Time it is necessary to uncheck Load Order Fills for Current Day Only for that setting to go into effect.
- Press OK.
- If this does not resolve the problem, then set Order Fills Start Date-Time to the current Date-Time to filter out all prior order fills assuming the Position is currently flat. Otherwise, you need to wait until the Position is flat to do this.
- Once this start Date-Time is set correctly, you should not have to adjust this Date-Time for a while even for new Trade Positions. As long as there are complete order fills since that Date and Time, the resulting Trade Position Quantity and other trade statistics will be accurate.
- Another item to be aware of is what is considered the start of the trading day. For information about this and to adjust the related setting, refer to Understanding Daily Trade Statistics Reset Time.
- If you notice an inconsistency between the Trade Statistics among different charts for the same Symbol and Trade Account, then make sure the Order Fills Start Date-Time and the Start Time for Trades List in the Chart >> Chart Settings are set the same for those charts.
Inserting and Editing Order Fills
If necessary you can also insert any missing order fills into the Trade Activity Log. The Trade Activity Log supports inserting and editing of Order Fills which you can use to cause the correct values to be reported for the Symbol and Trade Account in the Trade Statistics for Charts tab.
For instructions, refer to the Trade Activity Data Editing Menu Commands section.
Open Quantity Field Calculation Method
This section describes the calculation method for the Open Quantity field on the Trade Statistics for Charts tab of the Trade >> Trade Activity Log which displays the information from each of the internal Trade lists for those Charts and Trading DOMs used for trading.
This information also applies to how the Position Quantity is determined from order fills when using Using Order Fill Calculated Positions In Special Cases and how the Position Quantity is determined on the Trade Statistics and Trades tabs and how it is calculated for simulated trading within Sierra Chart.
The Open Quantity field initially starts at 0 and is calculated as described below by processing the order fills, in a time ascending order for a particular Symbol and Trade Account. Therefore, order fills are processed in time ascending order according to their Date-Time. There is no association with the particular order a fill is from or matching of fills based upon the association between orders.
It is important to understand how this calculation is done because it affects Trade Statistics, trade profit/loss and the matching of order fills which are used in calculations like the Daily Profit/Loss and also for the order fills displayed on a chart.
The Trade Activity Log and each chart which is used for trading contains a Trades list which is processing the order fills in the same way that you see on the Trades tab of the Trade Activity Log.
It is necessary to understand that a buy order fill increases the Position Quantity by the Quantity of that order fill and a sell order fill decreases the Position Quantity by the Quantity of that order fill.
For example, starting at the first fill at the Start Date-Time for a Trades List a buy order fill of 1 and a buy order fill of 2 will result in a Position Quantity of 3. And if there is a sell order fill of 1, the Position Quantity then becomes 2.
So the order fills which are loaded into the Trades list in a Chart or Trade Activity Log are incrementally processed according to an ascending Date-Time order and the Position Quantity (Open Quantity) at each order fill arises from the processing of the fill. When an order fill is encountered which reduces the Position Quantity, it is matched to an existing order fill, and which existing fill it is matched with depends upon whether a FIFO or LIFO order fill matching method is used. This is controllable both in a Chart and Trade Activity Log. Refer to Use Last In First Out Fill Matching.
So it is the sum of the quantity of each of the order fills starting at the Date-Time set for loading the order fills for a particular Symbol and Trade account. Buy fills increase the Position Quantity and Sell fills decrease the Position Quantity by the quantity of the fill.
The very first fill, loaded in the chart, establishes the Position Quantity starting from a quantity of 0, irrespective of what the actual Position Quantity was from that fill. This is why it is extremely essential, that the very first fill loaded in the chart was the fill that actually started a new Position for the Symbol and Trade account, and that there are no missing fills from that point in time. Refer to Understanding and Setting the Start Date-Time for a Trades List
All available order fills at or after the Date-Time of the first bar in the chart for the Symbol and Trade Account are used in the calculation except as explained below.
It is supported to limit the order fills in a chart through the Order Fills Start Date-Time setting or through the Load Order Fills for Current Day Only setting. For this last option, the start of the trading day is according to the Start Time for Trades List setting.
When Filter Initial Fills Which Are Part Of Existing Position is set to Yes in the Chart Settings (there is also the same setting on the Edit menu of the Trade Activity Log), then when the order fills are loaded into the Trades list in a chart, the initial order fills that have a nonzero Position Quantity field on them and do not initiate a new Position, are filtered out until one is encountered which initiates a new Position. At this point, the filtering stops. This is so that the order fills are aligned to the start of a new Position. This is not always going to work perfectly due to the fact that the Position Quantity field may not be accurate or has not been set, but it helps in many cases.
Trades can be viewed on the Trades tab of the Trade Activity Log. By looking at the Open Position Quantity and the Close Position Quantity fields, you can see exactly how the Position Quantity is arrived at.
Trade Statistics for Charts Tab Color Settings
The color Settings used on the Trade Statistics, Trades, Periods Stats, Trade Statistics for Charts tabs can be changed through the Global Settings >> Graphics Settings - Global window.
Refer to Graphics Settings for complete documentation.
The color settings are as follows:
- Position/Trades/ChartTradeStats tabs Long / Profit
- Position/Trades/ChartTradeStats tabs Short / Loss
- General Text Window Background Color
- General Text Window Foreground Color
Removing Duplicate Symbols from Trade Statistics for Charts Tab
If the following settings (in the list below) for a Chart or Trade DOM, which is maintaining its own Trade list and therefore being displayed on the Trade Statistics for Charts (Chart Stats) tab of the Trade >> Trade Activity Log, are different for a symbol, then you will see the symbol listed multiple times.
In this case, the fields of data displayed can be inconsistent for each row.
To prevent the symbol from being listed multiple times which will also remove the inconsistencies, make sure these Chart or Trade DOM settings are the same for each of the charts listed.
- Trade Account
- Chart >> Chart Settings >> Trading >> Load Order Fills for Current Day Only
- Chart >> Chart Settings >> Trading >> Order Fills Start Date-Time.
There is one important detail to understand about this setting. Although this can be set the same for two different charts, when there is a background query made for the order fills which takes time to complete, usually less than a second but could take significantly longer based upon the amount of trade activity, the starting Date-Time of the Trades list which is based upon the Date-Time of the first loaded fill in the Trades list in the chart, can be different between the two charts temporarily because they each perform independent queries.
In this particular case, what can happen is that you see the number of charts listed in the Chart Stats tab vary as the queries for historical order fills begin to complete to the charts.
To optimize the queries, select Global Settings >> Convert Trade Activity Format to convert any old files to the new more optimized file content/filename format.
You can determine what chart to set these on, by looking at the Symbol field in the Chart Stats tab of the Trade >> Trade Activity Log. The Chart Number is displayed with the symbol. You can find these Chart Numbers through the CW menu of the main Sierra Chart program window. You can go to Chart >> Chart Settings for each of those charts.
Chart Stats Field Descriptions
For the Chart Trade Statistics to be accurate, it is important that the Order Fills Start Date-time for the Trades list in the chart is set correctly.
For more details about this, refer to Solving Inaccurate Trade Statistics for Charts Field Values.
- Symbol: This is the symbol of the chart and the trade statistics are for.
- Trade Account: This is the trade account the chart is set to and the trade statistics are for.
- Chart: This provides the symbol and Chart Number of the chart which contains the Trades list the statistics are computed from.
- Daily P/L: This is the total profit or loss for trades which have completed in the current trading day. To understand what the start of the trading data is, refer to Understanding Daily Trade Statistics Reset Time. This does not reset until the chart for which it is for, enters a new trading day according to the last Date-Time of data loaded in that chart and the reset time.
- Open P/L: This profit or loss value is the difference between the Open Average Price field (see description below) and the current price of the symbol, times the Open Quantity. For the exact calculation and other details, refer to Open Profit/Loss (P/L).
- Open Quantity: This is the quantity of the currently open Trades for the Symbol and Trade Account the Chart Stats line is for. It will be a negative number for a short position.
It is essential to understand that this is a Quantity determined from the order fills themselves and not based upon the actual current Position Quantity for the symbol and Trade Account. For more information, refer to Open Quantity Field Calculation Method.
For non-simulated trading, this field is compared against the Quantity for the same Symbol and Trade Account in Trade >> Trade Positions Window. If this quantity is different, then the text (not accurate) is placed after the corresponding Quantity field in the Chart Stats tab. In this case, to resolve the inaccuracy, refer to Solving Inaccurate Trade Statistics for Charts Field Values. - Open Avg Price: This is the average price of the order fills which make up the currently open Trades. This is not necessarily going to match with the current Position Average Price you see on the Trade Window. This is calculated using a First In First Out order fill matching method and based upon the calculated Open Quantity according to Open Quantity Field Calculation Method. This is essential to understand!
- Total Fills (Daily): This is the total filled quantity of the orders for the trading day. To understand and control the start of the trading day, refer to Understanding Daily Trade Statistics Reset Time.
- Runup (Daily): This is the Maximum Runup for the trading day. To understand and control the start of the trading day, refer to Understanding Daily Trade Statistics Reset Time. For further details about this field, refer to Trade Statistics Fields Descriptions.
- Drawdown (Daily): This is the Maximum Drawdown for the trading day. To understand and control the start of the trading day, refer to Understanding Daily Trade Statistics Reset Time. For further details about this field, refer to Trade Statistics Fields Descriptions.
- Closed P/L: This is the profit or loss of the Tades which have closed. This is based on the order fills loaded in the Trades list of the chart. For an understanding of the starting Date-Time of this calculation, refer to Order Fills Start Date-Time.
- Daily Net P/L: This is the sum of the Open P/L and the daily P/L fields.
- Last Trade P/L: This is the profit or loss of the last completed Trade. This is not a flat to flat trade but a trade of two fills matched together.
- Last Price Used: This is the price which is used to calculate the Open Profit/Loss. It could be the last trade price, the bid price or the ask price.
- Order Fills Start Date-Time: This is the Date-Time of the first fill loaded in the chart. It is indirectly controlled by the Order Fills Start Date-Time Chart setting.
Order Fill Matching and Flat to Flat Definition
Order fills are grouped together into Trades for reporting purposes. A Trade will consist of two order fills. The first order fill increases the Trade Position Quantity (entry fill) and the second fill decreases the Trade Position Quantity (exit fill). Or a Trade can be defined as a fill that establishes or increases a Position and an offsetting fill that reduces the size of the Position.
In the Trades list and Trade Statistics, there are fields which use the concept of Flat to Flat. The definition of Flat to Flat is defined as the sequence of two or more fills which take you from a flat Trade Position, to a non-flat Trade Position, and then back to a flat Trade Position again. Details of each Trade can be viewed on the Trades tab.
Order fills are always matched using a First in First Out matching method unless Chart >> Chart Settings >> Trading >> Use Last In First Out Fill Matching is enabled.
Order fills are ordered by Date-Time in a time ascending order in the Trade Activity Log. Therefore, fills are match together based upon their Date-Time. There is no association with the particular order a fill is from or matching of fills based upon the association between orders.
Additionally, when an order fill is matched with another order fill to create a single Trade, they need to have different Sides. For example, a Buy fill can only be matched with a Sell fill. The entry fill is considered the opening fill and the exit fill is considered a closing fill without any regard to their Open/Close field with the the order fill data.
For further details, refer to Open Quantity Field Calculation Method. This section explains fill matching from the perspective, of how the Trade Position Quantity is calculated when matching fills.
When order fills are grouped together for creating Trades, all profit and loss calculations are based upon the actual fill prices and there is no averaging used.
Looking at the original fills on the Trade Activity tab and the Trades on the Trades Tab will help you understand how the order fills are matched together.
Questions About the Trade Activity Log Data
Sometimes we are presented with questions about the information reported on one of the tabs of the Trade Activity Log . If it is reasonable to answer and does not require detailed analysis of the data, then we should be able to provide a basic answer.
If answering the question requires detailed analysis of the data in the log, and we do not believe there is any type of issue that needs to be resolved, then this is outside the scope of our support to analyze the data and answer the question.
In the case where we cannot help you, we recommend reviewing the documentation on this page and understanding the information provided in the Trade Activity Log and that you perform your own analysis.
It is essential to understand that the data that you see displayed on the Trade Statistics and Trades tabs comes from the order fills displayed on the Trade Activity tab.
Go to the Trade Activity tab and select Fills in the Orders | Fills | Positions | Account Balance | Info | All Activity list box at the top of the window. By looking at the order fills and understanding the Order Fill Matching and Flat to Flat Definition you can then see how all of the calculations are done and fills are matched.
However, it is important understand there can also be Missing Order Fills from Trade Activity Log which will lead to order fill matching issues an incorrect Trade Statistics and Trades.
Trade Statistics for Charts: Each line that you see displayed on the Trade >> Trade Activity Log >> Trade Statistics for Charts tab comes from a Trades list in each chart that is maintaining a Trades list and Trade Statistics.
Basic Analysis Procedure for Trading Question/Issue
If you have a question/issue about a particular trading event or about a particular order, then go through the following procedure to analyze this.
- Use the Trade Activity Log to locate the order orders related to the particular event or order.
- Every line in the Trade Activity Log has a Date-Time which is in the Time Zone Sierra Chart is set to.
- In the Order Status column you can see the status at every line for the order. If the status is Open, then this means the order is working at the exchange and can be filled.
- Refer to the Price and Price2 fields for the prices of the order.
- The Trade Activity Log by design is very detailed and organized and provides all the information needed to analyze a particular trading event.
- If an order does not fill when expected, then consider its Order Type and its prices, and the behavior of that order type. The external trading service may have been late with the reporting of a fill.
- You have all of the information you need in the Trade Activity Log to answer your question in most cases. It is appreciated to be self-sufficient here and look at what happened. You know what you did with your trading and you possess all of the information in the Trade Activity Log. We do not have that information ourselves.
Profit/Loss Calculation Rounding Error
Profit/Loss calculations in Sierra Chart which are displayed as a Currency Value are done using floating-point numbers.
Inherently there is some imprecision with these types of calculations which can lead to small .01 display inaccuracies.
There is no solution to this. This is just how it is.
Understanding Daily Trade Statistics Reset Time
On the Trade Statistics tab of the Trade >> Trade Activity Log, the Daily Trades column contains trade statistics which reset each day. This reset occurs once there is an order fill which has a timestamp that crosses the reset time as compared to the prior order fill. How this reset time is determined as explained below.
In the Date Range to Display frame of the Trade Activity Log, set the From >> [time] field to what is considered the start of the trading day. This is the reset time. If this is set to a time other than 00:00:00, the reset time is considered to start in the prior day. For a further understanding of this, refer to Understanding Trading Day Dates Based on Session Times. However, still the resetting will occur at that time when in is encountered.
The information in the following paragraphs applies to current versions of Sierra Chart.
For charts which are maintaining their own Trades list and Trade Statistics which includes charts that are used for Trading or contain trading related studies, the start of the trading day (the reset time) is according to the Chart >> Chart Settings >> Trading >> Start Time for Trades List time setting.
If this Start Time has already been encountered in the current day, then the reset Date-Time is in the current day. If this reset time has not been encountered in the current day, then the reset Date-Time has already occurred in the prior day. For a further understanding of this, refer to Understanding Trading Day Dates Based on Session Times. However, still the resetting will occur at that time when it is encountered.
The start of the trading day is used for Trade Statistics like the Daily Profit/Loss in a chart. There are also various other Trade Statistics accessible through ACSIL and on a Spreadsheet when using the Spreadsheet System for Trading study, and also when using the Trading: studies. All of these will reset at the start of the trading day as explained above. In the case of a chart the reset will occur when this reset time is encountered.
Understanding and Setting the Start Date-Time for a Trades List
The Trade Activity Log maintains its own Trades List which organizes order fills into trades and generates the profit/loss for those trades, and maintains detailed trade statistics.
Charts which are used for trading or charts which require trading related data which includes Trade Statistics, also maintain their own Trades List which organizes order fills into trades and generates the profit/loss for those trades, and maintains detailed trade statistics.
In the case of the Trade Activity Log, the Trades List is used for the following tabs: Trade Statistics Tab, Trades Tab, Period Trade Stats Tab, Account Statistics Tab.
It is important to understand how to control the very first order fill loaded into the Trades List and to understand how this affects all of the subsequent matching of the order fills and therefore the resulting Position Quantity.
The very first order fill loaded in the Trades List is considered the start of a new Trade Position starting from a quantity of 0 irrespective of what the actual Trade Position quantity was just before that fill.
If you do not understand this, you are going to have results that will be erroneous and nonsensical in the resulting generated Trade Statistics and Trades and other tabs.
For understanding of how order fills are matched and the Position Quantity is determined, refer to Open Quantity Field Calculation Method and Order Fill Matching and Flat to Flat Definition. This is essential to understand!
In the case of the Trade Activity Log, the Date Range to Display >> From [Date] [Time] setting directly controls the first order fill Date-Time loaded into this Trades list.
For non-simulated trading, it is supported to filter out the initial order fills that are loaded in the Trades list which are part of an existing Position so that the first fill loaded in the Trades list will always be aligned to the start of a Position. This ensures accurate fill matching and Trade Statistics. To do this, enable Edit >> Filter Initial Fills Part of Existing Position on the Trade Activity Log menu. In the case of Simulated trading, that option is always considered enabled and the filtering occurs. For more information, refer to this video: Order Fill Matching and Trade Statistics.
For charts which are maintaining their own Trades list and Trade Statistics which includes charts that are used for Trading, the first order fill Date-Time loaded in the chart is determined by the Order Fills Start Date-Time setting.
When setting the Date-Time of the first order fill to load in a Trades list, you need to understand that the order fills may not be available starting from that particular Date and Time. Additionally, you can have other order fills missing from that start Date-Time until the current Date-Time. For further information, refer to Missing Order Fills from Trade Activity Log. It is essential to understand missing order fills because if they are missing, this will affect the generated Trade Statistics and Trades and therefore will result in erroneous information presented.
Also refer to Automatically Aligning First Loaded Order Fill to Beginning of Position.
Automatically Aligning First Loaded Order Fill to Beginning of Position
For accurate generation of Trades, Trade Statistics, Profit/Loss values like the Daily Profit/Loss, order fill entries and exits on charts, and the other tabs of the Trade Activity Log, from the order fills, it is necessary that the first fill loaded into the Trades list in a chart or in the Trade Activity Log is the start/beginning of a position.
This is explained in the Understanding and Setting the Start Date-Time for a Trades List section.
There is a way for this to be managed automatically.
In the case of the Trade >> Trade Activity Log, enable Edit >> Filter Initial Fills Part of Existing Position.
In the case of a chart, enable Chart >> Chart Settings >> Trading >> Filter Initial Fills Part of Existing Position.
In the case of when using Trade Simulation Mode or for simulated order fills, these options are always considered to be enabled.
When this is enabled, order fills starting at the specified Order Fills Start Date-Time will become filtered until a fill is found which is the start of a new Trade Position which may very well be the first fill loaded anyway.
The reason that this can be achieved with is because the Position Quantity that exists just after the fill, is recorded with the fill. Although this is not always the case for order fills downloaded from the remote server.
However, when using the Teton Futures Order Routing Service or the Simulated Futures Trading Service, that the Position Quantity is recorded with each fill on the remote trading server. This is why these services should be the preferred services to use Sierra Chart with because they are above and beyond the capability of other services in this area and many other areas.
Whereas with other external Trading services not only do they just provide order fill history for the current trading day, if any, there is no Position Quantity recorded with them. Whereas Sierra Chart provided Trading services provide order fills for at least 1 year and have the Position Quantity. A dramatic difference!
In addition to the above, it is essential that there are also no missing Order Fills for a period of time in order to generate a proper Trades list and Trade Statistics for that same time period. For more information, refer to Missing Order Fills from Trade Activity Log.
Trade Activity Not Displaying or Clearing (Improving Trade Activity Query Performance)
When performing some operation which involves the obtaining or clearing of Trade Activity Data, there is a query made on a background thread to perform this operation. Until this query completes, the displaying of the Trade Activity data will not occur or the completion of the clearing of the Trade Activity will not occur.
Queries are also made for Trade Activity order fills which are loaded into the Trades list of a chart which is used for various Trade Statistics calculations, display of order fills, and the Position Quantity for a particular chart. Until this query completes for a particular chart, this data will not display in a chart.
This query normally will be completed in less than 100 milliseconds but it could take longer. If there is a huge amount of Trade Activity which has to be processed, perhaps this could take an entire minute or longer. A long query time is a very unusual case though.
There can also be multiple outstanding trade activity queries which need to be processed. Only one can be processed at a time and they are placed in a queue. So if there are several outstanding queries that still have to be done, then doing something like enabling the display of order fills on the chart, will not result in the immediate display of the fills.
The queries ahead of the query needed for those fills needs to complete and then the query for those fills needs to complete. You can see the status of the completed queries in the Trade >> Trade Service Log. And there is also an indication in the log message of how many outstanding queries there are at the time of a completed query.
The number of outstanding queries can also be viewed on the Trade Activity Log through the Query Count indication:
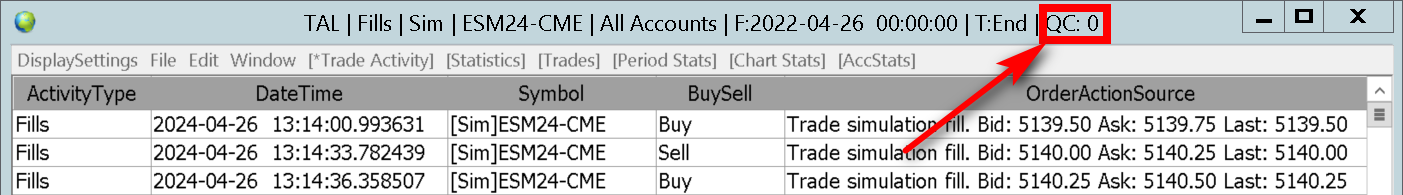
To delete old or excessive Trade Activity, refer to Clearing Trade Activity Data.
Another and faster way to clear Trade Activity data efficiently and in bulk is to go to the TradeActivityLogs subfolder in the Sierra Chart installation folder. Delete the trade activity files there that you no longer need. For example, if you want to delete simulated trade activity, delete the files which end with UTC.Sim#.simulated.data. Only delete Trade Activity files when Sierra Chart is not running.
When Trade Activity data is cleared following the method described in the Clearing Trade Activity Data section, backup files are made. Therefore, delete the backup trade activity files in the /Backups subfolder in the Sierra Chart installation folder.
The following are examples of operations which will not immediately complete if there is a long time to complete a trade activity query. So the intended result will take some time to actually occur in this case.
- Clearing Trade Activity.
- Displaying of order fills on the chart.
- Determining the current Trade Position Quantity and Price on the chart for simulated trading, after the chart is loaded. Or any time there is a change in Chart Settings, there is a reload of the internal Trades list which is used to calculate the current Trade Position Quantity.
- Configuring controls on the Trade Activity Log and pressing the Apply button and waiting for the results to appear.
As of version 2031, trade activity data is now stored in files which contain the trade account identifier rather than multiple accounts within the same file for each day, to improve query performance. To convert any existing files you have, that do not use the trade account, select Global Settings >> Convert Trade Activity Format.
Press Yes to confirm. The above step only needs to be done once.
Trade Activity Log Read Errors
In rare cases, there could be errors when reading a Trade Activity Log file. If a message like the following appears in the Trade >> Trade Service Log, then it means that the Trade Activity Log file has become corrupted or damaged in some way. The file will need to be deleted.
Solving Trade Activity Incorrect Price Formatting and P/L Values
The price values and the Profit/Loss values displayed in the Trade Activity Log, depend upon having Symbol Settings for the symbol. These are located in Global Settings >> Symbol Settings.
Otherwise the price formatting will be incorrect, the decimal position can be wrong. And the Profit/Loss values will be wrong as well.
It needs to be understood that order fills relating to one particular Trading service, cannot be properly displayed when the Global Settings >> Data/Trade Service Settings >> Current Selected Service, is currently set to a Trading service different than the Trading service the order fills are from.
Therefore, to look at order fills for one particular Trading service, requires that Global Settings >> Data/Trade Service Settings >> Current Selected Service is set to that Trading service. When this is changed, you need to select Edit >> Refresh Log on the Trade Activity Log menu.
Another solution to the problem is to install another installation of Sierra Chart, set to the particular Trading service that you want to use for viewing order fills from that Trading service. Refer to Using Multiple Data and Trading Services at the Same Time. You can copy the files in the TradeActivityLogs subfolder in the Sierra Chart installation folder for your current installation, to the same subfolder in that new installation.
Another item to be aware of, is if your Trade Activity Log contains order fills from two or more different Data/Trading services, and if the Date-Time range settings in the Trade Activity Log are including fills from two or more services, you cannot set the Symbol Filter to All Symbols. Instead, only a specific symbol. Otherwise, the data from two different incompatible symbols will be conflicting.
There is also the ability to export Trade Activity data from one instance of Sierra Chart and import it into another instance. Refer to Importing Exporting Data.
*Last modified Thursday, 18th April, 2024.