Chart Trading and the Chart DOM
- Chart Trading
- Entering Orders from the Chart
- Attaching Trade Window to Chart
- Viewing Orders and Trade Position on the Chart / Trade DOM
- Enabling Display of Orders and Trade Position, and Configuration of Orders and Trade Position Display
- Viewing Simulated and Non-Simulated Working Orders and Trade Position
- Viewing Working Orders Outside the Visible Price Range
- Trade Position Line
- Working Order Lines
- Size and Positioning of Working Orders Lines, Position Line, and Order Fills Displayed On Chart
- Change Location of Orders and Position Lines on Chart
- Modifying and Canceling Orders on the Chart
- Moving Orders Using Chart Trading Shortcut Menu
- Changing Order Quantity
- Modifying or Canceling Orders that Are Not Visible on The Chart/Trade DOM
- Modifying Orders To a Price Level That Is Not Visible on The Chart/Trade DOM
- Separating Groups of Orders into Separate Charts or Trade DOMs
- Enabling/Disabling Automatically Rejecting Orders which will Fill Immediately or be Rejected
- Chart DOM Position Profit and Loss Column
- Viewing Open, Daily, and Cumulative Closed Profit/Loss
- Trade DOM
- Entering Orders on the Trade DOM
- Modifying or Canceling Orders
- Setting Update Interval
- Displaying Market Depth Data
- Customizing Trade DOM and Chart DOM Columns
- Trade DOM and Chart DOM Font and Colors
- Using Compact Working Order Lines
- Re-Centering the Current Price
- Detaching Trade Window
- Attaching Trade Window to Right Side
- Left Aligning Order and Position Lines
- Saving Trade DOM Configuration
- Always on Top
- Daily Volume Profile (Volume by Price) on Trade DOM
- Adding Studies on a Trade DOM
- Adding Custom Text to a Trade DOM
- Blank Trading DOM
- Improving Performance of Trading DOM
- Using the Chart DOM / Order Entry Ladder
- Customizing Fonts, Colors, Line Styles, and Widths for Chart Trading, Chart DOM, and Trade DOM
- Customizing Fonts, Colors, Line Styles, and Widths for Chart Trading, Chart DOM, and Trade DOM (Opens a new page)
- Displaying Order Fills on the Chart
- Chart Order Fills Do Not Display
- Accurate Entry/Exit State, Fill Matching and Position Quantities
- Displaying Order Fill Arrows Only
- Order Fills on Continuous Futures Contract Charts
- Misaligned Order Fill Markers on Charts
- Resolving Problem Where Order Fill Entry/Exit Connecting Lines Do Not Display
- Displaying Order Fill Text Tag or Notes
- Delay with Displaying Order Fills / No Fills Displayed
- Automatically Scrolling Chart to Order Fills
- Displaying Orders, Position, and Order Fills on Other Charts
Chart Trading
To enable Chart Trading, go to the chart you want to trade from and make sure there is a checkmark by Trade >> Chart Trade Mode On on the menu. Chart Trade Mode is specific to each individual chart you have in your Chartbooks. Therefore, some charts can be activated for chart trading and others not.
You can enter trade orders, view orders and modify orders directly on a chart. Below are all of the sections which explain these various tasks.
Entering Orders From the Chart
- Make sure there is no checkmark by Trade >> Trade Simulation Mode On if you want the orders to be sent to the external Trading service. If you want the orders to be simulated within Sierra Chart, then make sure there is a checkmark by that menu command.
- To enter orders from a chart you first need to enable Chart Trade Mode. To do this make sure there is a checkmark by Trade >> Chart Trade Mode On on the menu.
- Chart Trade Mode is specific to each individual chart. They all have their own independent setting. You can tell when Chart Trade Mode for a chart is enabled by looking at the top left of the chart.
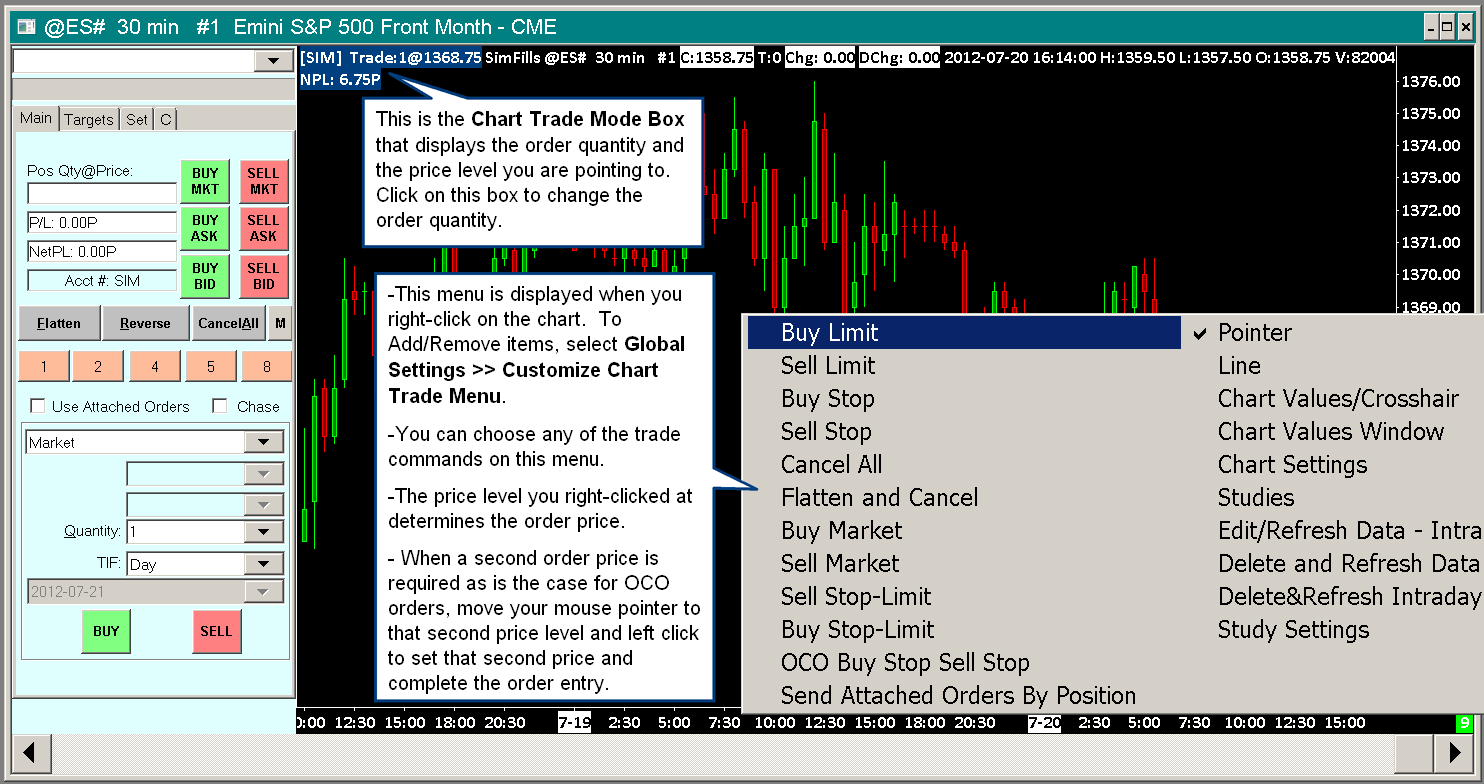
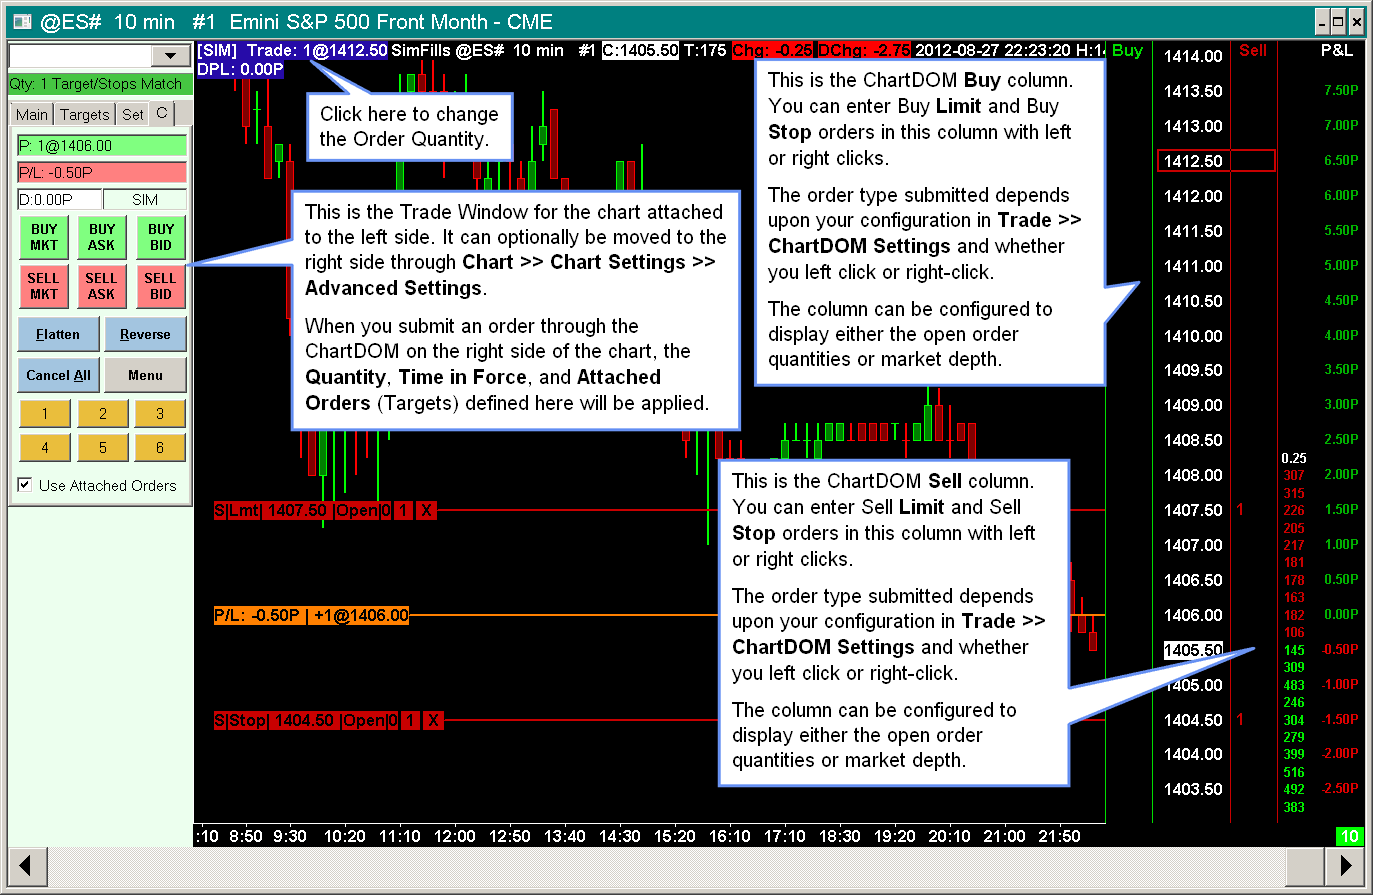
You will see the Trade Mode Box (Trade:) which indicates the order quantity and the order price for new orders. The order price displayed in the Trade Mode Box is determined by the price level that you are pointing to with your Pointer. Refer to the image to the right for the Trade Mode Box. - The color of the chart Trade Mode Box at the top left is set through Global Settings >> Graphics Settings. The background color is controlled with the color setting for Chart Trade Mode Box (for non-simulated trade mode) and Chart Trade Mode Box - Simulation (for trade simulation mode). The foreground color is set with the Chart Text color setting.
- To change the Order Quantity for a new order, simply click on the Trade Mode Box at the top left of the chart (refer to image), type in the desired order quantity or use the + and - buttons. Press OK to accept.
The trade quantity can also be set through the Trade Window for the chart using the Quantity box or any of the quantity buttons. For details, refer to Order Quantity. To open the Trade Window, refer to Opening Trade Window. - Open the Trade Window by selecting Trade >> Open Trade Window for Chart or Trade >> Attach Trade Window to Chart on the menu. Select the Main tab and set the Time in Force (TIF) to what you require. On the Targets tab, Attached Orders have their own Time in Force (TIF) setting that needs to be set if you are using Attached Orders.
- Select the Targets (Attached Orders) tab if you want to use Attached Orders (Targets and Stops). Configure the Attached Orders as required by following the instructions on the Attached Orders documentation page. If you need to use Attached Orders with the order you will be submitting from the chart, then make sure Use Attached Orders is enabled on the Main/C tab of the Trade Window.
- The price you see displayed in the Trade Mode Box at the top left is set by where your mouse pointer is currently pointing to on the chart. As you move the mouse pointer up and down, you will see the price change accordingly in the Trade Mode Box. Refer to the image on the right.
- Make certain the order types and order commands that you wish to use are added to the Chart Trading Menu. To do this, select Global Settings >> Customize Chart Trade Menu. Add all of the order types that you want to use.
- Single Price Orders and Market Orders: To enter an order from the chart, move your mouse pointer to the price level that you want the order price to be at, unless it is a Market order. Right click with your mouse pointer at that price level to display the Chart Trade Menu and select from the displayed menu the type of order you want to be entered. You will get an order confirmation window, if enabled. Press Yes to confirm or No to reject the order entry. To disable confirmations press the Menu (M) button on the Trade Window and disable the confirmation options that you do not want.
Stop-Limit Orders
Move your mouse pointer to the price level where you want the Stop order. Right-click on the chart and select either Buy Stop-Limit or Sell Stop-Limit. The Limit price is automatically set and will be the number of ticks away from the Stop price as specified on the Set tab on the Trade Window ( Trade >> Open Trade Window for Chart) for the chart in the Stop-Limit Order Limit Offset >> Primary Orders box.
Entering OCO Orders Which Use 2 Prices
There are several OCO (Order cancels Order) Order Types that you can enter which use 2 prices. These orders consist of two individual orders in an OCO group. When one of these orders fills or is canceled, the other one will be automatically canceled. They are as follows:
- OCO Buy Limit Sell Limit
- OCO Buy Stop Sell Stop
- OCO Buy Stop-Limit Sell Stop-Limit
- Buy OCO Limit and Stop (does not support Attached Orders)
- Sell OCO Limit and Stop (does not support Attached Orders)
- Buy OCO Limit and Stop-Limit (does not support Attached Orders)
- Sell OCO Limit and Stop-Limit (does not support Attached Orders)
You first need to make certain that these order types are added to the Chart Trading Menu. To do this, select Global Settings >> Customize Chart Trade Menu. Add all of the order types that you want to use.
To have Attached Orders attached to each of these orders in the OCO group, then enable Use Attached Orders on the Trade Window for the chart or Trade DOM. For complete instructions for Attached Orders, refer to Attached Orders. Not all OCO Order Types support Attached Orders as noted above.
- Right-click on the chart or Trade DOM at the level you want to set the first price. In the case of the Trade DOM, refer to Entering Orders on the Trade DOM for instructions on where to click.
- Select one of the above OCO order types from the menu. For example, if you selected Buy OCO Limit and Stop, then the price level where you right clicked at to display the chart trading menu, will have set the Limit price.
- Move your mouse pointer to the price level where you want to set the second price for the OCO order and left click.
- You can cancel the order input procedure with a second right click at any time. Or when you get an order confirmation, if enabled, you can press No to not accept the order.
Entering an OCO Auto-Set Order
There are several OCO (Order cancels Order) Order Types that you can enter which use a single center price. These orders consist of two individual orders in an OCO group. When one of these orders fills or is canceled, the other one will be automatically canceled. The order prices are set from the single price you select on the chart. The order types are as follows:
- OCO Buy Limit Sell Limit (Auto-Set)
- OCO Buy Stop Sell Stop (Auto-Set)
- OCO Buy Stop-Limit Sell Stop-Limit (Auto-Set)
- You first need to make certain that these order types are added to the Chart Trading Menu. To do this, select Global Settings >> Customize Chart Trade Menu. Add all of the order types that you want to use.
- Right-click on the chart at the center price for the 2 orders. The 2 orders in these OCO order group types are each offset from the center price by the Auto-Set Prices Offset for OCO Buy Sell Orders setting on the Set tab on the Trade Window for the chart. Select one of the above OCO order types. You will get an order confirmation, if confirmations are enabled.
- Attached Orders (Target and Stops): When entering an order from the chart, Attached Orders will be attached to that order if Use Attached Orders is enabled on the Main/C of the Trade Window and there are Attached Orders defined. If there are two orders being entered as part of an OCO group, then each of those orders will have Attached Orders attached to them. For more information, refer to Attached Orders.
Using the Chart DOM
It is supported to enter orders on the right side of the chart through a price ladder type of interface. This is called the Chart DOM. For instructions to use this, refer to Using the Chart DOM / Order Entry Ladder.
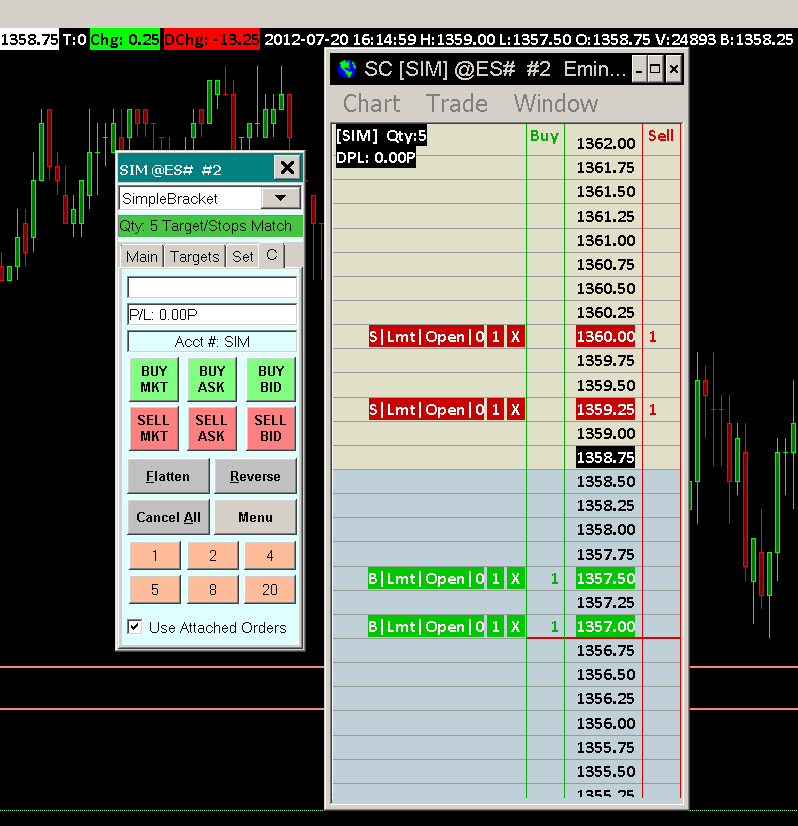
Attaching Trade Window to Chart
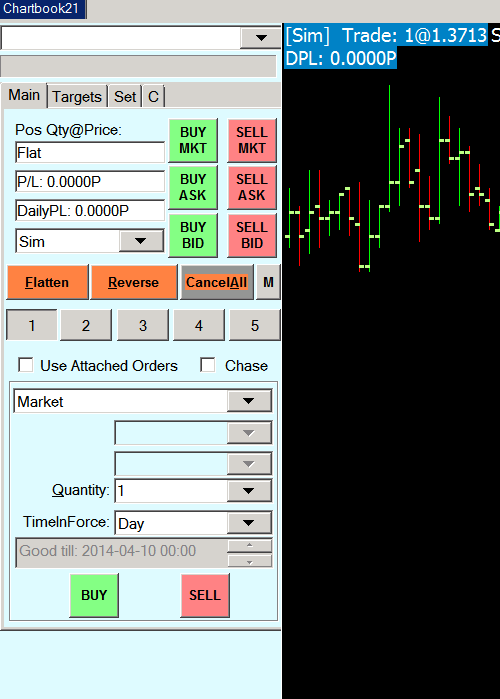
The Trade Window which is used for basic order entry, contains Attached Order settings and other trading related settings, can be attached to a chart. Refer to the image below.
To attach the trade window, go to a chart or Trade DOM and select Trade >> Attach Trade Window to Chart.
By default the Trade Window is attached to the left side of the chart. To attach it to the right side, enable Chart >> Chart Settings >> Trading >> Attach Trade Window to Right Side.
Viewing Orders and Trade Position on the Chart / Trade DOM
Enabling Display of Orders and Trade Position, and Configuration of Orders and Trade Position Display
- To view Working Orders and the current Trade Position for the Symbol and Trade Account of the Chart or Trade DOM, there needs to be a checkmark by Trade >> Chart Trade Mode On, Trade >> Trading Chart DOM On, or Trade >> Show Orders and Position for the active Chart or Trade DOM.
- If it is not necessary to trade from the chart, then it is only necessary that Trade >> Show Orders and Position be checked.
- To see the orders that have originated from another chart or Trade DOM, make sure that Trade >> Only Orders from Chart is unchecked.
Make sure the correct Trade Account is selected on the Trade Window for the chart, that you want to view the Orders and Position for. To make sure you are setting the Trade Account on the correct Trade Window, refer to Opening Trade Window for Chart.
The symbol of the chart or Trade DOM needs to be set to the exact same symbol as the symbol of the chart or Trade DOM the orders were entered from. Refer to Changing the Symbol of a Chart for instructions to change the symbol if necessary.
All of this is essential. - All of these options are specific to each individual Chart/Trade DOM window and apply to the active Chart/Trade DOM window.
- When an order is in a Working state it will be displayed on the chart. This means the order Status is one of the following: Pending Open, Open, Child-Client, Child-Server, Pending Modify, Pending Cancel.
Only those orders which are at a price which are within the visible range of prices on the chart, will actually be viewable. You can use the Interactive Scale Range feature to expand and compress the price scale.
The order price is determined from the Price1 field for the order in the Trade >> Trade Orders Window. - If the order is a pending child order, then to make sure it is displayed, press the M / Menu button on the Trade Window for the chart and make sure there is no checkmark by Settings >> Hide Pending Attached Orders.
- The information that is displayed on the Orders and Position lines on the chart can be customized. To customize them, select Global Settings >> Chart Trade Settings on the menu. The settings are located within the Working Orders and Position frames on the Chart Trade Settings window.
For more information, refer to the Chart Trade Settings documentation.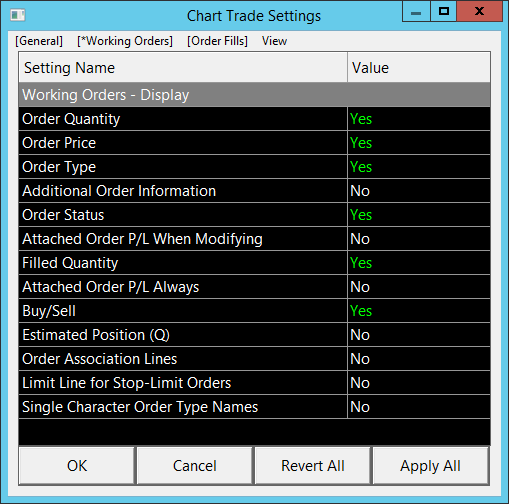
- To change Color, Line Style, and Width settings of the Orders and Position lines, refer to the Customizing Fonts, Colors, Line Styles, and Widths for Chart Trading, Chart DOM, and Trade DOM documentation.
Viewing Simulated and Non-Simulated Working Orders and Trade Position
First follow the instructions in the Enabling Display of Orders and Trade Position, and Configuration section.
Make sure the correct Trade Account is selected on the Trade Window for the chart that you want to view the working Orders and Trade Position for.
To view non-simulated working Orders and the current Trade Position from your Trading service on the chart for the Symbol and Trade Account the chart is set to, make sure there is no check mark by Trade >> Trade Simulation On on the menu. And make sure Sierra Chart is connected to the trade server by selecting File >> Connect to Data Feed. This command also means connecting to the trade server as well.
To view simulated Orders and the associated Trade Position which has been entered from Sierra Chart, make sure there is a check mark by Trade >> Trade Simulation On.
To view either simulated or non-simulated Orders and the associated Trade Position from the main instance of Sierra Chart when using a sub instance, Trade >> Trade Simulation On must be unchecked or disabled in the sub instance.
To view all working Orders for the Symbol and Trade Account of the active chart, make certain there is no check mark by Trade >> Only Orders from Chart. This command is specific to each individual chart.
To view working Orders and Trade Position that were submitted only from the active chart, go to that chart and make certain there is a checkmark by Trade >> Only Orders from Chart. This command is specific to each individual chart.
Viewing Working Orders Outside the Visible Price Range
You may have working orders including Attached Orders which are outside of the visible price range.
The easiest way to bring them into view is to compress the vertical scale by using Interactive Scale Range.
To use this, right-click on Values Scale on the right side of the chart and select Interactive Scale Range, and then click and drag the right side Values Scale to compress the scale until the orders come into view.
The price at which an order is displayed at on the chart is determined from the Price1 field for the order in the Trade >> Trade Orders Window.
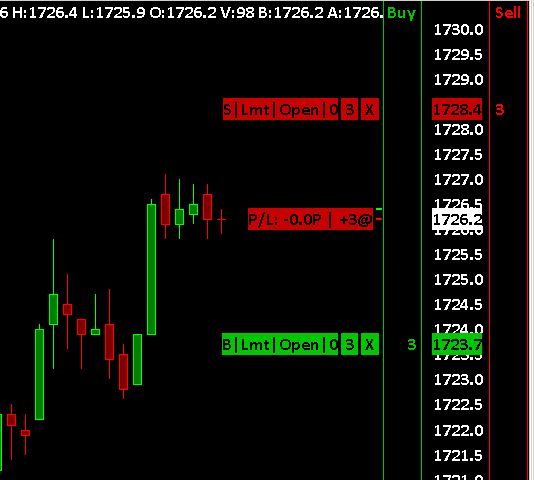
Trade Position Line
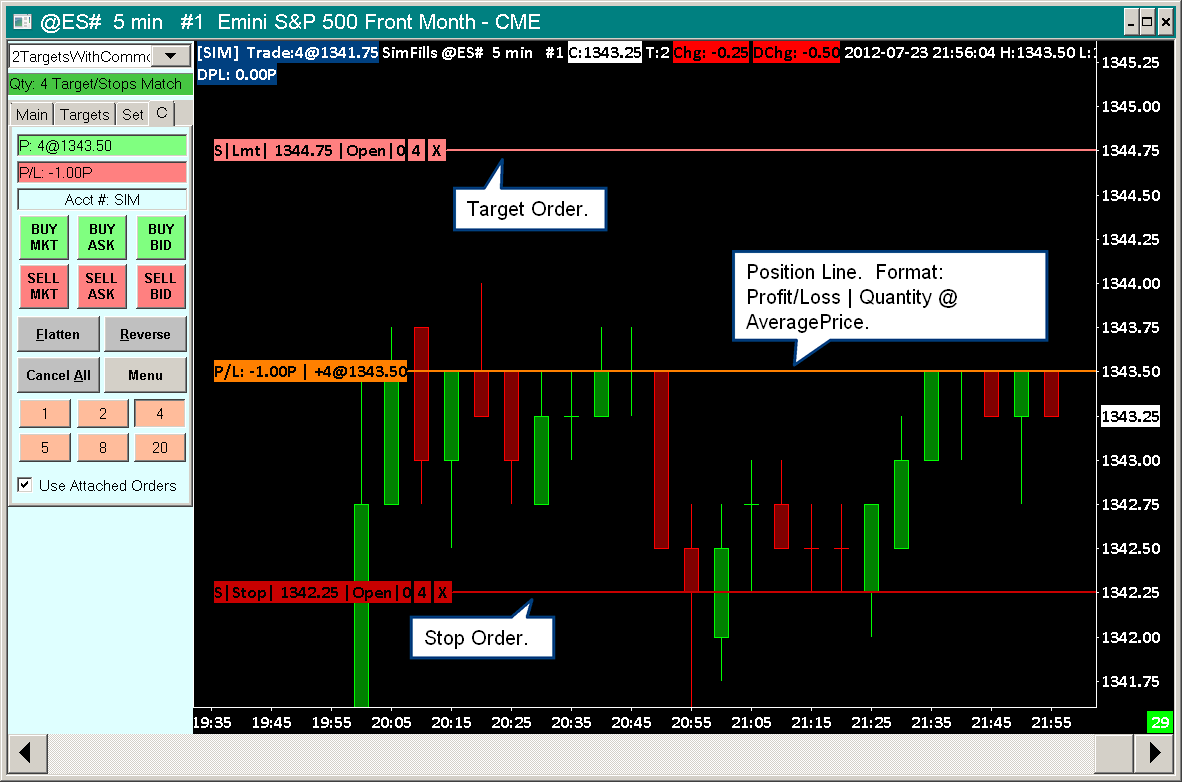
The current Trade Position for the symbol will be displayed on the chart as a line if a position exists for the symbol. Refer to the image above. The format of the position line text is P/L: [quantity]@[price] | [open profit/loss] and is displayed on the left side of the position line, unless Chart >> Chart Settings >> Trading >> Align Trade Drawings to Right Side is enabled.
It will be displayed on the right side if Align Trade Drawings to Right Side is enabled.
There are various display formats for the Profit/Loss value for the Position line. To change the format, select Chart >> Chart Settings >> Trading. Set the Profit/Loss Format to what you require. For more information, refer to Profit/Loss Format on the Chart Settings page.
Working Order Lines
When there is a working order for a symbol, it is displayed on the chart as a line at the price level on the chart that matches the order price. For example, a Limit order will be displayed at the Limit price and a Stop order will be displayed at the Stop price. Along each working order line there are clickable buttons to cancel (X) the order and change the order quantity. Along the working order line, there is text information about the order. The text information is explained below.
- Buy or Sell: B is displayed for Buy orders and S is displayed for Sell orders.
- Order Type: An abbreviated description of the order type of the order.
- (Price): In the case of Stop-Limit orders, the price you see displayed after the Order Type in parentheses is the Limit price. The CME exchange will convert Stop orders to Stop-Limit orders and set the Limit price a certain distance from the Stop price. So sometimes you will see Stop orders display this price in parentheses.
- Break Even Trigger Price: In the case of a Break Even Trigger and the Display Additional Order Information option is checked on, this displays the price associated with the Break Even Trigger. This is preceded by the notation BETrig:.
- Trailing Trigger Price: In the case of a Trailing Trigger and the Display Additional Order Information option is checked on, this displays the price associated with the Trailing Triggger. This is preceded by the notation TrailTrig:.
- Estimated Position in Queue: In the case of a Limit order and Display Detailed Order Information and Display Estimated Position and Estimated Position in Queue Tracking settings are enabled, this displays the estimated position in the size/quantity on the bid side or ask side depending upon whether the order is a buy order or a sell order respectively.
As this number approaches 0, the Limit Order becomes closer to being filled. This is preceded by the notation EP:

When the order is based upon the Trade and Current Quote Symbol for the chart and Use As Trade Only Symbol is enabled, then it may not be possible for the estimated position to be determined since there may not be Market Depth data available for the symbol. And if there is Market Depth data available for the symbol through another chart being opened for the Trade symbol, the problem is that the estimated position is not going to make sense relative to the Market Depth data you are seeing in the chart. Since that Market Depth data is for the main symbol of the chart. - Order Status: The current status of the order. This matches the Status of the order on the Trade >> Orders and Positions >> Orders window tab.
- Filled Quantity: The filled quantity represents the quantity of the order that has already been filled.
- Price: The price number that is displayed is the price of the order. This number is formatted to the Price Display Format set in Chart >> Chart Settings >> Symbol on the menu.
- Total Quantity: When there are multiple orders at the same price, the total quantity is displayed in the text information for the order. After TQ: is the total quantity.
For example, a Limit order with a price of 100 is displayed as: B|Lmt|Open|0 100.0. This is a Buy Limit order. The current order status is Open. Zero shares/contracts have filled. The Limit Price is 100.0.
Size and Positioning of Working Orders Lines, Position Line, and Order Fills Displayed On Chart
Below are various settings which affect size and positioning of trade related objects on the chart.
- To align the Order lines and the Position line to the right side of the chart beside the Values Scale, select Chart >> Chart Settings >> Trading and enable Align Trade Drawings Text to Right.
After doing this you will want to add some fill space to the right side of the chart by scrolling past the rightmost bar in the chart using the scrollbar at the bottom of the chart. After you add some fill space, enable Chart >> Lock Fill Space. You will first need to unlock the fill space first before scrolling if it is locked.
Uncheck Align Trade Drawings Text to Right if you do not want the Order lines and the Position line aligned to the right side of the chart. - To align just the close (X) button of Open Order lines to the right side of the chart beside the Values Scale, select Chart >> Chart Settings >> Trading and enable Align Order Cancel Button (X) to Right.
- Select Chart >> Chart Settings >> Trading and set the Trade Drawings Left Align % to the percentage that the trade drawings should be aligned from the right side of the chart. 100% means they are aligned all the way to the far left of the chart. This setting only applies when Align Trade Drawings Text to Right is disabled.
- Reduce or increase the Chart Text Font size in Global Settings >> Graphics Settings.
- For Working orders, you can disable a setting to reduce the amount of text information displayed along the line. Select Global Settings >> Chart Trade Settings on the menu. Uncheck Working Orders >> Display Detailed Order Information.
- For Order Fills, select Global Settings >> Chart Trade Settings and reduce or increase the Order Fills >> Text Size. There are also various other options for Order Fills. To hide the Order Fill text, uncheck Order Fills >> Display Fill Text.
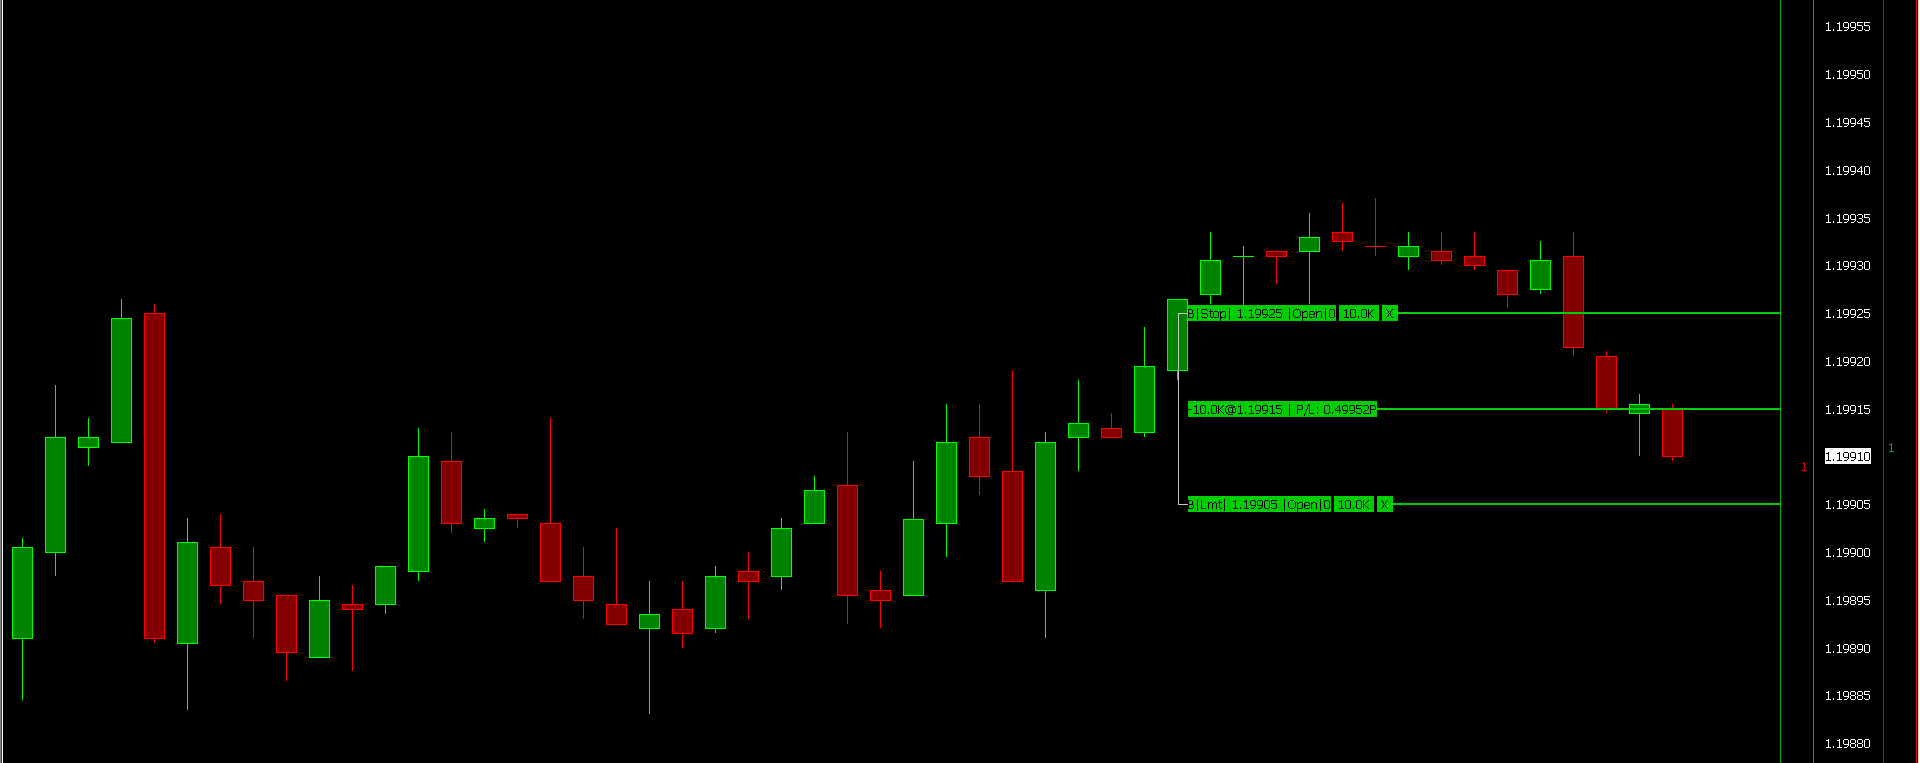
Change Location of Orders and Position Lines on Chart
By default, the Position and Orders lines are displayed on the left side of a chart. To change the location of this information, follow the instructions below.
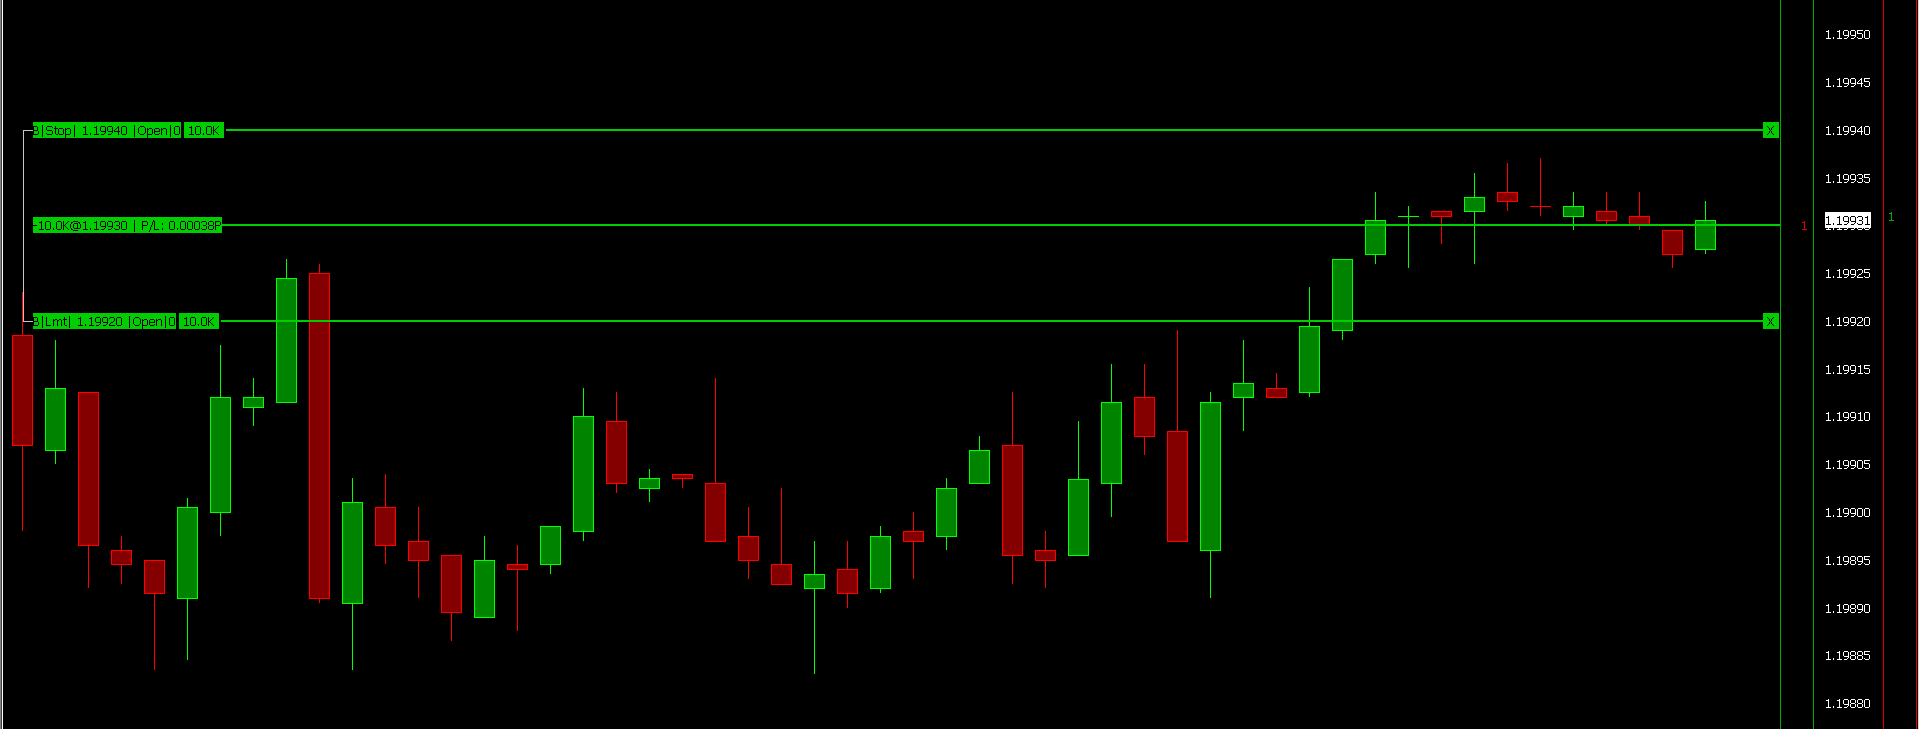
- To align the text of Working Order lines and the Position line to the right side of the chart as shown in the image below:
- Select Chart >> Chart Settings >> Trading.
- Enable the Align Trade Drawings Text to Right Side option.
- Press OK.
- After you do this you may want to create some space on the right side of the chart for the text. Refer to the Right Side Fill Space section about this.
- To align just the Cancel Button (X) of Working Order Lines to the right side of the chart:
- Select Chart >> Chart Settings >> Trading.
- Enable the Align Order Cancel Button (X) to Right option.
- Press OK.
- After you do this you may want to create some space on the right side of the chart for the text. Refer to the Right Side Fill Space section about this.
- To place the Position and Working Order Lines to some other location on the chart:
- Select Chart >> Chart Settings >> Trading.
- Set the Trade Drawings Left Align % to the percentage that the trade drawings should be aligned from the right side of the chart. 100% means they are aligned all the way to the far left of the chart and 0% means they are aligned all the way to the far right of the chart. This setting only applies when Align Trade Drawings Text to Right is disabled.
- Press OK.
Modifying and Canceling Orders on the Chart
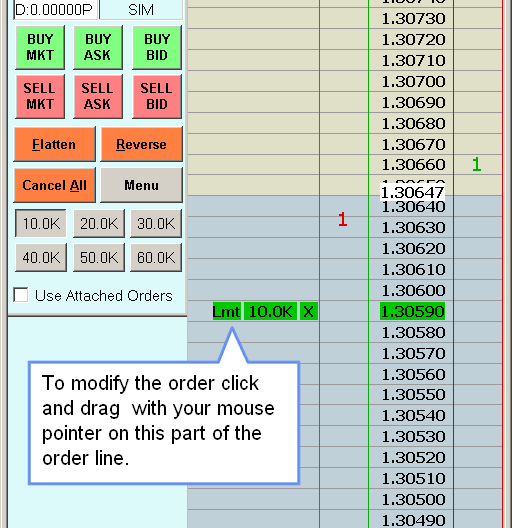
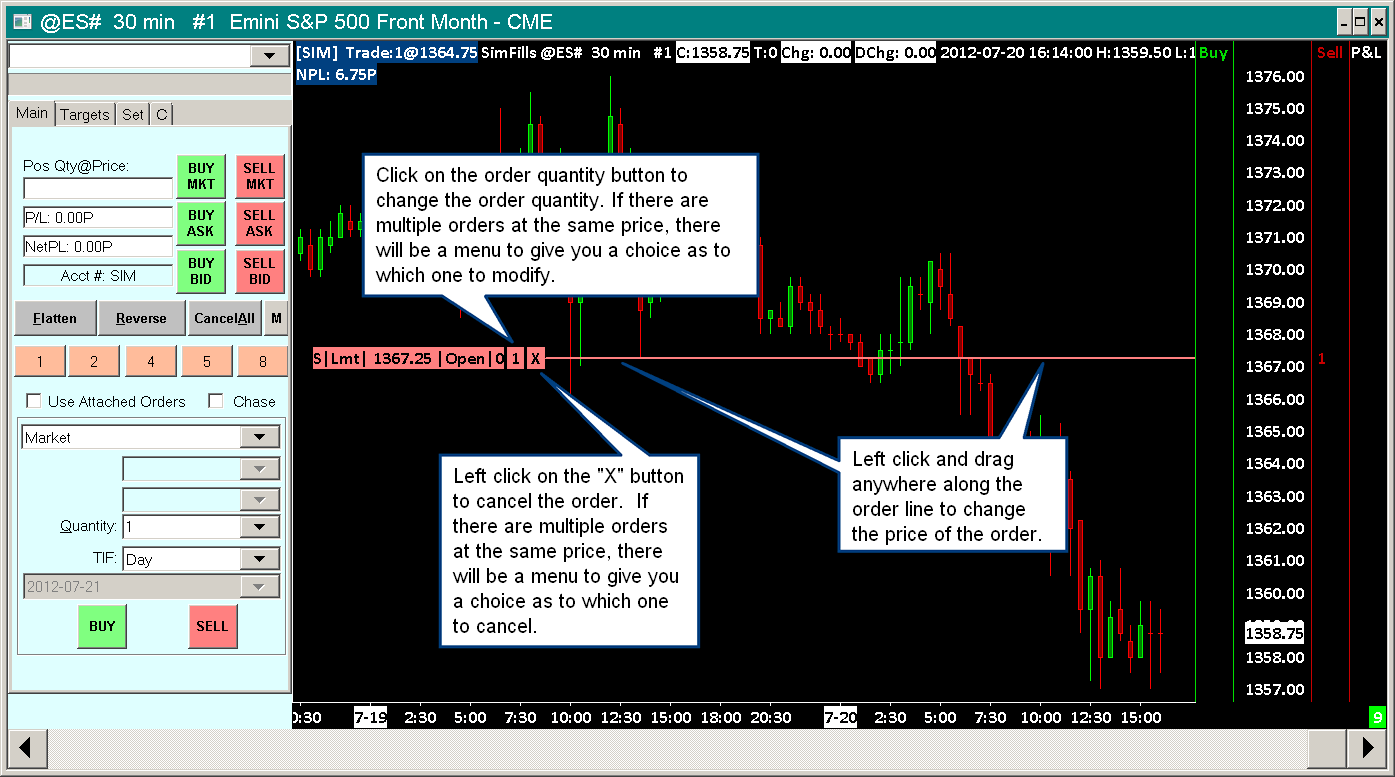 Modifying the Order Quantity: To modify the Order Quantity, press the Quantity Number button displayed on the order line as shown in the image.
If there are multiple orders at the same price level, then you will be given a menu listing all of the orders when you click on the Quantity Number button to let you select an order to modify.
A box will display allowing you to enter the new quantity. Enter the quantity or use the + and - buttons to change the quantity. Press OK to accept.
You will receive a confirmation to confirm modifying the order quantity. This can be disabled through the Menu/M button on the Trade Window.- Canceling an Order: Press the X button on the order line as shown in the image. If there are multiple orders at the same price level, then you will be given a menu listing all of the orders when you click on the X button to let you select an order to cancel. There is also the choice to Cancel All of the orders at that price level. You will receive a confirmation to confirm cancellation of the order or orders. This confirmation can be disabled through the Menu/M button on the Trade Window.
- Changing the Price of an Order: Left click and drag the order line as shown in the image to change its price. You are able to click and drag anywhere along the order line to modify the order except for the quantity and "X" buttons.
By default, when you left click you have to hold that state, and then drag the order and then release the left click button. This behavior is changeable. Refer to Working Orders >> Use Click, Release, Click Method to Adjust Orders.
You will receive a confirmation to change the price of the order. This can be disabled through the Menu or M buttons on the Trade Window. In the case of Attached Orders that use the All Groups OCO Group, when you modify the price of one of these orders, the others in the same group will be modified as well.
If after modifying the price of an order, you notice that the order line jumps back to the original price, then this indicates that the order modification was rejected. The reason it is rejected will be given in Trade >> Trade Service Log at the end of the log.
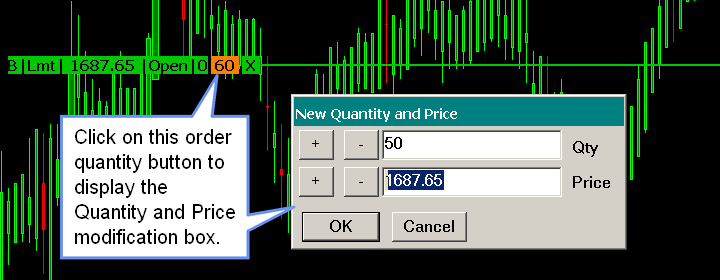
If an order modification is not completed, then no change to the order has occurred, in which case the order's position in the queue with the trading service does not change. For example, if an order has been moved up using click and drag, but then moved back to the original price before letting up on the left-click button, then the original order is still in place as it was prior to any movement. - Precision Price Modification of an Order: If you wish to make a small adjustment to an order in Tick increments and find it difficult to move to the exact price you want when interactively dragging the order line on a chart, then click on the order quantity. This will give you a box to modify the price. See image below. Press OK to complete the order modification.
Another method to precision modify an order from a chart is to select File >> Open Trading DOM . The symbol of the chart should already be preset in the Selected Symbol box. Press Open Trading DOM to open a Trading DOM.
On a Trading DOM window, the price scale is in 1 Tick increments. You can then click and drag the order very easily to the exact price that you want. If you cannot see the order, then refer to the Modifying or Canceling Orders that are Not Visible on the Chart/Trade DOM section. - When modifying the price of an existing trailing Stop order, you can choose to have the trailing Stop offset modified to match the distance between the price of the order and the current price, or the distance between the price of the order and the parent order price the Stop order is a Pending Child order. For further details, refer to Adjust Trail Offset When Modifying Trail Order.
Moving Orders Using the Chart Trading Shortcut Menu
The following sections describe chart trading menu commands for moving one or more Target or Stop Attached Orders on a particular Chart to a specific price level using the Chart Trading Shortcut Menu.
This only applies to Attached Orders which are displayed on the chart. It also includes Attached Orders, that are on the chart but not currently visible because they are at price levels which are not visible in the current price range.
In order for these menu commands to be available, they must first be added to the Chart Trade Shortcut Menu. This is done by using the Customize Chart Trade Menu and adding these specific items, described below, to the list.
In order to use these particular menu commands, simply right-click with your Pointer on the price level at which to move the orders to and select the appropriate menu command.
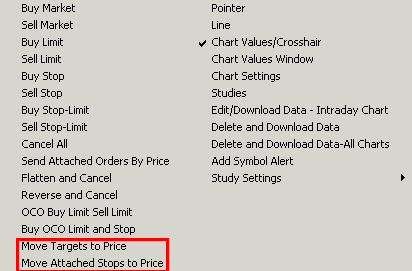
Move Targets To Price
Selecting this option on the Chart Trade Shortcut will move all open Targets to the price at which the Pointer was positioned when this option is selected.
If more than one order is moved, the total quantity (TQ:) shown in the Working Order Line after the move will be the sum of the moved orders.
Move Attached Stops to Price
Selecting this option on the Chart Trade Shortcut will move all Stop Attached Orders to the price at which the Pointer was positioned when this option is selected.
If more than one order is moved, the total quantity (TQ:) shown in the Working Order Line after the move will be the sum of the moved orders.
Changing Order Quantity
There are various methods available to change the quantity that will be associated with an order. The following gives an overview of each of these methods.
Changing Order Quantity on the Chart
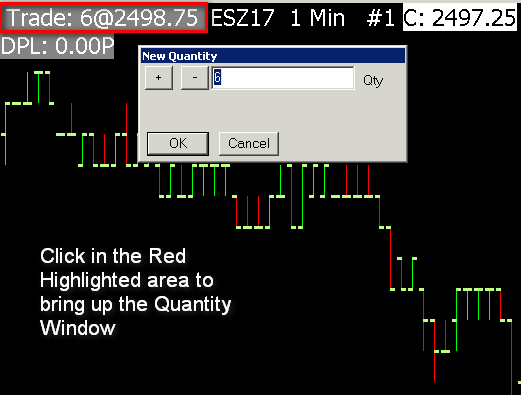
When the option Trade >> Chart Trade Mode On the trading information is displayed in the upper left corner of the chart window. In order to change the quantity from the chart, click your pointer on the top line of the shaded area where the quantity is displayed. The image below shows where to click and the Change Quantity window that displays. Enter a new value or use the +/- buttons to change the current value to the desired quantity. Select OK to accept the new quantity or Cancel to keep the previous entered quantity.
Changing Order Quantity on the Trading DOM
The order quantity can be changed in various ways on the Trading DOM window. In order to display the Trading DOM window for the active chart symbol, select File >> Open Trading DOM for Chart. To change the quantity use one of the following options. The image below shows the locations of these options.
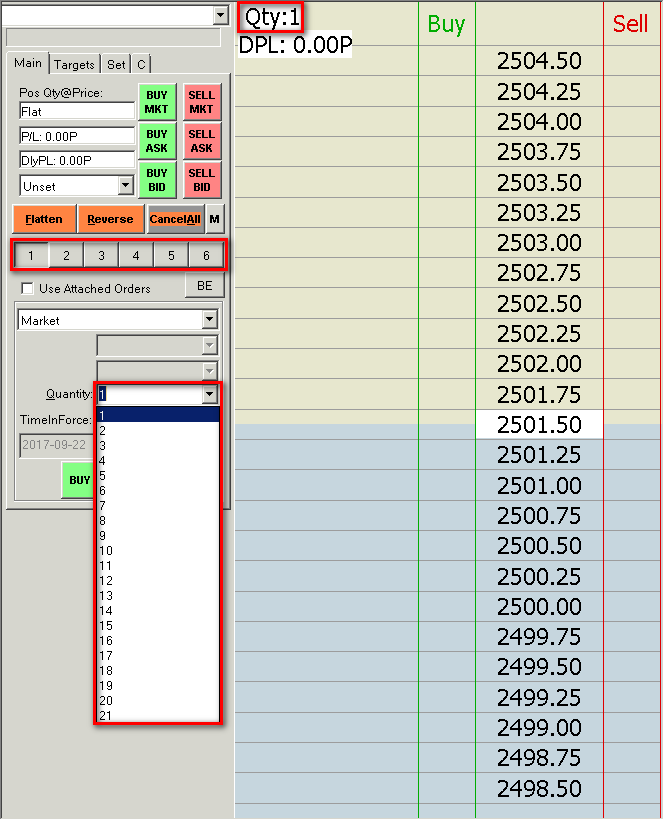
- Left Click with your pointer in the top line of the shaded area in the DOM where it displays the quantity.
- On the Main tab of the Trading DOM page the buttons numbered 1-6 allow you to quickly change the quantity to a value between 1 and 6.
- Enter a value in the Quantity list box.
- Select the arrow on the Quantity list box to show a list of numbers based on the currently entered value for the Quantity, and select a quantity.
Changing Order Quantity on the Trade Window
The Chart Trading Window is the same as the Trading DOM window, except it does not contain the Depth of Market chart. Therefore changing the quantity on this window is the same as for the Trading DOM. The image below shows the locations of where the quantity can be changed on this window.
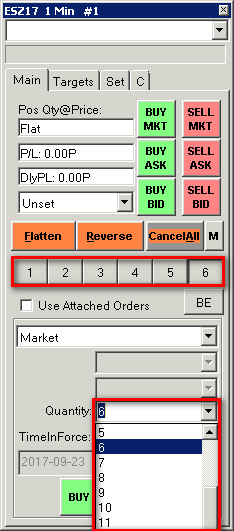
- On the Main tab of the Chart Trade page the buttons numbered 1-6 allow you to quickly change the quantity to a value between 1 and 6.
- Enter a value in the Quantity list box.
- Select the arrow on the Quantity list box to show a list of numbers based on the currently entered value for the Quantity, and select a quantity.
Modifying or Canceling Orders that Are Not Visible on The Chart/Trade DOM
Modifying Orders To a Price Level That Is Not Visible on The Chart/Trade DOM
Modify Order
To modify the price of an order that is not visible, or to modify an order to a price level that is not currently visible, follow these instructions:
- Go to the chart or Trade DOM and make certain that there is a checkmark by Trade >> Chart Trade Mode On.
- Right-click on the Values Scale on the right side of the chart or Trade DOM. Select Interactive Scale Range. For more details about this, refer to Interactive Scaling.
- Drag the Values Scale on the right side, up to compress it. The order will then come into view. Or you will then be able to see the price level you want to modify the order to. Modify the order as explained in the Modifying and Canceling Orders on the Chart section.
- Alternatively, you can right-click on Values Scale on the right side of the chart and select Interactive Scale Move, and then click and drag the right side Values Scale to move the chart up or down until the order comes into view. Or until you see the price level you want to modify the order to. For more details about this, refer to Interactive Scaling.
- Another method to modify an order that is not visible is to select the order through Trade >> Trade Orders Window and click on the [Modify] menu command. You will then be able to modify price or quantity of the order.
- Another method to modify an order to a price level that is not visible, is to click on the quantity number on the order line. A small window will display that allows you to modify the order price. Press OK to perform the order modification.
Cancel Order
To cancel an order that is not visible on a Chart/Trade DOM, follow these instructions:
- Go to the chart or Trade DOM and make certain that there is a checkmark by Trade >> Chart Trade Mode On.
- Right-click on the Values Scale on the right side of the chart or Trade DOM. Select Interactive Scale Range. For more details about this, refer to Interactive Scaling.
- Drag the Values Scale on the right side, up to compress it. The order will then come into view. Cancel the order as explained in the Modifying and Canceling Orders on the Chart section.
- Alternatively, you can right-click on Values Scale on the right side of the chart and select Interactive Scale Move, and then click and drag the right side Values Scale to move the scale up or down until the order comes into view. For more details about this, refer to Interactive Scaling.
- Another technique to cancel an order is to select Trade >> Trade Orders Window. Find the order in the list, select it and click [Cancel] at the top of the Orders window.
Separating Groups of Orders into Separate Charts or Trade DOMs
When there are multiple parent orders each with their own Attached Orders on the same Chart or Trade DOM, this can get confusing.
The first solution is to use the Order Association Lines which draws a line connecting each of the child orders to the parent order and connecting each of the OCO orders together so you know how they are associated with each other. For instructions, refer to Draw Order Association Lines. The Color, Line Style and Width can be set for these lines.
The next solution is to use separate Charts or Trade DOMs set to the same Symbol and Trade Account. Each one will have its own set of orders. They will only contain the orders that were directly entered from them. Therefore, eliminating any confusion.
To do this, follow these instructions:
- Go to the Chart or Trade DOM which you are using for order entry and use the Chart >> Duplicate Chart command to create a duplicate of it.
- On the duplicate chart, enable Trade >> Only Orders from Chart. You will know this is enabled when you see a checkmark by it. Do this for other Charts and Trade DOMs as well where you want this feature.
- Any orders you enter on these charts will only be displayed on the chart that they were entered from.
Enabling/Disabling Automatically Rejecting Orders which will Fill Immediately or be Rejected
There are two options which can be enabled which will cause orders entered from a chart to be rejected before being sent to the external trading service or being processed by Trade Simulation Mode, if they will immediately fill based on their Side, Price and Order Type, relative to the current trade price.
These options also affect orders which are submitted through trading keyboard shortcuts.
When an order is rejected messages like the following will be added to the Trade >> Trade Service Log:
Trade Order Error - Sell Stop must be at or below last trade price:
Trade Order Error - Trigger must be above last trade price:
Trade Order Error - Trigger must be below last trade price:
Trade Order Error - Buy Limit must be below or equal to last trade price:
Trade Order Error - Sell Limit must be above or equal to last trade price:
The options are as follows. Enable or disable them as you require.
Chart DOM Position Profit and Loss Column
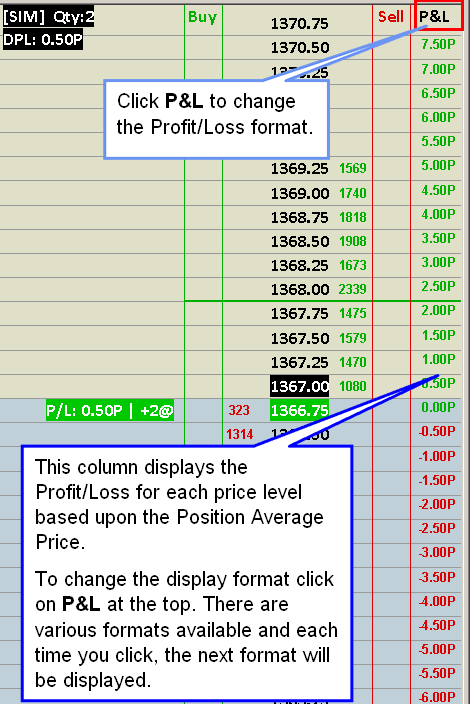
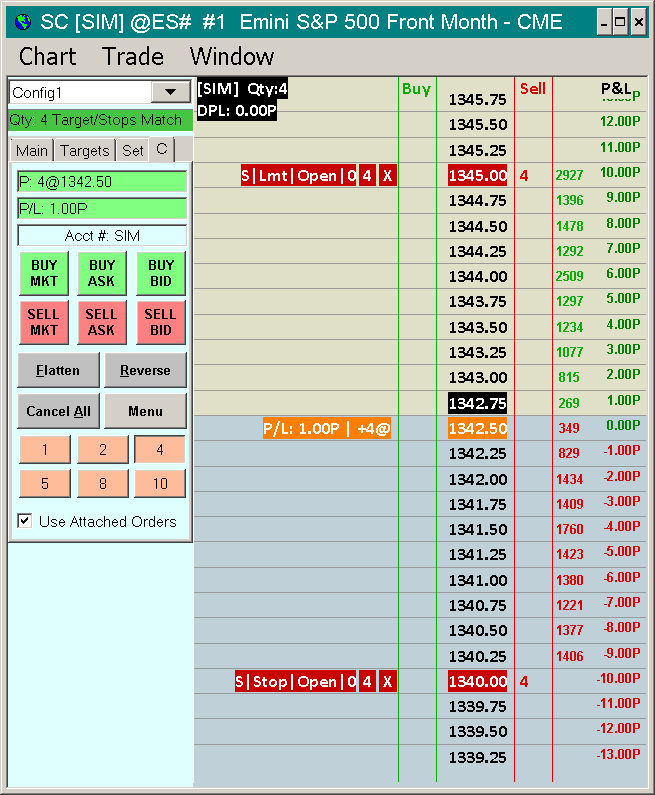
On a Chart DOM and on a Trade DOM window, a Profit and Loss column can be added which indicates what the profit or loss will be at each price level based upon the current trade Position. This is calculated based on the Position Average Price. To add this column, select Trade >> Customize Chart/Trade DOM Columns. Add the Profit & Loss column. Use the Move Up and Move Down buttons to position it where you require on the Chart DOM or Trade DOM.
There are various formats for the Profit/Loss values. These include Currency Value, Points, Ticks and various and combinations of them. Left click on the P&L label at the very top of the column to iterate through the various formats. Refer to image below. Refer to Profit/Loss Format for descriptions of each of the available formats.
To set the Profit/Loss format for the Trade Window (see image below), select Chart >> Chart Settings >> Trading. Set the Profit/Loss Format to the format you require or to Do Not Display. Refer to Profit/Loss Format for descriptions of each of the available formats.
Viewing Open, Daily, and Cumulative Closed Profit/Loss
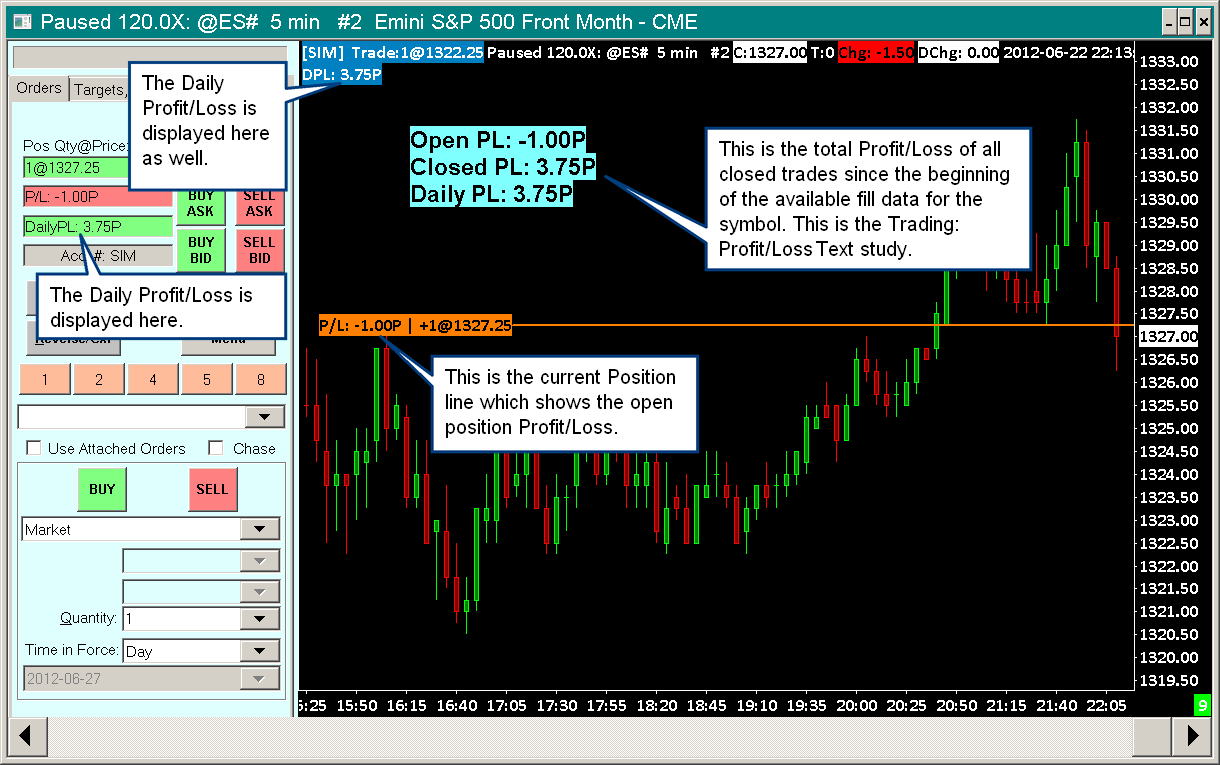
Open Position Profit/Loss
The Profit/Loss for the currently open Trade Position for a symbol can be viewed the following ways:
- The Open Position Profit/Loss can be viewed on the Position line on a chart when in Chart Trade Mode. Refer to Viewing Orders and Trade Position on the Chart.
- The Open Position Profit/Loss can be displayed anywhere on the chart with the Trading: Profit/Loss Text study. Refer to the documentation for the Trading: Profit/Loss Text study.
- The Open Position Profit/Loss is displayed on the Main and C tabs of the Trade Window. To open the Trade Window if it is not already open, go to the chart or Trade DOM and select Trade >> Open Trade Window for Chart. Refer to the image below.
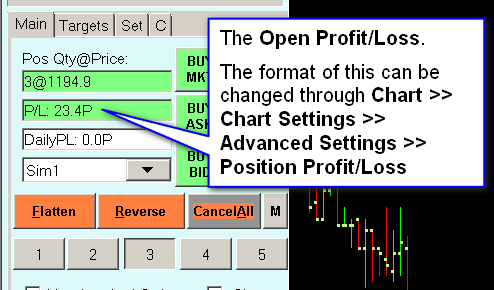
For further details, refer to Open Profit/Loss..
Daily Profit/Loss
On a Trade DOM and when a chart is in Chart Trade Mode, you will see at the top left where the Trade Mode Box is located, the Daily Profit/Loss. This value is also displayed on the Trade Window for the chart/Trade DOM. Daily Profit/Loss is abbreviated DPL.
The DPL value indicates the cumulative Profit/Loss of the closed Trades since midnight (default reset time).
The Fill to Fill Order Fill Matching Method is used when determining a closed Trade.
For information about how Daily Profit/Loss is calculated, refer to Help with Daily Profit/Loss. It can also optionally include commissions. For more information about commissions, refer to .
This DPL value is considered a Daily Trade Statistic which resets daily. For complete details, refer to Understanding Daily Trade Statistics Reset Time.
When Sierra Chart is in Trade Simulation Mode (Trade >> Trade Simulation Mode On is checked), this is the Daily Profit/Loss for simulated trades. Otherwise, the DPL is for non-simulated trades.
You are able to hide the DPL display from the chart. To do this, select Global Settings >> Chart Trade Settings and disable Display Daily Profit/Loss On Chart / Trade DOM.
There are various Profit/Loss formats that can be used and these are set by selecting Chart >> Chart Settings >> Trading. The Profit/Loss Format setting controls the format. For complete documentation for this setting, refer to Profit/Loss Format on the Chart Settings page.
The Daily Profit/Loss can also be displayed anywhere on the chart by using the Trading: Profit/Loss Text study. Add this study to the chart through Analysis >> Studies and set the study Input settings as required.
The DPL (Daily Profit/Loss) value is directly calculated from the order fills data in the Trade >> Trade Activity Log.
If there are inaccuracies with the Daily Profit/Loss value, then there can be several causes. There could be missing order fills or the starting Date-Time of the first fill loaded in the chart is not aligned with the start of a new Trade Position. For complete details, refer to Help With Daily Profit/Loss Value.
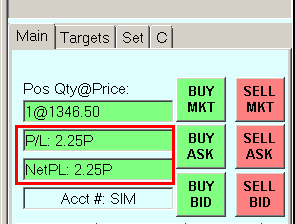
Net Profit/Loss
The Open Position Profit/Loss and the Daily Profit/Loss can be added together and displayed as one. When they are added and combined into one, this is known as the Net Profit/Loss.
This Net Profit/Loss can be displayed in place of the Daily Profit/Loss (DPL) on the chart or Trade DOM and on the Trade Window for the chart or Trade DOM.
To enable the Net Profit/Loss , select Trade >> Chart Trade Settings and enable Include Open P/L in Chart/Trade DOM P/L Display.
When the Open Position Profit/Loss is added to the Daily Profit/Loss to calculate the Net Profit/Loss, then the Open Position Profit/Loss value that is used is calculated from the order fills in the Trade >> Trade Activity Log. Those order fills are iterated through to determine what the Open Position Quantity and Position Average Price is. Using this order fill calculated Position Average Price, the Open Position Profit/Loss is calculated as explained in the Open Profit/Loss section.
The Open Profit/Loss you see on the Trade window is not directly used because that can have different calculation methods rather than a standard First In First Out matching method.
If there are inaccurate or incomplete fills, then this will affect the Net Profit/Loss calculation and make it incorrect. For complete details about how the calculations work, refer to Net Profit/Loss Calculation.
If the Net Profit/Loss is incorrect, then refer to Help with Daily Profit/Loss.
Closed Profit/Loss
It is supported to display the Cumulative Closed Profit/Loss value, which indicates the cumulative profit/loss from all of the trades made that Sierra Chart has order fill data for in the Trade >> Trade Activity Log , by using the Trading: Profit/Loss Text study.
When Chart >> Chart Settings >> Trading >> Order Fills Start Date-Time has the Date box set, then order fills are only loaded into the chart from the specified Date-Time. Therefore, the Cumulative Closed Profit/Loss will be based upon those order fills which are loaded into the chart from that Date-Time.
Add the Trading: Profit/Loss Text study to the chart through Analysis >> Studies and set the study Input settings as required.
For complete detailed information about the Trading: Profit/Loss Text study, refer to the documentation for the Trading: Profit/Loss Text study.
Viewing Closed Profit Loss through the Trade Activity Log
You are able to view the Cumulative Closed Profit/Loss for any period of time through the Trades tab of the Trade >> Trade Activity Log. Refer to the Trades tab documentation. On the Trades tab you will want to refer to Cumulative Profit/Loss column.
Centrally Viewing Daily and Cumulative Closed Profit/Loss
To view in one location all of the Open Profit/Loss, Daily Profit/Loss, Cumulative Closed Profit/Loss values and other trading related statistics for all of the charts and Trade DOM windows that are currently open in Sierra Chart, select Trade >> Trade Activity Log >> Trade Stats for Charts from the menu.
On the Trade Stats for Charts tab, you will a row for each chart or Trade DOM that is maintaining a Trades list from the order fills in the Trade Activity Log.
Trade DOMs and charts that are in Chart Trade Mode or require the order fill Trades list for other reasons, do maintain an internal Trades list from the order fills.
For complete details, refer to Trade Stats for Charts Tab.
Trade DOM
Sierra Chart offers a traditional Trade DOM window. To open a Trade DOM, select File >> Find Symbol on the menu. Select a symbol from the lists or type in a symbol in the Selected Symbol box, and press the Open Trading DOM button.
Alternatively, you can select File >> Open Trading DOM for Chart on the menu. In this case a Trade DOM will be opened for the active chart quickly.
You can open as many Trading DOMs as you require. They will be part of the active Chartbook.
The Trade DOM window is based upon the Sierra Chart chart object and is streamlined and optimized for trading purposes. Therefore, the trading functionality is exactly the same as what you have in a regular chart when using chart trading and the Chart DOM, except there is no chart, studies or chart drawings. The price scaling on a Trade DOM window is specifically optimized for trading purposes.
By default the price ladder is set so that every price tick is displayed. You can also set it this way at any time by right clicking on the column of numbers and selecting Auto Scale the Chart DOM.
The Interactive Scaling features are supported on the price scale (price ladder). This allows you to move the prices up and down, or compress or expand the prices. For a video presentation, refer to Scaling The Chart DOM.
Entering Orders on the Trade DOM
To enter orders on the Trade DOM, refer to the Using the Chart DOM / Order Entry Ladder section on this page. The order entry method is 100% identical to the Chart DOM on a chart.
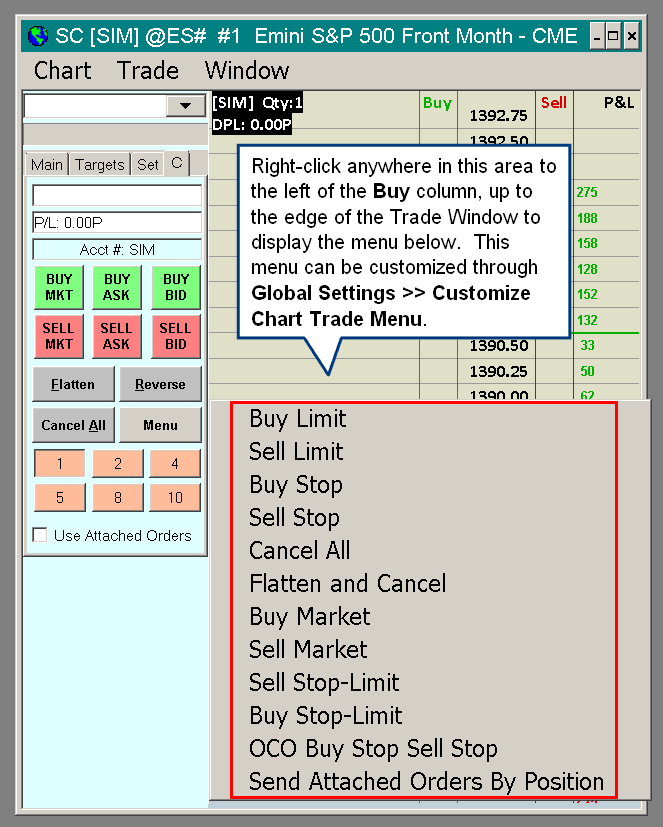
A Trade DOM window also supports submitting orders using the same menu-based order entry method that is supported with Chart Trading. You would want to use this method to submit OCO type orders and any other order type that you cannot submit through the standard Buy/Sell columns, like a Trailing Stop order. To display the Chart Trade menu, you need to right-click on the Trade DOM in the area where the orders are displayed.
Modifying or Canceling Orders
To Modify or Cancel orders on the Trade DOM, refer to the Modifying and Canceling Orders on the Chart section on this page. The method is the same.
Setting Update Interval
The update interval of a Trading DOM can be set. For example, it can be reduced in order to increase the speed of updating. To adjust this, it is best to adjust this individually for each Trading DOM rather than globally. This setting is controlled through the Chart Update Interval setting.
Displaying Market Depth Data
Market Depth can be optionally displayed on the Trade DOM. Market Depth indicates the volume/quantity of orders at each price level for the prices nearest the current price. For full details about market depth data, refer to Open Market Depth Window.
To add the Market Depth data columns to the Trade DOM, if not already displayed, refer to the Customizing Trade DOM and Chart DOM Columns section.
Customizing Trade DOM and Chart DOM Columns
All of the columns on the Trade DOM and the Chart DOM can be customized. To display the Trade DOM or Chart DOM if it is not already enabled, go to the Trade DOM or Chart you want it enabled on and make sure there is a checkmark by Trade >> Trading Chart DOM On on the menu.
What specific columns are displayed, the alignment of text within those columns and the order of columns is all customizable.
These columns include Buy and Sell columns, Bid and Ask size/quantity data columns and various other market data columns.
To customize the columns for the active Chart or Trade DOM, select Trade >> Customize Chart/Trade DOM Columns. Since version 1516, the column customization applies to the active Chart or Trade DOM. They are no longer global. They need to be set individually for each Chart and Trade DOM as needed.
To add the Bid Size/Quantity and Ask Size/Quantity market depth data into the same columns as the Buy and Sell order columns respectively, use the following two Chart/Trade DOM columns:
- Bid Size/Buy Column
- Ask Size/Sell Column
Or add the Combined Bid/Ask Size column.
For a complete description of each of the columns, refer to Chart/Trade DOM Column Descriptions.
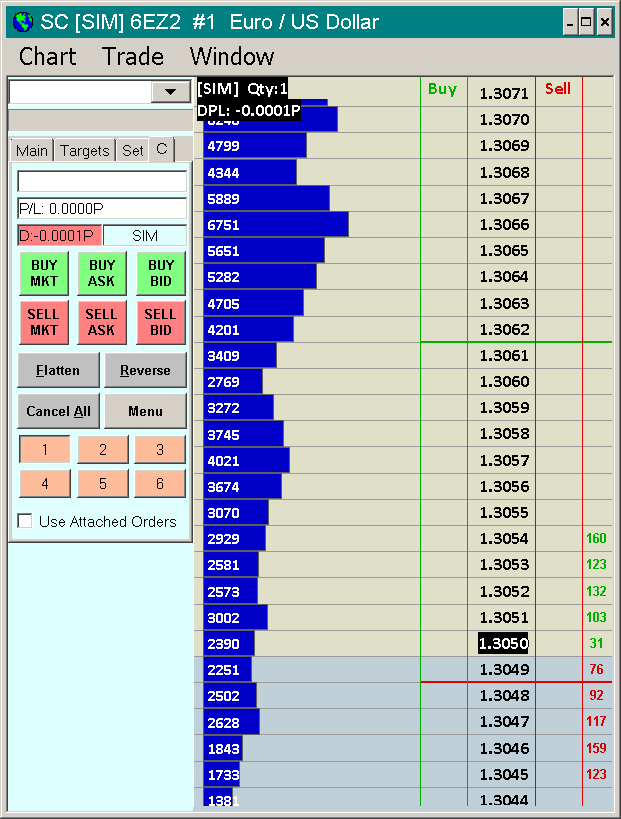
For the Bid Size and Ask Size columns, there will not be more than one size/quantity row for the Bid and Ask sides, unless market depth data is provided for the symbol from the particular Data or Trading service being used.
When using the symbols from the Sierra Chart Real-time and Historical Forex/CFD Data Service, there is only one level of market depth data with quantities of 1. In the case of CME futures market symbols, it is necessary that your market data has activated on it the CME exchanges that provide market depth data, in order to see more than one level of market depth data. The CME does charge extra for market depth data, so your account may not have market depth data on it.
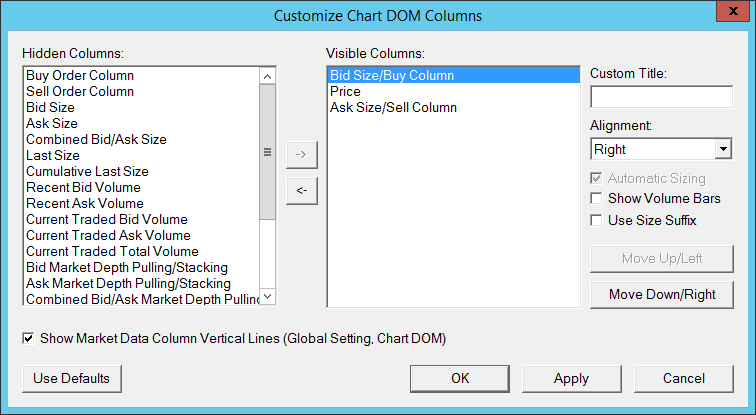
Use the -> and <- to add and remove columns. Use the Move Up and Move Down buttons to adjust the order of the columns. See Chart/Trade DOM Column Widths and Headers for additional information on changing column positions and headings.
Press the OK button to save the changes.
To control the number of market depth levels displayed on the Chart DOM use the setting Chart >> Chart Settings >> Market Depth >> Maximum Market Depth Levels.
Bid and Ask Size/Quantity Columns
The following Bid Size/Quantity or Ask Size/Quantity columns can be added. These including combining the Bid Size in the Buy column and the Ask Size in the Sell column.
- Combined Bid/Ask Size
- Bid Size
- Ask Size
- Bid Size/Buy Column
- Ask Size/Sell Column
For the Bid Size and Ask Size columns, the number of levels displayed is controlled by the Chart >> Chart Settings >> Market Depth >> Maximum Market Depth Levels setting.
Trade DOM and Chart DOM Font and Colors
To control the font size of the market depth quantities/sizes on the Chart/Trade DOM columns, set the DOM Quantities/Sizes Font setting in the Graphics Settings window.
To control the colors, refer to Customizing Fonts, Colors, Line Styles, and Widths for Chart Trading, Chart DOM, and Trade DOM.
Using Compact Working Order Lines
The working order lines lines on a Trade DOM can be set to display less detail so they are more compact and take less horizontal width. This allows you to resize the Trade DOM window and reduce its overall width and still be able to see the order lines. To reduce the amount of detail on order lines, uncheck the following option Global Settings >>Chart Trade Settings >> Working Orders >> Display Detailed Order Information.
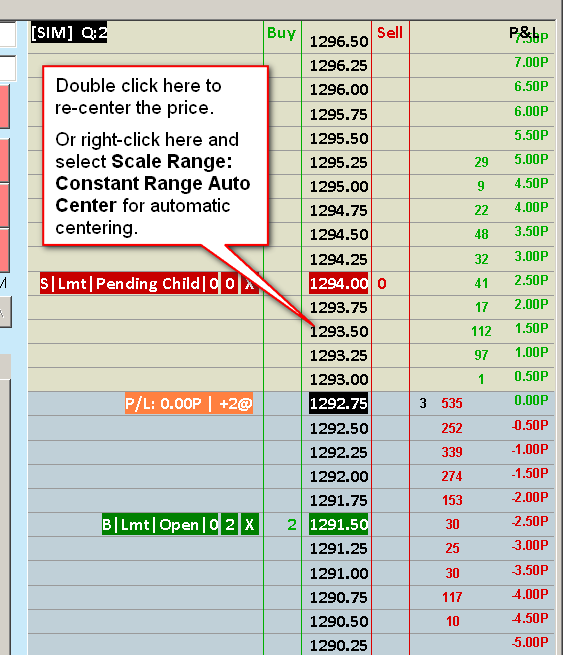
Re-Centering the Current Price
By default, the price ladder does not automatically re-center. The current price will always remain in view, however as it approaches the upper or lower bound of the window, you will need to drag it towards the center to keep it into the center. You can automatically center the price by double-clicking the price ladder as shown in the image.
Or you can right-click on the price ladder and select Scale Range: Constant Range AutoCenter. To open the complete set of Scale settings, right-click on the price ladder and select Scale .
Detaching Trade Window
The Trade Window for a Trade DOM or chart can be detached, so as to take less space. To do this, press the Menu / M button on the Trade Window and select Attach Trade Window to Chart Window to remove the checkmark. Refer to the image below.
Attaching Trade Window to Right Side
The Trade Window for a Trade DOM or chart is used for basic order entry and it contains Attached Order configurations and other settings.
The Trade Window can be attached to either the left or the right side of the Trade DOM. To do this, refer to the Attaching Trade Window to Charts section.
Left Aligning Order and Position Lines
By default in a Trade DOM window, Order and Position lines are aligned to the right, beside the order entry column and price ladder. This can be changed by selecting Chart >> Chart Settings >> Trading and unchecking the following options: Align Trade Drawings Text to Right and Align Order Cancel(X) Button to Right.
The benefit of left alignment will only be noticeable when you are using a wider Trade DOM window. Left alignment may be useful if you have applied the Volume by Price study to the Trade DOM.
Saving Trade DOM Configuration
The Trade DOM window is a chart object like an ordinary chart, but it is specialized for the purpose of trading. It is contained within a chartbook like other charts. Therefore to save a Trade DOM you need to save the active chartbook by selecting File >> Save. This will save it as part of the active chartbook. For complete information, refer to Chartbooks.
Always on Top
To make the Trade DOM always display on top of other windows on your system desktop, select Window >> Always on Top directly on the Trade DOM menu.
Daily Volume Profile (Volume by Price) on Trade DOM
The Sierra Chart Trade DOM supports the Volume by Price study, so that you can have a view of the volume at each price level on the Trade DOM. To use the Volume by Price study, follow the steps below.
- For the greatest Volume at Price accuracy, you need to set Sierra Chart to a tick by tick data configuration. Refer to Tick By Tick Data Configuration. This step only needs to be done once.
- Go to your Trade DOM window.
- Select Chart >> Studies on the menu.
- In the Studies Available list, locate the Volume by Price study.
- Press the Add button.
- Press the Settings button.
- Select the Inputs and Settings tab if it is not already selected.
- Set the following inputs:
- Ticks per Volume Bar to 1.
- Volume Graph Period Type to From Session Start Time to End.
- Maximum Volume Bar Width Type to Window Width.
- Display Volume in Bars to Total Volume.
- To align the Volume Bars to the right side beside the trading columns on the right side of the Trade DOM, set the Right Align Volume Bars input to Yes.
- Set any other Study inputs as you require.
- Press OK. Press OK.
- Select Chart >> Chart Settings >> Session Times. Set the Intraday Chart Session Times >> Session Start Time and End Time to what you require or according to the exchange session times. Keep in mind these are relative to the Global Settings >> Data/Trade Service Settings >> Time Zone setting you have in Sierra Chart.
Adding Studies on a Trade DOM
Follow the instructions below to add studies to a Trade DOM.
As an alternative to adding studies to a Trade DOM, you can consider using a normal chart which easily supports studies and use the Chart DOM feature to trade from the chart.
Sierra Chart support does not provide any help for using studies on a Trade DOM. The problem is you have no idea what data the study is based upon and therefore how it is functioning without seeing the chart bars.
- Select Chart >> Studies from the Trade DOM menu.
- A smaller set of studies is available from the list. Add the studies that you require following the instructions in the Adding/Modifying Chart Studies documentation.
- To add chart studies to the Trade DOM which are not listed and also custom studies, press the Add Custom Study button on the Chart Studies window. Select the study from the available studies and press the Add button. Therefore, any study can be added to a Trading DOM.
- It is possible to use the Study/Price Overlay study to reference studies from other charts and add them to a Trade DOM. When using the Study/Price Overlay Study, it is necessary to set the Fill Blanks with Last Value input to Yes. And it is necessary to set the Chart Region for the Study/Price Overlay study to 1.
- Since you have now placed studies on the Trade DOM, it becomes necessary to adjust the Chart Settings for the underlying chart bar data. To do this, modify the settings through the Chart >> Chart Settings>> Bar Period window. For example, you will need to adjust the chart bar time period. For additional information, refer to Chart Settings.
Adding Custom Text to a Trade DOM
To add text on a Trade DOM at a particular price level, follow the instructions below.
- Add the Line study to the Trade DOM by following the instructions in the Adding/Modifying Studies section. On the Trade DOM this is added through Chart >> Studies.
- Open the Study Settings window for the Line study.
- On the Settings and Inputs tab, set the Value Input to the price level where you want to place the text.
- Set the Chart Region setting to 1.
- Select the Subgraphs tab.
- In the Short Name edit box for the Subgraph, enter the custom text that you want.
- Enable the Name Label option.
- Set the Horizontal Align setting for the Name Label as required.
- Press OK to close the Study Settings window.
- Press OK.
Blank Trading DOM
If there is a case where a Trading DOM is blank, then make sure the symbol is valid in Chart >> Chart Settings >> Symbol >> Symbol for the Trading DOM.
An easy way to update futures contracts symbols being used if they are for a different supported Data/Trading as compared to the current selected service, is to select Edit >> Translate Symbols to Current Service when the Chartbook is open.
In Chart >> Chart Settings >> Session Times, make sure the Intraday Chart Session Times >> Session Start Time and Session End Time cover the full 24 hour range. For example, set them to 00:00:00 and 23:59:59 respectively.
Make sure Sierra Chart is connected to the data feed by selecting File >> Connect to Data Feed. If this command is disabled, it means Sierra Chart is already connected.
Reset the Chart/Trade DOM scale. Refer to Auto Scale the Chart DOM.
Improving Performance of Trading DOM
Using the Chart DOM / Order Entry Ladder
This section documents how to use the Chart DOM and Trade DOM trading interfaces. Whether you are using the Chart DOM or Trade DOM, they have the same interface. The Chart DOM / Trade DOM is for entering trade orders (Simulated or Live) in the same way as a traditional trading DOM. This is also known as an Order Entry Ladder. The image below is a basic overview of what you can do.
- Trade >> Trading Chart DOM On on the menu needs to be checked to enable the Chart DOM order entry interface.
When you enable Trading Chart DOM On, the Chart Trade Mode On and Show Orders and Position options will also be enabled automatically. When Trading Chart DOM On is enabled, this well display the Buy and Sell order entry columns on the right side of the chart which are used for trade order entry. Refer to the image above.
In the case of the Trade DOM, Trading Chart DOM On is enabled and stays on. - To display the Depth of Market sizes/quantities on the Chart DOM / Trade DOM, you will need to add the Bid Size and Ask Size columns if they are not already added. To add these columns, select Trade >> Customize Chart/Trade DOM Columns.
Add those columns through the Customize Chart/Trade DOM Columns window. It is also supported to display the Depth of Market sizes/quantities within the Chart DOM Buy and Sell columns directly, by adding the Bid Size/Buy Column and the Ask Size/Sell Column DOM columns.
If the Depth of Market sizes/quantities overlap on the Chart DOM, then you will want to consider using the DOM Graph as an alternative. - When using the Chart DOM you may want to change the scale of the chart. For instructions to do this, refer to Scaling the Chart DOM section.
- When using the Chart DOM, new orders entered use the Quantity, Time in Force, and Attached Orders settings from the associated Trade Window for the chart. Select Trade >> Open Trade Window for Chart to open the Trade Window for the chart. For complete details, refer to Opening Trade Window.
Any Attached Orders that are defined and enabled on the Trade Window Targets tab, will be used. The Attached Orders need to be enabled by checking Use Attached Orders on the Trade Window. For more information about Attached Orders, refer to the Attached Orders page. If you do not want to use Attached Orders uncheck Use Attached Orders on the Trade Window. - The Chart Trade Mode box at the top left of the chart / Trade DOM displays the quantity for new orders and the price your mouse pointer is pointing to, on the chart and Chart DOM. To change the Order Quantity for a new order, simply click on the Chart Trade Mode box, type in the desired Order Quantity, or use the + and - buttons, and press OK to accept. Refer to instructional image.
- Orders are entered through the Chart DOM with left and right clicks of your Pointer buttons, in the Buy and Sell columns on the right side of the chart or Trade DOM window (refer to instructional image).
The Order Type and whether the order is a Buy or Sell is determined by the settings in Global Settings >> Chart DOM Settings on the menu. Refer to the images below.
For more information for the Chart DOM Settings window, refer to the Chart DOM Settings documentation. The Order Type setting on the Trade Window for the chart is ignored when using the Chart DOM / Trade DOM.
The default order types are Limit and Stop orders.
When using Stop-Limit orders instead of Stop orders, the Limit price is automatically set and will be the number of ticks away from the Stop price as specified on the Set tab on the Trade Window for the chart ( Trade >> Open Trade Window for Chart >> Set) in the Stop-Limit Order Limit Offset >> Primary Orders box.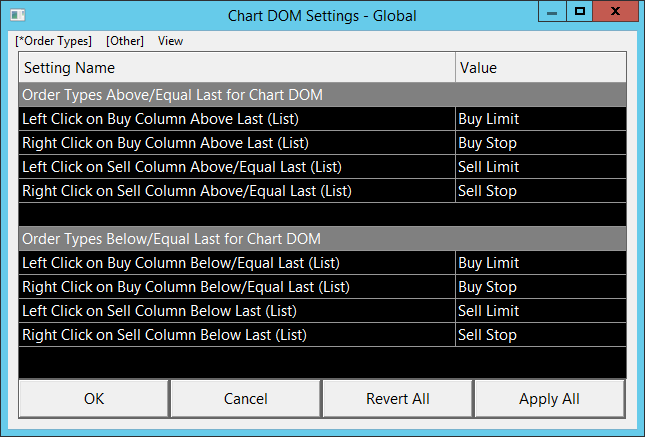
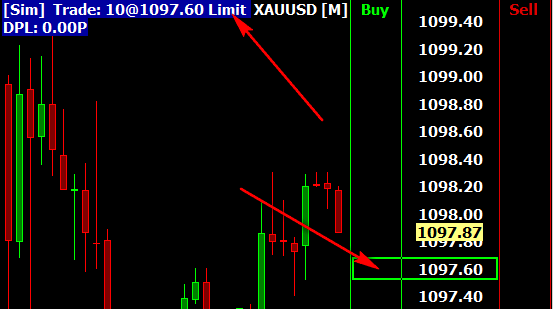
The following list describes the default actions of the Chart DOM / Trade DOM:- To enter a Buy Limit: Left click on the Buy column at the level of the limit price that you want.
Initially you will get a confirmation, press Yes to confirm. The confirmation can be disabled on the Trade Window by selecting Trade >> Open Trade Window for Chart >> Menu (M) >> Confirmations >> Confirm New Orders. The new order will be displayed on the chart. - To enter a Buy Stop: Right click on the Buy column at the level of the stop price that you want.
Initially you will get a confirmation, press Yes to confirm. The confirmation can be disabled on the Trade Window by selecting Trade >> Open Trade Window for Chart >> Menu (M) >> Confirmations >> Confirm New Orders. The new order will be displayed on the chart.
If you have enabled Menu (M) >> Orders >> Use Stop-Limit Orders on Chart DOM on the Trade Window, then Stop-Limit orders will be submitted instead. - To enter a Sell Limit: Left click on the Sell column at the level of the limit price that you want.
Initially you will get a confirmation, press Yes to confirm. The confirmation can be disabled on the Trade Window by selecting Trade >> Open Trade Window for Chart >> Menu (M) >> Confirmations >> Confirm New Orders. The new order will be displayed on the chart. - To enter a Sell Stop: Right click on the Sell column at the level of the stop price that you want.
Initially you will get a confirmation, press Yes to confirm. The confirmation can be disabled on the Trade Window by selecting Trade >> Open Trade Window for Chart >> Menu (M) >> Confirmations >> Confirm New Orders. The new order will be displayed on the chart.
If you have enabled Menu (M) >> Orders >> Use Stop-Limit Orders on Chart DOM on the Trade Window, then Stop-Limit orders will be submitted instead.
- To enter a Buy Limit: Left click on the Buy column at the level of the limit price that you want.
- The price levels in the Buy and Sell columns on the Chart DOM will display the quantity of the respective Open Buy and Sell orders at that price level, or the market depth sizes/quantities depending upon the Chart DOM column configuration in Trade >> Customize Chart/Trade DOM Columns. Your working order quantities will be displayed if the columns are not also used to display the market depth Bid size and Ask size data.
Scaling the Chart DOM
The most rapid way to automatically scale the Chart DOM is by right clicking along the column of values displayed on the right side of the chart or Trade DOM and select Auto Scale the Chart DOM. This will set the Scale Range to the Constant Range type without auto-centering and set the scale increment to the Tick Size.
If you wish to make further adjustments, these are explained in the next paragraphs.
If the Chart DOM prices or depth of market volumes, are too close together or too far apart, then you have the ability to compress or expand the chart scaling by using the Interactive Scale Range feature. Basically this is accomplished by right clicking over the scale numbers on the right side of the chart and making sure Interactive Scale Range is selected and then dragging along the column of numbers on the right side of the chart to expand or compress the scale.
If the Chart DOM prices and depth of market volumes are not fully into view as you require, then you have the ability to move the chart up and down by using the Interactive Scale Move feature.
After adjusting the scaling for the Chart DOM, you may find that the chart bars are not fully into view. In this case you may want to use a Trade DOM.
To keep the last trade price always centered on the Chart DOM or Trade DOM right-click on the Values Scale column on the right side of the chart, and select Scale Range: Constant Range Auto Center.
For a short video presentation on Chart DOM scaling, refer to Scaling The Chart DOM.
Setting Chart DOM Order Column Width
See section Chart/Trade DOM Column Widths and Headers for information on changing the Chart DOM Column Widths.
Displaying Order Type in Trade Mode Box
When using the Chart DOM / Order Entry Ladder either on a chart or on a Trade DOM, it is supported to display the order type that will be submitted, either a Limit or Stop type, when left clicking at a price level in one of the Buy/Sell order entry columns.
To enable this feature, select Global Settings >> Chart Trade Settings formatting and enable the Show Limit/Stop in Trade Mode Box option.
Refer to the image below for an example of this.
Double Click Operations in Order Entry Columns
When left clicking rapidly in the Buy or Sell order entry columns on the Chart DOM, 2 left clicks will be interpreted by your operating system as a double-click in most cases resulting only in a single order entry in this case.
You are able to change the double-click delay through the operating system control panel but this will affect the entire system.
If you want to enter two orders rapidly, the proper procedure is that you need to double the Order Quantity on the Trade Window and then just enter a single order.
Practicing with Chart DOM
There are two good ways to practice with the Chart DOM.
The first method is to use the Simulated Trading Service which uses the Delayed Exchange Data Feed if you are not subscribing to and entitled to receive Real-time data.
Another method is to use the Sierra Chart Historical Data Service for Intraday chart data and then replay those charts.
Having Horizontal Line Across Chart at Highlighted Level on Chart
When using the Chart DOM and highlighting the price levels in the Buy and Sell columns on the right side of the chart with your Pointer, you may want to have a horizontal line across the chart at the same time indicating the price level.
This can be accomplished simply by using and activating the Chart Values Tool while using the Chart DOM.
The Chart Values Tool also supports the Global Cursor mode where it will be active on all charts at the same time.
Improving Performance Of Chart / Trade DOM
If you are looking for very fast updates on the Chart DOM or Trade DOM, follow the instructions below.
- Update to Sierra Chart version 2353 or higher. Refer to Fast Update. This is absolutely essential to be running this version or higher. There have been significant performance improvements with the Chart/Trade DOM market data columns.
- Use the Denali Exchange Data Feed for the exchanges you require data for. For full documentation and instructions, refer to Denali Exchange Data Feed. This is very important to be able to control the update speed. We will not provide any help if you are using another data feed. This data feed is also very efficiently processed on a background thread using binary encoded data. This is a huge performance improvement compared to other external data feeds.
- Reduce the number of charts or Trading DOMs in total to no more than 4 for the particular Sierra Chart instance being used. Other charts and complex charts need to be moved to sub instances. This is absolutely essential. It is simply not possible to have too many charts within an instance of Sierra Chart and expect very fast updates within charts or Trading DOMs. Depending upon what your expectations are, you may only want to have 2 Trading DOMs or charts in total within a single instance.
Additionally the charts that you have open in an instance using a Chart DOM or Trade DOM must be very simple and contain no studies or just one or two very basic studies. The reason we say this, is some users are expecting extremely fast updates. And we have to give you all of the information to achieve this. We do not know what your expectations are. If you are looking for extremely fast updates do not use any charts within an instance where you have a Trade DOM.
Alternatively to the above, you can use a larger number of charts per installation/instance of Sierra Chart, however use a higher Chart Update Interval for them. In this way you can have a larger number of charts in a single instance beyond what we are recommending above. The Chart Update Interval you may want to use could be 1000 or 2000 ms. Or higher. - When using the Recent Bid/Ask Volume or Current Traded Bid/Ask/Total Volume market data columns on a Chart/Trade DOM over time the number of price levels that data exists for these increases.
This potentially may be a performance issue if Sierra Chart has been running for many days, or if there has been a lot of market volatility.
To reset the size of these containers back to zero, to improve performance, if these containers have become too large, use the commands Trade >> Clear Recent Bid/Ask Volume - All Symbols and Trade >> Clear Current Traded Bid/Ask Volume - All Symbols. - Adjust the Chart Update Interval setting for the chart or Trade DOM to between 40 to 100.
- Adjust the Remote Buffer Delay Send Time In Milliseconds setting in Global Settings >> Sierra Chart Server Settings to between 30 to 100. Reconnect the data feed after changing this setting.
It is very important to be aware that the lower this setting is set to, the increased chance of packet loss which has the effect of significantly increasing of the time delay receiving data. This happens because of packet retransmission. Using too low of a value can also cause the data feed to stop due to packet loss. - Adjust the Max Depth Levels setting in Global Settings >> Sierra Chart Server Settings to the number of market depth levels that you require. It is important to reduce this to the minimum possible. Reconnect the data feed after changing this setting. This setting does not work with any data feed other than Sierra Chart provided data feeds.
- Mandatory: Run Sierra Chart in Safe Mode to remove the potential detrimental impact of custom studies.
- Mandatory: Install Sierra Chart on its own dedicated Solid State Drive.
- Disable the Trade Activity Log by enabling Trade >> Trade Activity Log >> Edit >> Disable Trade Activity Log. Also refer to Trade Activity Log Performance.
- New: Also refer to 30.55 - System Power Management and Process Priority.
Customizing Fonts, Colors, Line Styles, and Widths for Chart Trading, Chart DOM, and Trade DOM
The section has been moved to the Customizing Fonts, Colors, Line Styles, and Widths for Chart Trading, Chart DOM, and Trade DOM page.
Displaying Order Fills on the Chart
When a Trade Order fills, the order fills can be displayed on the corresponding chart at the Date-Time of the order fill.
A single order can have multiple fills. Each fill will be displayed separately. Also an exit order fill could be split into smaller quantities, in order to match with the quantity of an entry fill.
There are various formatting options for the order fills.
To display order fills, follow these instructions:
- Enable Trade >> Show Order Fills on the menu. To prevent the displaying of order fills on the chart, disable Trade >> Show Order Fills. This option is specific to each individual chart. This command applies to the active chart.
- When the Trade >> Only Orders from Chart option is checked, then only order fills that are for orders which originated from the chart will be displayed on the chart. So check or uncheck that as you require. This option is specific to each individual chart. This option applies to the active chart.
- To display non-simulated order fills, for orders that have been submitted to the connected Trading service, make sure there is no checkmark by Trade >> Trade Simulation Mode On.
- To display simulated order fills, for orders that have been submitted when in Trade Simulation Mode, there needs to be a checkmark by Trade >> Trade Simulation Mode On. Therefore, enable this menu option if you want to see order fills which are for orders submitted in Trade Simulation Mode.
- It is necessary to select the correct Trade Account that the orders are from, on the Trade Window, to see the order fills from that particular account. To do this, open the Trade Window if it is not already open, by selecting Trade >> Open Trade Window for Chart.
On the Trade Window, in the list of Trade Accounts, select the particular Trade Account the orders are from to see order fills for those orders. For instructions and an image, refer to Selecting Trade Account. - The chart will only display order fills for orders which match the Symbol of the chart. However, if the Trade and Current Quote Symbol is set for the chart, then only those order fills matching the Trade and Current Quote Symbol will be displayed on the chart.
And as explained above, only the fills that match the Trade Account of the chart will be displayed. So the fill has to match both the Symbol and Trade Account of the chart. - To see the order fills on a chart, there needs to be order fills present for the Symbol and Trade Account of the chart, in the Trade >> Trade Activity Log >> Trade Activity tab.
To see what order fills are available in the Trade Activity Log, make sure you select Fills at the top of the Trade Activity Log window. For complete instructions, refer to the Trade Activity Log documentation. - The setting Chart >> Chart Settings >> Trading >> Order Fills Start Date-Time will set the chart to load only the order fills from the specified Date-Time. We recommend setting this date-time. However, refer to Accurate Entry/Exit State, Fill Matching and Position Quantities.
- The setting Chart >> Chart Settings >> Trading >> Load Order Fills for Current Day Only will load order fills for the current day only based on the Chart Session Times. Uncheck this if you want to see order fills for more than the current day.
However, this will also affect the Daily Profit/Loss calculation causing it to potentially be inaccurate and will affect the Position Quantity for simulated trading.
We recommend disabling this option as it also overrides the Order Fills Start Date-Time setting. - The above two described settings must be set correctly because they affect the order fill markers on the chart and whether they are an Entry or Exit. It also affects the displayed Position Quantity with order fills. For complete details, refer to Accurate Entry/Exit State, Fill Matching and Position Quantities.
- To change the settings that affect the display of order fills, select Global Settings >> Chart Trade Settings on the menu.
The settings are in the Order Fills frame.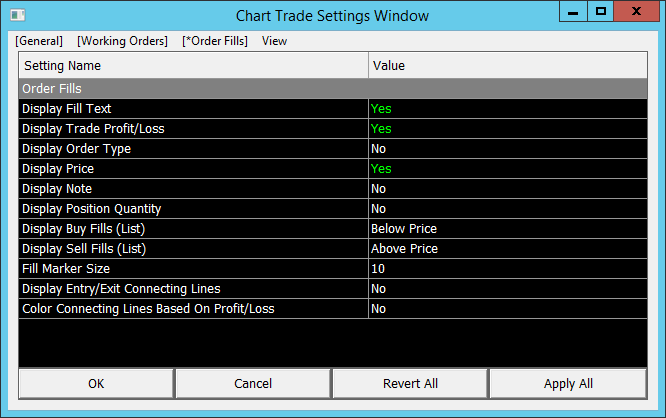
- To change the colors of order fills, and the colors, width and line style of connecting lines, refer to the Customizing Fonts, Colors, Line Styles, and Widths for Chart Trading, Chart DOM, and Trade DOM page. The relevant color settings begin with Chart Trading Order Fills.
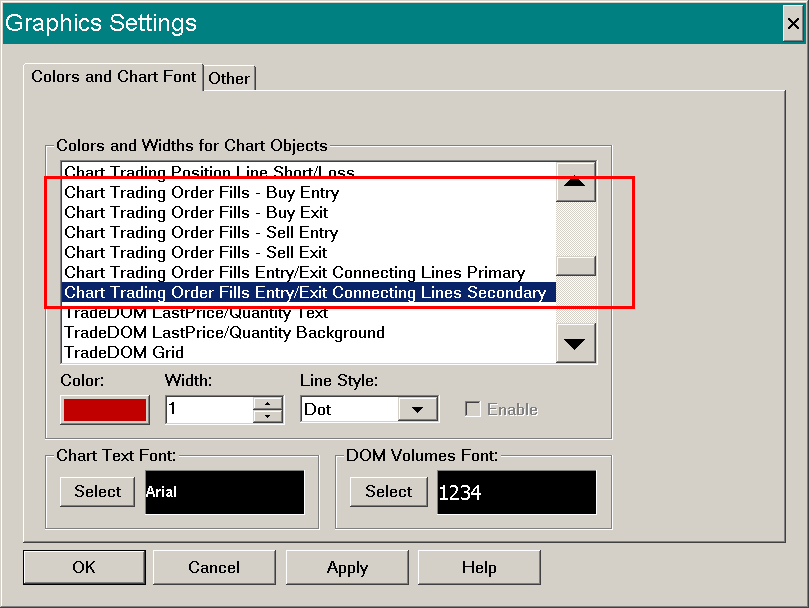
The text color of order fill drawings is set with the Chart Trading Order Line Text Color color setting. - The font, font size, and other font appearance settings, for order fills is controlled through the Chart Order Fills font in the Graphics Settings >> Font tab of the Graphics Settings window.
Chart Order Fills Do Not Display
If after following the Displaying Order Fills on the Chart instructions and the order fills are still not displayed on the chart, then follow the below instructions.
- There can be a delay with the display of order fills due to the time it takes to make a Trade Activity query for the order fill data. Refer to Delay with Displaying Order Fills / No Fills Displayed.
- Disable the Load Order Fills for Current Day Only option in Chart >> Chart Settings >> Trading.
- Disable the Filter Initial Fills Which are Part of Existing Position option in Chart >> Chart Settings >> Trading.
- Set the Order Fills Start Date-Time setting in Chart >> Chart Settings >> Trading to where you want to start loading Order Fills from.
- If you have set the Trade and Current Quote Symbol setting for the chart, then the order fills will be loaded for this Trade symbol and not the main symbol of the chart.
It is possible that this symbol uses a different Price Multiplier as compared to the main symbol of the chart. If it does use a different Price Multiplier, then it is necessary to set its own multiplier through the Trade and Current Quote Symbol Price Multiplier setting.
Accurate Entry/Exit State, Fill Matching and Position Quantities
This section relates to order fills displayed on the chart. For more information, refer to Displaying Order Fills on the Chart.
It is essential to understand that the very first order fill which is loaded into a chart is always considered an opening fill and establishes the reported Position starting from a Quantity of 0, and the subsequent order fills are considered opening or closing fills based on their Side and the existing Position Quantity.
So if the first fill loaded in the chart is a Buy order fill with a quantity of 2, then that fill establishes a Position of quantity 2, completely irrespective of what the actual Position Quantity was just after that fill executed.
This is very important because it affects the order fill markers on the chart and whether they are an Entry or Exit. It also affects the displayed Position Quantity with order fills.
For information how order fills are matched and how the Position Quantity is determined, refer to Trade Statistics Open Quantity Field Calculation.
There are three settings for controlling the starting Date-Time of order fills loaded into the chart which is necessary to control the first order fill. The first fill needs to be the opening fill of the start of a new Trade Position. These settings are in Chart >> Chart Settings >> Trading. They are Order Fills Start Date-Time, Load Order Fills for Current Day Only, and Filter Initial Fills Which Are Part of Existing Position.
The Position Quantity reported with the displayed order fill is the calculated Position Quantity based upon the first loaded order fill in the chart and does not necessarily represent the actual Position Quantity for the Symbol and Trade Account at that time. For more information, refer to Trade Statistics Open Quantity Field Calculation.
If there is even a single missing order fill since the first fill loaded in the chart, then the open/close state of an order fill will not be interpreted correctly, the Entry/Exit state of the order fill will be incorrect, and the Position Quantity displayed with the fills will be incorrect. To see what order fills are available for a particular Symbol and Trade Account, refer to Viewing Historical Trade Activity.
To retrieve missing order fills, if possible, refer to the Automatically Inserting Missing Order Fills instructions.
If there are still missing order fills which you cannot retrieve, this can be corrected by adjusting the Order Fills Start Date-Time in the Chart >> Chart Settings >> Trading to a point in time where subsequent to that point, there are no missing fills and at a point in time where the Trade Position was flat for the Symbol and Trade account of the chart.
You may have to really limit the order fills loaded into the chart by enabling Chart >> Chart Settings >> Trading >> Load Order Fills for Current Day Only. In this case, the start of the trading day is according to the Chart Session Times.
When Load Order Fills for Current Day Only is enabled, the processing of the order fills will always consider the trading as if it was flat for the Symbol and Trade Account from the start of the day.
The Use Last In First Out Chart Setting affects the connecting lines, if set to be displayed, of order fills displayed on the chart.
When using Trade Simulation Mode, the first fill loaded into a chart will always be the order fill that starts a new Trade Position. Any prior order fills which are available will automatically get filtered out. Additionally, for the supported Trading services which will give an accurate order fill display and connecting lines, refer to Consistently Accurate Daily Profit/Loss Value.
Also refer to:
- Understanding and Setting the Start Date-Time for a Trades List
- Automatically Inserting Missing Order Fills
When comparing the Trades on a chart through the displaying of the order fills, to the Trades on the Trades tab Trade Activity Log, you need to make sure the Trade Activity Log is using the same Start Date-Time for the order fills. And also make sure that the Use Last In First Out Fill Matching and Edit >> Use Last In First Out Fill Matching settings match between the Chart Settings and the Trade Activity Log.
Displaying Order Fill Arrows Only
- Select Global Settings >> Chart Trade Settings on the menu.
- Uncheck Order Fills >> Display Fill Text .
Order Fills on Continuous Futures Contract Charts
When performing trading, trading is always for a specific symbol. In the case of Continuous Futures Contract charts, there can be more than one symbol loaded into the chart for the historical data in the chart.
Order fills are only recorded for and only displayed for the current symbol of the chart set in Chart >> Chart Settings >> Symbol >> Symbol. And not the historical symbols loaded in the chart.
If you want to see order fills for a different symbol, then you need to set the chart to that specific symbol.
Misaligned Order Fill Markers on Charts
During simulated trading or non-simulated trading, the timestamp of the order fills which occur in real time are derived from your local computer clock. The necessary time zone adjustments are always made. If your computer clock is incorrectly set, then these timestamps will be off.
During a chart replay, the time stamping of order fills is according to the bar in the chart where they occurred at. There can never be a problem with the time stamping of an order fill during a chart replay. Unless there is a problem with the chart bar timestamps themselves.
If you notice that an order fill marker is not aligned to the correct Date-Time in the chart, then this could be because your computer's clock is not set accurately. In this case, refer to help topic 38.
Additionally, any order fills downloaded from the Trading server potentially could have an incorrect timestamp but this is something that we have not known to be a problem.
For existing order fills in the Trade Activity Log, it is possible to correct the timestamp of them by editing the DateTime field for them. Locate the order fill by following the instructions for Viewing Historical Trade Activity.
Select that order fill which has an incorrect timestamp and select Edit >> Edit Trade Activity Entry. Correct the Date/Time field. When editing the Date/Time field, the time zone is always according to the Global Time Zone setting. For additional details, refer to Trade Activity Menu Commands.
Resolving Problem Where Order Fill Entry/Exit Connecting Lines Do Not Display
This section explains the steps you need to follow to resolve a problem where the order fill connecting lines do not display between the entry and exit order fill markers on a chart or the colors are not as expected according to the color settings.
- Make sure the option for Entry/Exit Connecting Lines is enabled. This option is in Global Settings >> Chart Trade Settings. Enable the option Order Fills >> Display Entry/Exit Connecting Lines.
- If you do not see any order fills displayed, then obviously there are not going to be any connecting lines. Therefore, in that case you first need to follow the instructions to Display Order Fills.
- Make sure the colors of the Entry/Exit Connecting Lines are not the same as the Chart Background color and check the Line Width and Line Style for the connecting lines.
To change the colors of the connecting lines, refer to the Customizing Fonts, Colors, Line Styles, and Widths for Chart Trading, Chart DOM, and Trade DOM page.
The particular graphics objects that need to be set are Colors and Widths >> Chart Trading Order Fills Entry/Exit Connecting Lines Primary and Colors and Widths >> Chart Trading Order Fills Entry/Exit Connecting Lines Secondary.
Refer to the Customizing Fonts, Colors, Line Styles, and Widths for Chart Trading, Chart DOM, and Trade DOM documentation for an understanding about these two settings and under what conditions they are used. - Before a connecting line will be displayed between two order fills, it is necessary that there is both an Entry and an Exit order fill which have been matched.
- Order fills are matched First In First Out and according to a Date-Time ascending order.
- Select Chart >> Chart Settings >> Trading. The Order Fills Start Date-Time needs to be set to the date that you want the orders fills displayed from. Keep in mind this needs to be at a particular Date-Time where the order fills start a new position.
- Finally, if you do not understand all of the above information and information linked to and/or you are looking for more help with this, understand that Sierra Chart support does not provide any support for this problem due to the inherent complexities of this which are not within our control since in the case of live trading, there are various aspects of this that are not within Sierra Chart control.
Displaying Order Fill Text Tag or Notes
When an order is submitted from Sierra Chart it can have a short text note or tag applied to it. This is done through the Text Tag setting of the Trade Window.
When the order fills, this text tag is also set on the order fill data as well held in the Trade Activity Log. By enabling Global Settings >> Chart Trade Settings >> Order Fills >> Display Note, this text tag will be displayed with the order fill displayed on a chart.
Delay with Displaying Order Fills / No Fills Displayed
When enabling Trade >> Show Order Fills, there is a query made on a background thread for the order fills to display on the chart. Until this query completes, the order fills will not be displayed on the chart.
This query normally will be completed in less than a second but it could take longer. If there is a huge amount of trade activity which has to be processed, perhaps this could take an entire minute or longer. A long query time is a very unusual case though and in that case you should delete old or excessive Trade Activity. Refer to Clearing Trade Activity Data.
There can also be multiple outstanding trade activity queries which need to be processed. Only one can be processed at a time and they are placed in a queue. So if there are several outstanding queries that still have to be done, then doing something like enabling the display of order fills on the chart, will not result in the immediate display of the fills. The queries ahead of the query needed for those fills needs to complete and then the query for those fills needs to complete. You can see the status of the completed queries in the Trade >> Trade Service Log.
For complete information, refer to Trade Activity Not Displaying or Clearing (Improving Trade Activity Query Performance).
If you still need further help with the display of order fills, then follow through the below instructions.
- See if the order fills exist in the Trade Activity Log. If they do not exist there, then you will not see them on the chart.
- Look at the Symbol for the fill in the Trade Activity Log. For the fill to be displayed on the chart, the symbol of the fill must match exactly the Symbol of the chart. Or it must match the Trade and Current Quote Symbol for the chart if using that symbol in the chart.
- Look at the Trade Account for the fill in the Trade Activity Log. For the fill to be displayed on the chart, the Trade Account of the fill must match exactly the Trade Account of the chart.
- For further help, refer to Displaying Order Fills on the Chart.
Automatically Scrolling Chart to Order Fills
It is supported to automatically scroll the chart to the next or previous order fill. Refer to Goto Next Chart Fill and Goto Previous Chart Fill.
Displaying Orders, Position, and Order Fills on Other Charts
To display the Orders, the Trade Position and the Order Fills that have originated from a particular chart or Trade DOM, on another chart, follow these instructions:
- Go to the other chart.
- Make sure that other chart is set to the same symbol as the chart the orders originated from. This is critical.
- Enable Trade >> Show Orders and Position.
- Enable Trade >> Show Order Fills.
- Open the Trade Window for the chart by selecting Trade >> Open Trade Window for Chart.
- Select the same Trade Account on the Trade Window for the chart, as the one the orders originated from. Refer to Selecting Trade Account.
*Last modified Thursday, 04th January, 2024.