Technical Studies Reference
- Technical Studies Reference
- Multiple Chart Studies
- Common Study Inputs (Opens a new page)
- List Of Math Symbols (Opens a new page)
Technical Studies Reference
This reference contains descriptions and instructions for the studies (also known as indicators) in Sierra Chart. For more detailed information, if necessary, about the studies, refer to the many books available on technical analysis and the abundant amount of technical analysis information on the Internet.
Refer to the Chart Studies documentation page for complete instructions on applying, setting Inputs for and adjusting settings for the chart Studies described here.
The default study Input values are not necessarily the recommended or optimized values to use.
- 1 Divided by Price
- 3 10 Oscillator
- AC DC Histogram - Bill Williams Acceleration Deceleration Oscillator
- ADX
- ADXR
- Account Balance Graph - External Service
- Account Balance Text - External Service
- Accumulation Distribution
- Accumulation Distribution - Williams
- Accumulation Distribution Flow
- Adaptive Center of Gravity Oscillator
- Adaptive Cyber Cycle
- Adaptive RSI Moving Average with Smoothing
- Adaptive RVI
- Add Additional Symbol
- Advance Decline Line
- Arms Ease of Movement
- Aroon Indicator
- Aroon Oscillator
- Ask Bid Volume Difference Bars
- Ask Volume
- Ask Volume Bid Volume Difference Text
- Auto Retracement Projection
- Automatic Trendlines
- Average - Continuous
- Average Daily Range
- Average Price For Bar
- Average True Range
- Average True Range - Normalized
- Awesome Oscillator
- Balance Of Power
- Bands Envelope
- Bar Delta Below Bar
- Bar Difference
- Bar End Time
- Bar Numbering
- Bar Price Change Difference - 2 Chart
- Bar Time Duration
- Bars In Ticks
- Bars With Zeros
- Bid Ask Depth Bars
- Bid Ask Prices
- Bid Ask Volume Ratio
- Bid Volume
- Bid Volume vs Ask Volume
- Bill Williams AC
- Bill Williams Alligator
- Bill Williams Awesome Oscillator
- Bill Williams Fractal Signals
- Bill Williams MA
- Bollinger Bands
- Bollinger Bands - Bandwidth
- Bollinger Bands - Percentage
- Bollinger Squeeze
- Bollinger Squeeze 2
- Bollinger Squeeze 3
- Butterworth Filter
- CCI Predictor
- Candle Stick Pattern Finder
- Candles without Tails
- Center Of Gravity Oscillator
- Chaikin Money Flow
- Chaikin Oscillator
- Chande Forecast Oscillator
- Chande Momentum Oscillator
- Chart Bars with Zero Values
- Chart Recalculation - Periodic
- Chikou Span
- Chop Zone
- Choppiness Index
- Clear Method Swing Line
- Clock RealTime
- Color Background Based on Alert Condition
- Color Bar Based On Above Below Study
- Color Bar Based on Alert Condition
- Color Bar Based on Slope
- Color Bar HH LL
- Color Bar Open Close
- Combination Symbol Chart
- Commodity Channel Index
- Connie Brown Composite Index
- Coppock Curve
- Correlation Coefficient
- Countdown Timer
- Covariance
- Cumulative Adjusted Value
- Cumulative Daily Volume
- Cumulative Delta Bars - Trades
- Cumulative Delta Bars - Up Down Tick Volume
- Cumulative Delta Bars - Volume
- Cumulative Sum of Study
- Current Bid Ask Lines
- Current Price Line
- Custom DLL Study
- Custom Scale Control
- Cyber Cycle
- Cycle Period
- DMI ADX ADXR
- DT Oscillator
- Daily OHLC
- Daily OHLC - Single Point
- Daily Range Bands
- Date-Time Line
- DeMarker Oscillator Type I
- DeMarker Oscillator Type II
- Demand Index
- Demarker
- Depth Of Market Data
- Detrended Oscillator
- Detrended Oscillator - DiNapoli
- Difference - Bar
- Difference - Bid and Ask Prices
- Difference - Single Line
- Directional Movement Index
- Directional Movement Oscillator
- Dispersion
- Divergence Detector
- Donchian Channel
- Double Stochastic
- Double Stochastic - Bressert
- DownTick Volume
- Elder Impulse
- Elder Ray
- Ergodic
- Even Better Sinewave Indicator
- Extend Bar Gap Until Future Intersection
- Extend Bar Value Until Future Intersection
- Extend Closes Until Future Intersection
- Fisher Center Of Gravity Oscillator
- Fisher Cyber Cycle
- Fisher Function
- Fisher Relative Vigor Index 3
- Fisher Transform
- Force Index
- Force Index Average
- Forward Curve
- Forward Projection Bars
- Freedom of Movement
- Full Contract Value
- Gann HiLo Activator
- Gann Swing Oscillator
- Gann Trend Oscillator
- Greatest Swing Value
- HL Volatility
- HalfTrend
- Heikin-Ashi
- Heikin-Ashi Smoothed
- Herrick Payoff Index
- High Low For Time Period
- High Low For Time Period - Extended
- Highest High Lowest Low Over N Bars
- Historical Volatility Ratio
- Horizontal Line At Time
- Horizontal Lines
- Hurst Bands
- Hurst Exponent
- Inertia
- Inertia 2
- Initial Balance
- Inside Bar
- Inside or Equals Bar
- Instantaneous Trendline
- Inverse Fisher Transform
- Inverse Fisher Transform with RSI
- Island Reversal
- KDJ
- KD - Fast
- KD - Slow
- Kagi Chart
- Kaufman Efficiency Ratio
- Keltner Channel
- Kijun Sen
- Kiwis Trailing Stop
- Klinger Volume Oscillator
- Kurtosis
- LSMA Above Below CCI
- LSMA Above Below Last
- Laguerre Filter
- Laguerre RSI
- Large Volume Trade Indicator
- Leading Indicator
- Line
- Linear Estimation
- Linear Regression End Channel
- Linear Regressive Slope
- Load Day Session Only at Open
- MACD
- MACD - Volume Weighted
- MACD Bollinger Bands - Improved
- MACD Bollinger Bands - Standard
- MACD Crossover System
- MACD Leader
- Market Depth Historical Graph
- Market Facilitation Index
- Market Facilitation Index Colored
- Market Structure MSL MSH
- McClellan Oscillator - 1 Chart
- McClellan Summation Index - 1 Chart
- Momentum
- Momentum Trend
- Momentum with Moving Average
- Money Flow Index
- Moving Average - Adaptive
- Moving Average - Adaptive Binary Wave
- Moving Average - Arnaud Legoux
- Moving Average - Block
- Moving Average - Double Exponential
- Moving Average - Elastic Volume Weighted
- Moving Average - Exponential
- Moving Average - Exponential Regression
- Moving Average - Generalized Double Exponential
- Moving Average - Hull
- Moving Average - Linear Regression
- Moving Average - Move-Adjusted
- Moving Average - Rolling High Accuracy
- Moving Average - Simple
- Moving Average - Simple Skip Zeros
- Moving Average - Sine-Wave Weighted
- Moving Average - Smoothed
- Moving Average - Time Period
- Moving Average - Triangular
- Moving Average - Triple Exponential
- Moving Average - Variable Index Dynamic
- Moving Average - Volume Move-Adjusted
- Moving Average - Volume Weighted
- Moving Average - Weight Volume Move-Adjusted
- Moving Average - Weighted
- Moving Average - Welles Wilders
- Moving Average - Zero Lag Exponential
- Moving Average Crossover
- Moving Average Difference
- Moving Average Envelope
- Moving Averages
- Moving Linear Regression
- Moving Median
- Multiply All Charts
- Multiply Bars By -1
- Multiply Charts - Bar
- Murrey Math
- Mutual Fund Bars
- Narrow Range Bar
- Negative Volume Index
- New Daily High Low Alert
- Normalized Volume
- Number of Trades
- Number of Trades - Ask
- Number of Trades - Bid
- Numbers Bars
- Numbers Bars Calculated Values
- Numbers Bars Avg Volume Per Price Graph
- On Balance Open Interest
- On Balance Open Interest - Short Term
- On Balance Volume
- On Balance Volume - Short Term
- On Balance Volume with Moving Average
- One Time Framing
- Open Interest
- Out of Order Timestamps Detector
- Outside Bar
- Overlay - Bar
- Overlay - Single Line
- Overlay Non sync
- Parabolic
- Percent Change Since Open
- Percent Change Since Previous Close
- Percentage Price Oscillator
- Period OHLC-Variable Period
- Pivot Points - Daily
- Pivot Points - Variable Period
- Pivot Range - Variable Period
- Point Figure Chart Reversal Marker
- Point and Figure Box Count
- Point and Figure Chart
- Polarized Fractal Efficiency
- Positive Volume Index
- Preferred Stochastic - DiNapoli
- Premier Stochastic Oscillator
- Previous Bar Close
- Previous Close Line
- Price Change Since Open
- Price Levels
- Price Momentum Oscillator
- Price Open Interest Volume
- Price Volume Trend
- Q Stick
- RSI
- RSI - Connors
- RSI - TS
- RSI - W
- R Squared
- Rahul Mohindar Oscillator
- Random Walk Indicator
- Range Bar Predictor
- Range Expansion Index
- Rapid Adaptive Variance Indicator
- Rate of Change - Percentage
- Rate of Change - Points
- Rate of Change Oscillator Type I
- Rate of Change Oscillator Type II
- Ratio - Bar
- Ratio - Single Line
- Relative Momentum Index
- Relative Vigor Index
- Relative Vigor Index 1
- Relative Vigor Index 2
- Relative Vigor Index 3
- Relative Volume
- Relative Volume Standard Deviation
- Renko Bar Predictor
- Renko Chart Enhanced
- Renko Charts
- Renko Visual Open Close Values
- Repulse
- Reverse Order Copy Of Base Graph
- Rollover Date Display
- Rotation Factor
- Round Price Bars to Tick Size
- Round Study Subgraph To Tick Size
- SC Woodies Panel
- STIX
- Schaff Trend Cycle
- Senkou Span A
- Senkou Span A and B
- Senkou Span B
- Session Indicator
- SideWinder
- Sinewave Indicator
- Smoothed Adaptive Momentum
- Spread - 3 Chart
- Spread - 4 Chart
- Spread - Butterfly
- Spreadsheet Formula
- Spreadsheet Study
- Spreadsheet System Alert
- Spreadsheet System Alert for Trading
- Square Of 9
- Standard Deviation
- Standard Deviation Bands
- Standard Error Bands
- Starc Bands
- Stochastic - Fast
- Stochastic - Percentile
- Stochastic - Slow
- Stochastic Center Of Gravity Oscillator
- Stochastic Crossover System
- Stochastic Cyber Cycle
- Stochastic Function
- Stochastic Momentum Indicator
- Stochastic RSI
- Stochastic Relative Vigor Index 3
- Study/Price Overlay
- Study Angle
- Study Moving Average
- Study Overlay - OHLC - Open High Low Close
- Study Subgraph Above Below Bar As Text
- Study Subgraph Absolute Value
- Study Subgraph Add
- Study Subgraph As Text Above Below Bar
- Study Subgraph Daily High Low
- Study Subgraph Divide
- Study Subgraph In Ticks
- Study Subgraph Multiply
- Study Subgraph Reference
- Study Subgraph Reverse Order
- Study Subgraph Standard Deviation
- Study Subgraph Subtract
- Study Subgraph as Currency Value
- Study Subgraphs Add
- Study Subgraphs Average
- Study Subgraphs Divide - Ratio
- Study Subgraphs Multiply
- Study Subgraphs Reference
- Study Subgraphs Subtract - Difference
- Sum - Bar
- Sum 3 Chart
- Sum All Charts
- Sum All Charts - Bar
- Sum Charts From List
- Summation
- Summation Of Study Subgraph Periodic
- Summation Periodic
- SuperTrend
- Super Smoother Filter
- Super Trend Stop
- Swing High and Low
- Symbol Display
- Synthetic VIX
- T3
- TPO and Volume Profile Chart
- TPO Value Area Lines
- TRIX
- Tenkan Sen
- Text Display For Study
- Text Display For Study from Chart
- Three Line Break Chart
- Time And Sales Total Ask Size Depth
- Time Line
- Time Range Highlight
- Time Range Highlight - Transparent
- Time Series Forecast
- Time and Sales Ask Size
- Time and Sales Bid Ask
- Time and Sales Bid Size
- Time and Sales Price
- Time and Sales Time
- Time and Sales Total Bid Size Depth
- Time and Sales Volume
- Trade Management by Study
- Trade Volume Index
- Traders Dynamic Index
- Trading: Closed Profit/Loss
- Trading: Daily Profit/Loss
- Trading: Losing Trades
- Trading: Maximum Drawdown
- Trading: Maximum Runup
- Trading: Position
- Trading: Profit/Loss Text
- Trading: Spread Order Entry
- Trading: Total Quantity Filled
- Trading: Total Trades
- Trading: Triggered Limit Order Entry
- Trading: Triggered Market Order for Trade Symbol
- Trading: Winning Trades
- Trading Levels
- Trading Levels - Local Data
- Trading Profit Management Status
- Trading System - Study Subgraph Crossover
- Trading System Based On Alert Condition
- Trading the Nines
- True Bar Average
- True Range
- True Strength Index
- Turbo MACD
- Ultimate Oscillator
- UpTick Volume
- Up Down Volume Difference Bars
- Up Down Volume Ratio
- Value Chart
- Value Chart Levels
- Vertical Horizontal Filter
- Volatility Chaikins
- Volatility Historical
- Volatility Trend Indicator
- Volume
- Volume At Price Threshold Alert
- Volume At Price Threshold Alert V2
- Volume Bar Range Ratio
- Volume By Price Reset Button
- Volume Colored Based on Bar Closes
- Volume Colored Based on Volume
- Volume Distribution Paint Bar Study
- Volume Divided By Number Of Trades
- Volume Down
- Volume Point Of Control For Bars
- Volume Positive Negative Indicator
- Volume Up
- Volume Value Area For Bars
- Volume Value Area Lines
- Volume Weighted Average Price - VWAP - Rolling with Standard Deviation Lines
- Volume Weighted Average Price - VWAP - with Standard Deviation Lines
- Volume Zone Oscillator
- Volume by Price
- Vortex
- Wave Trend Oscillator
- Weekly OHLC
- Weighted Average Oscillator
- Wide Range Bar
- Williams R
- Woodie CCI Trend
- Woodies CCI Trend
- Woodies EMA
- Woodies ZLR System
- Write Bar Data to File
- Write Bar and Study Data To File
- Z Score
- Zig Zag
- Zig Zag Cumulative Volume
Multiple Chart Studies
These instructions are for studies that use 2 or more charts in their formula. For example, the Ratio (Bar/Single Line), Difference (Bar/Single Line), or Combination Symbol Chart studies. There are other studies which use two or more charts as well.
- Open 2 charts, if they are not already open. To open the charts use File >> Find Symbol >> [select symbol] >> Open Intraday Chart/Open Historical Chart. These are the two charts used in the calculation. For example, if you want to calculate the difference between symbol A and symbol B, then open charts for both of these symbols.
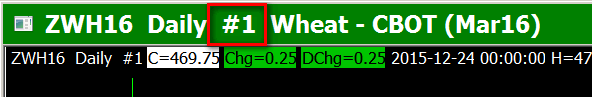
- Each chart has a number. Let us assume that the two charts opened have chart Numbers #1 and #2 respectively.
- Add the Ratio (Bar) or Difference (Bar) study to the chart identified as #1. Or, whatever study you need to work with that requires a second chart in its calculation. You can also add the Single Line version of these studies. For instructions to add a study to the chart, refer to Adding/Modifying Studies.
The formula for Difference is Chart #1 - Chart #2. Therefore, the Difference study, or whatever study you want to work with, needs to be added to the chart to the left of the minus operator in this particular example. This can be any chart. - Set the Chart 2 Number Input with the study to the chart that you want on the right side of the calculation. Each chart is identified with a number. The Chart Numbers are displayed along the Region Data Line at the top of the chart and on the title bar of the chart. Refer to the example below.
- Press OK to close Study Settings window.
- Press OK to close the Chart Studies window.
- You will now see the Ratio or Difference calculation (or whatever the result is based upon the study you are using) displayed in Chart Region 2 on Chart #1.
- To understand how each chart fits into the calculation, we will explain this with the Ratio (Bar) study. If you add the Ratio study to Chart #1 and set the Chart 2 Number Input to Chart #2, then #1 will be divided by #2 (#1 / #2). So the chart that the study is applied to, is used on the left side of the division operator.
- The Days To Load and Time Period per Bar settings for a chart, that is referenced by one of these studies, cannot be changed. They are set to the same settings as the chart that is referencing it. If they are changed, then they will be changed back to the same settings as the chart containing the study that is referencing it.
Displaying As Main Price Graph
If you want to make a study that uses multiple charts, the main price graph in the chart, and allow other studies to be applied to it, then enable the Display as Main Price Graph option in the Study Settings window for the study. Once you do this, other studies you have applied or will apply to the chart, will then be based upon this multiple chart study.
Inputs
- Input Data (applies only to multiple chart studies that use a single line and not a price bar style)
- Chart 1, 2, 3 Multiplier: Value to multiply the selected Input Data or the bar in chart 1, 2, or 3 by. Chart 1 is the chart the study is applied to.
- Chart 2, 3 Number: The Chart Number of the second or third chart to use in the study formula. Select the chart from the list of charts. The first chart used in the calculation is the chart that the study is applied to.
- Chart 1 Addition: This Input adds the specified amount to chart 1 after multiplying chart 1 by the Chart 1 Multiplier.
*Last modified Thursday, 23rd February, 2023.