Home >> (Table of Contents) Studies and Indicators >> Technical Studies Reference >> Island Reversal
Technical Studies Reference
- Technical Studies Reference
- Common Study Inputs (Opens a new page)
- Using Studies (Opens a new page)
Island Reversal
This study marks the beginning and end of an Island Reversal pattern in a chart.
Let \(H\) and \(L\) be random variables denoting the High and Low Prices, respectively, and let \(H_t\) and \(L_t\) be their respective values at Index \(t\). We define a Gap Up and a Gap Down in a chart as follows.
- A Gap Up occurs at Index \(T_U\) if \(L_{T_U} > H_{T_U - 1}\).
- A Gap Down occurs at Index \(T_D\) if \(H_{T_D} < L_{T_D - 1}\).
A Bearish Island Reversal (aka a Top Island) pattern occurs in a chart when there is a Gap Up followed by a Gap Down, where every chart bar from Index \(T_U\) through Index \(T_D - 1\) is above the Gap Level, which we take to be \(\max\{H_{T_U - 1}, H_{T_D}\}\). The chart bars from Index \(T_U\) through Index \(T_D - 1\) form an isolated "island" of bars above the immediately surrounding bars (see figure at right).

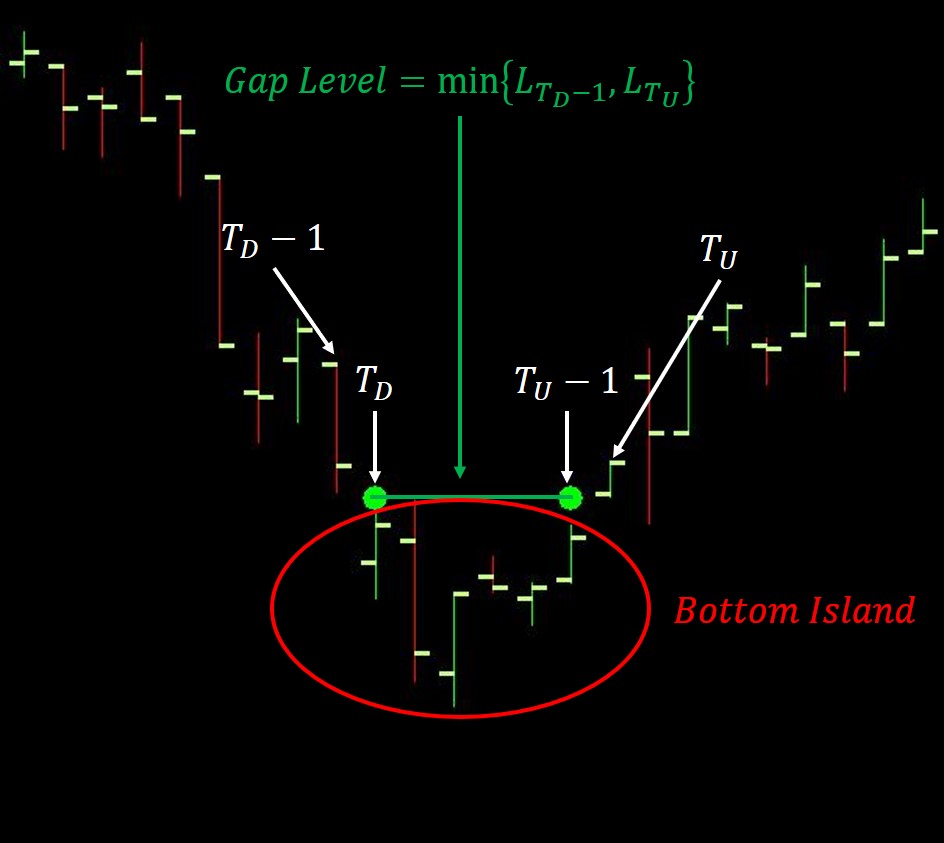
A Bullish Island Reversal (aka a Bottom Island) pattern occurs in a chart when there is a Gap Down followed by a Gap Up, where every chart bar from Index \(T_D\) through Index \(T_U - 1\) is below the Gap Level, which we take to be \(\min\{L_{T_D - 1}, L_{T_U}\}\). The chart bars from Index \(T_D\) through Index \(T_U - 1\) form an isolated "island" of bars below the immediately surrounding bars (see figure at right).
In either case, the beginning and end of the Island Reversal are marked by points at the Gap Level of the pattern.
Inputs
- This study has no Inputs.
*Last modified Monday, 26th September, 2022.