Home >> (Table of Contents) Studies and Indicators >> Technical Studies Reference >> Market Depth Historical Graph
Technical Studies Reference
- Technical Studies Reference
- Common Study Inputs (Opens a new page)
- Using Studies (Opens a new page)
Market Depth Historical Graph
- Introduction
- Step by Step Instructions
- Symbols that Provide Market Depth Data
- Study Inputs
- Range 3 Max Ask Color
- Range 3 Min Ask Color
- Range 2 Max Ask Color
- Range 2 Min Ask Color
- Range 1 Max Ask Color
- Range 1 Min Ask Color
- Range 0 Max Ask Color
- Range 0 Min Ask Color
- Range 0 Min Bid Color
- Range 0 Max Bid Color
- Range 1 Min Bid Color
- Range 1 Max Bid Color
- Range 2 Min Bid Color
- Range 2 Max Bid Color
- Range 3 Min Bid Color
- Range 3 Max Bid Color
- Use Range Minimum Colors
- Use Percent or Actual Values for Threshold Levels
- Percent Color Thresholds
- Actual Color Thresholds
- Minimum Volume Intensity Percent
- Color Values Greater Than the Highest Quantity for Coloring
- Value Type for Highest Quantity for Coloring
- Highest Quantity For Coloring
- Value Type for Lowest Quantity For Coloring
- Lowest Quantity for Coloring
- Extend Last Known Depth
- Number of Minutes to Extend Last Known Depth (0 for All)
- Show Quantity Numbers
- Bid Quantity Numbers Color
- Ask Quantity Numbers Color
- Use Secondary Numbers Color for Quantities Greater Than or Equal To
- Secondary Numbers Color for Quantities Greater Than or Equal To
- Display Market Depth Quantities After Last Bar
- Depth Quantity Type to Display After Last Bar
- Percentage Of Fill Space To Display Market Depth Quantity Rectangles In
- Use Last Quantity Instead Of Max Quantity For Bars
- Determine Min and Max Levels from All Bars or Visible Bars
- Font Size
- Maximum Levels to Display (0 for All)
- Combine Increment in Ticks
- Automatic Combine Increment Adjustment Value
- Block Coloring Logic
- Combine Increment in Ticks Additional Information
- Market Depth Historical Graph Not Displaying
- Market Depth Data Time Stamping During Real Time Updates and Replays
- Market Depth Historical Graph Timing in Relation to Chart Bar Date-Times
- Drawing of Depth Quantities at Price Levels on Chart Bars where there have been No Depth Updates
- Improving Performance
- Downloading of Historical Market Depth Data
- Other Related Useful Studies
- c_ACSILDepthBars (Programmatically Accessing Market Depth Data) (Opens a new page)
Introduction
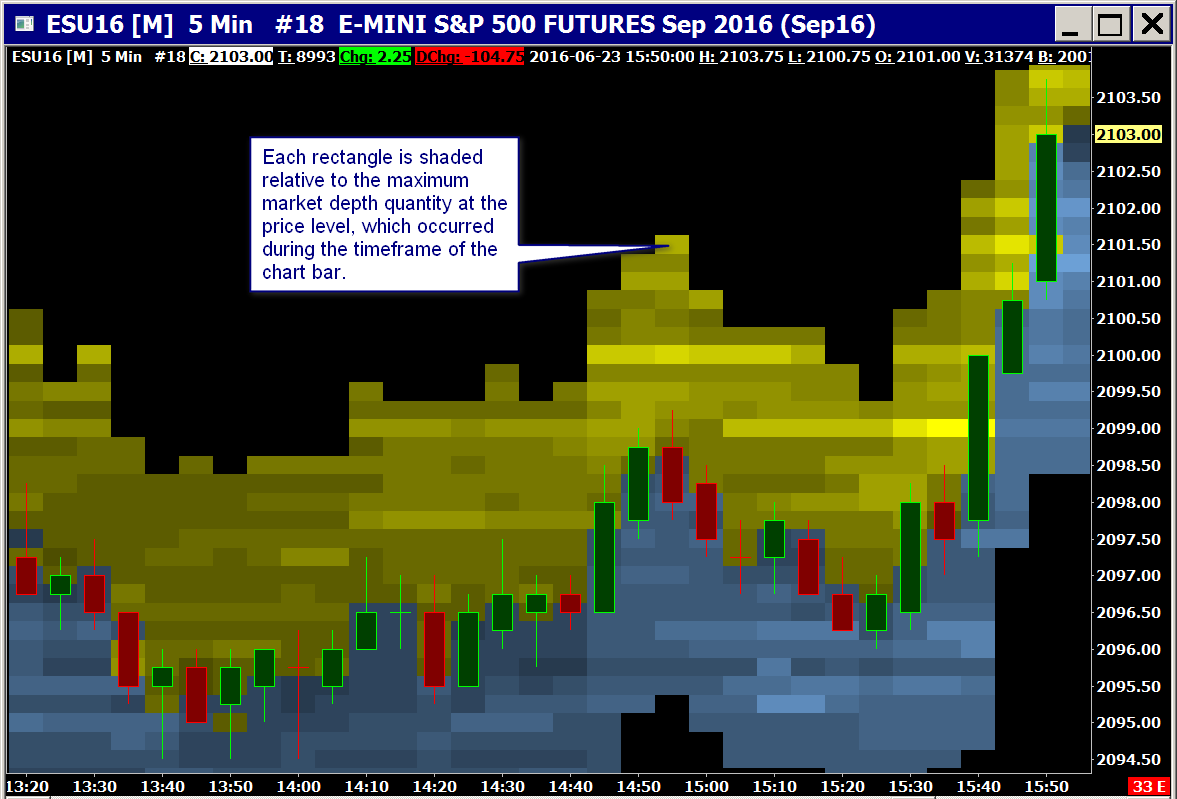
The Market Depth Historical Graph study displays by default at each chart column the highest market depth quantity at each price level, which occurred during the timeframe of the chart bar, as a color-coded rectangle.
If the Use Last Quantity Instead Of Max Quantity For Bars Input is set to Yes, then the last market depth quantity at a price level for the chart column will be displayed instead of the maximum quantity.
This study only works with Intraday charts.
The market depth quantities displayed after the last bar in the chart from the last column currently displayed in the chart, are displayed in the space between the last column with market depth data and the right side of the chart when the Display Market Depth Quantities After Last Bar Input is set to Yes. These values will match with the data in File >> Open Market Depth Window when the Depth Quantity Type to Display After Last Bar is set to Last Depth.
The maximum market depth quantity at a price level is only shown at the chart bar during the timeframe it occurred. For subsequent bars, if there has been no market depth update at that price level, the last market depth quantity is displayed until it is deleted by the market depth data stream.
In order for the Market Depth Historical Graph study to display the color-coded rectangles for market depth, historical market depth data must be collected for the chart's symbol. Refer to the Step by Step Instructions.
If there has been no market depth updates for an entire bar, then, by default, no market depth data is displayed for that bar. Setting the Input for Extend Last Known Depth to Yes will extend the known depth value forward into those bars that do not have data. The Input for Number of Minutes to Extend Last Known Depth (0 for All) controls how far forward the extensions will extend.
Replaying market depth is also supported by using the Chart Replay feature.
During the formation of a chart bar which covers a certain span of time, the market depth bid and ask values are continuously varying during that timeframe. Therefore, for a given price level, there can be and most likely are both bid and ask market depth quantities recorded. However, only the bid side or ask side quantity at that price level is displayed depending upon which one is dominant. Both are not displayed.
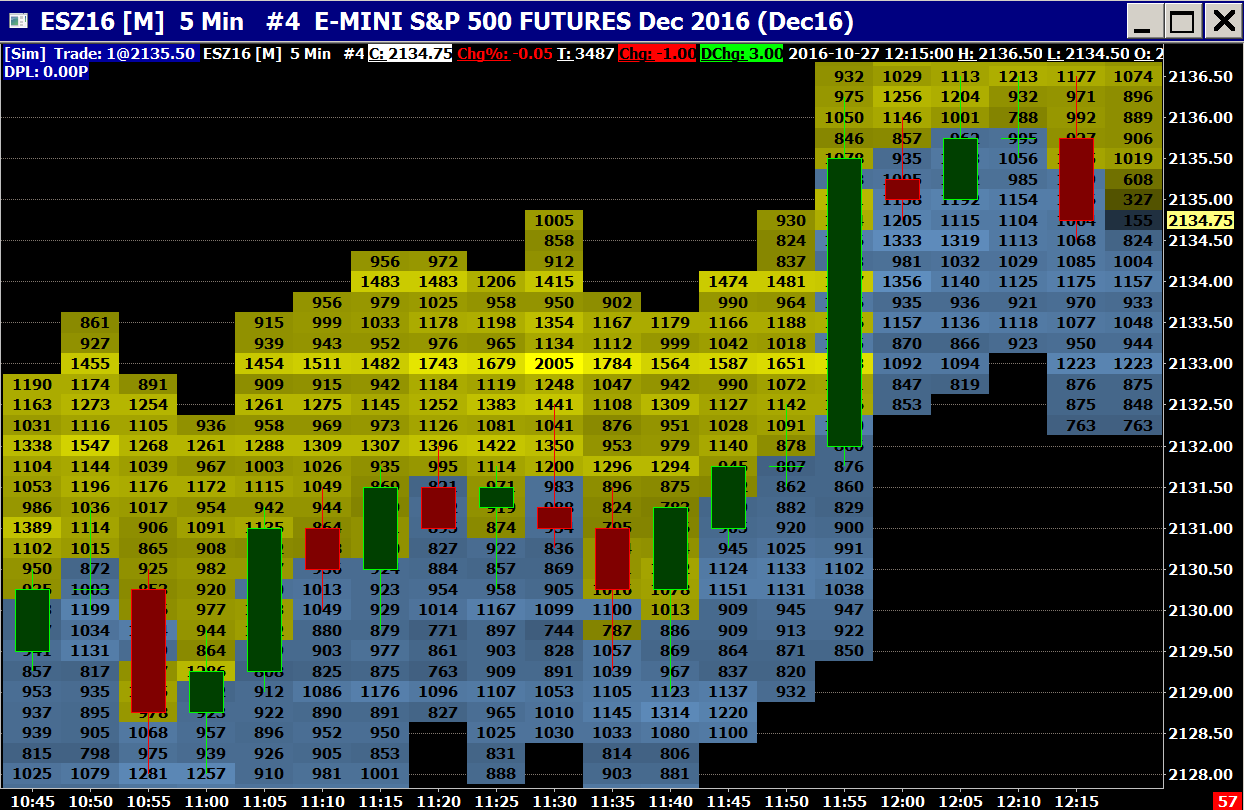
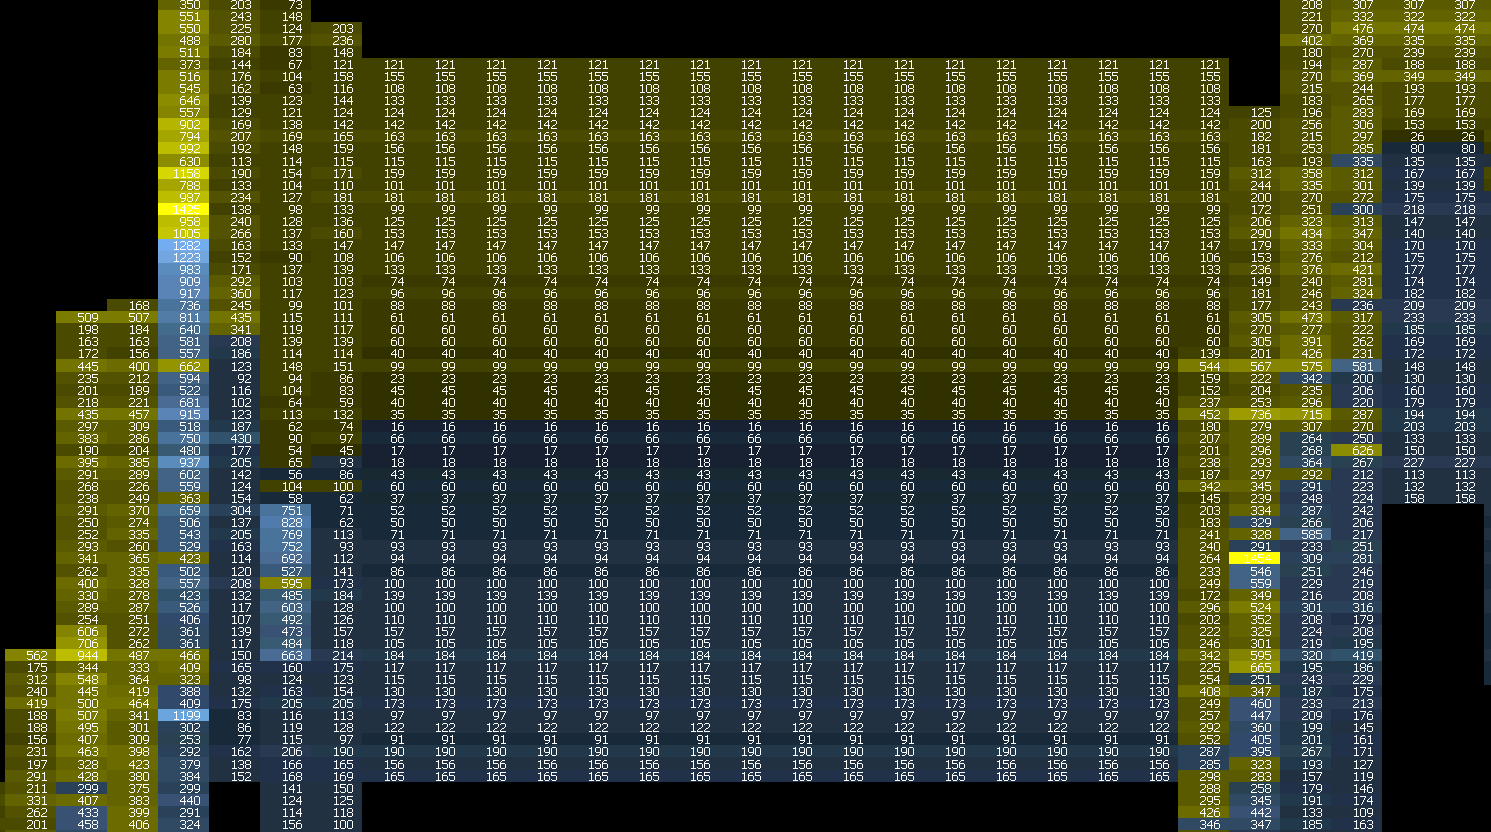
Below are examples of the Market Depth Historical Graph study on an Intraday chart:
Step by Step Instructions
- Make sure your Sierra Chart Service Package is set to a Service Package that includes Advanced features.
- Select Global Settings >> Symbol Settings on the menu.
- Locate the symbol or symbol pattern for the Symbol in the list of symbols, that you want to use the Market Depth Historical Graph study with. Select that symbol or symbol pattern.
- Select the Record Market Depth Data option in the Settings section on the right for this symbol or symbol pattern.
- Enable the Record Market Depth Data option by selecting Yes in the Custom list.
- Check to ensure that the option for Use Custom Symbol Settings Values in the upper left corner of the Symbol Settings window is enabled. If this is not enabled, then click in the box to place a checkmark and enable this option.
- Press OK.
- Reconnect to the data feed with File >> Disconnect and File >> Connect to Data Feed after altering the Symbol Settings.
- Go to the chart you want to add the Market Depth Historical Graph study to.
- Select Analysis >> Studies.
- In the list of the Studies Available, select Market Depth Historical Graph.
- Press the Add button.
- Press the Settings button. Set the Study Inputs as required.
- Press OK.
- Press OK.
- Select Chart >> Chart Settings.
- Adjust the Use Number of Days to Load >> Market Depth to the maximum number of days of market depth data you want to load in the chart relative to the last date loaded in the chart.
- Press OK.
- As the market depth data starts to be received, you will see the color-coded rectangles on the chart. Sierra Chart will need to be connected to the data feed with File >> Connect to Data Feed and the market needs to be open for the symbol in order to receive market depth data.
- By default, historical market depth data is only loaded for the last 10 days of data in an Intraday chart if there is historical market depth data available for those days. To adjust this, select Chart >> Chart Settings. Increase or decrease the Use Number of Days to Load >> Market Depth setting. The default is 10.
The market depth data is permanently recorded in depth files. One for each day. These files are located in the MarketDepthData subfolder of the Sierra Chart Data Files Folder. In the case of a Continuous Futures Contract chart, currently only historical market depth data will be displayed for the bars in the chart that are for the current futures contract symbol set with the Chart >> Chart Settings >> Symbol setting.
To display lines on the chart at the most recent Bid and Ask prices at each chart bar, use the Bid and Ask Prices study. This is an optional study and not required.
Historical Market Depth Data can be downloaded for the previous 15 days when using the Denali Exchange Data Feed. Therefore, if Market Depth Data is missing due to not having Sierra Chart connected to the data feed at all times, then refer to the section for Downloading of Historical Market Depth Data.
Symbols that Provide Market Depth Data
Below is a list of Data Services, Exchanges and Symbols, which provide market depth data. Exchanges and categories of symbols that do not provide market depth data are also listed and noted of this fact. Consult with this list if you do not have market depth data for a particular symbol.
In the case of the CME Group of exchanges, if you do not have market depth data for a particular symbol, then refer to Adding Support for CME Market Depth Data.
- None of the Sierra Chart Real-time and Historical Forex/CFD symbols provide market depth data. As an alternative you can use the LMAX Trading Service which provides market depth data for Forex symbols.
- None of the Sierra Chart Market Statistics Data Feed symbols provide market depth data.
- Symbols with the Crypto Currency Data Services do provide market depth data but the market depth data may be unreliable. Technical help is not provided for market depth data issues for these symbols.
- The following exchanges supported with the Denali Exchange Data Feed do provide market depth data. However, you may have to pay a higher priced exchange fee for market depth data: CME, CBOT, NYMEX, COMEX, EUREX, CFE, NASDAQ TotalView. NASDAQ Global Index symbols do not provide market depth data.
- The following exchanges supported with the Delayed Exchange Data Feed do provide market depth data: CME, CBOT, NYMEX, COMEX, EUREX, CFE. End of day delayed historical market depth data is available for NASDAQ TotalView symbols.
Study Inputs
Range 3 Max Ask Color
This is the maximum intensity color that is used for price levels at which the Ask quantity is greater than the Bid quantity and the depth value as a percentage of the greatest range is greater than the last percentage entered in the Percent Color Thresholds.
When the Input for Use Range Minimum Colors is set to No then this should be set to a light color when using a dark background in the chart as the gradient is based on these two colors.
When the Input for Use Range Minimum Colors is set to Yes then the color gradient is based on this color and the Range 3 Min Ask Color.
See the Block Coloring Logic section for more details.
Range 3 Min Ask Color
This is the minimum intensity color that is used for price levels at which the Ask quantity is greater than the Bid quantity and the depth value as a percentage of the greatest range is greater than the last percentage entered in the Percent Color Thresholds.
This Input is only used when the Input for Use Range Minimum Colors is set to Yes. When this is the case then the color gradient is based on this color and the Range 3 Max Ask Color.
See the Block Coloring Logic section for more details.
Range 2 Max Ask Color
This is the maximum intensity color that is used for price levels at which the Ask quantity is greater than the Bid quantity and the depth value as a percentage of the greatest range is greater than the second percentage and less than or equal to the third percentage entered in the Percent Color Thresholds.
When the Input for Use Range Minimum Colors is set to No then this should be set to a light color when using a dark background in the chart as the gradient is based on these two colors.
When the Input for Use Range Minimum Colors is set to Yes then the color gradient is based on this color and the Range 2 Min Ask Color.
See the Block Coloring Logic section for more details.
Range 2 Min Ask Color
This is the minimum intensity color that is used for price levels at which the Ask quantity is greater than the Bid quantity and the depth value as a percentage of the greatest range is greater than the second percentage and less than or equal to the third percentage entered in the Percent Color Thresholds.
This Input is only used when the Input for Use Range Minimum Colors is set to Yes. When this is the case then the color gradient is based on this color and the Range 2 Max Ask Color.
See the Block Coloring Logic section for more details.
Range 1 Max Ask Color
This is the maximum intensity color that is used for price levels at which the Ask quantity is greater than the Bid quantity and the depth value as a percentage of the greatest range is greater than the first percentage and less than or equal to the second percentage entered in the Percent Color Thresholds.
When the Input for Use Range Minimum Colors is set to No then this should be set to a light color when using a dark background in the chart as the gradient is based on these two colors.
When the Input for Use Range Minimum Colors is set to Yes then the color gradient is based on this color and the Range 1 Min Ask Color.
See the Block Coloring Logic section for more details.
Range 1 Min Ask Color
This is the minimum intensity color that is used for price levels at which the Ask quantity is greater than the Bid quantity and the depth value as a percentage of the greatest range is greater than the first percentage and less than or equal to the second percentage entered in the Percent Color Thresholds.
This Input is only used when the Input for Use Range Minimum Colors is set to Yes. When this is the case then the color gradient is based on this color and the Range 1 Max Ask Color.
See the Block Coloring Logic section for more details.
Range 0 Max Ask Color
This is the maximum intensity color that is used for price levels at which the Ask quantity is greater than the Bid quantity and the depth value as a percentage of the greatest range is less than or equal to the first percentage entered in the Percent Color Thresholds.
When the Input for Use Range Minimum Colors is set to No then this should be set to a light color when using a dark background in the chart as the gradient is based on these two colors.
When the Input for Use Range Minimum Colors is set to Yes then the color gradient is based on this color and the Range 0 Min Ask Color.
See the Block Coloring Logic section for more details.
Range 0 Min Ask Color
This is the minimum intensity color that is used for price levels at which the Ask quantity is greater than the Bid quantity and the depth value as a percentage of the greatest range is less than or equal to the first percentage entered in the Percent Color Thresholds.
This Input is only used when the Input for Use Range Minimum Colors is set to Yes. When this is the case then the color gradient is based on this color and the Range 0 Max Ask Color.
See the Block Coloring Logic section for more details.
Range 0 Min Bid Color
This is the minimum intensity color that is used for price levels at which the Bid quantity is greater than the Ask quantity and the depth value as a percentage of the greatest range is less than or equal to the first percentage entered in the Percent Color Thresholds.
This Input is only used when the Input for Use Range Minimum Colors is set to Yes. When this is the case then the color gradient is based on this color and the Range 0 Max Bid Color.
See the Block Coloring Logic section for more details.
Range 0 Max Bid Color
This is the maximum intensity color that is used for price levels at which the Bid quantity is greater than the Ask quantity and the depth value as a percentage of the greatest range is less than or equal to the first percentage entered in the Percent Color Thresholds.
When the Input for Use Range Minimum Colors is set to No then this should be set to a light color when using a dark background in the chart as the gradient is based on these two colors.
When the Input for Use Range Minimum Colors is set to Yes then the color gradient is based on this color and the Range 0 Min Bid Color.
See the Block Coloring Logic section for more details.
Range 1 Min Bid Color
This is the minimum intensity color that is used for price levels at which the Bid quantity is greater than the Ask quantity and the depth value as a percentage of the greatest range is greater than the first percentage and less than or equal to the second percentage entered in the Percent Color Thresholds.
This Input is only used when the Input for Use Range Minimum Colors is set to Yes. When this is the case then the color gradient is based on this color and the Range 1 Max Bid Color.
See the Block Coloring Logic section for more details.
Range 1 Max Bid Color
This is the maximum intensity color that is used for price levels at which the Bid quantity is greater than the Ask quantity and the depth value as a percentage of the greatest range is greater than the first percentage and less than or equal to the second percentage entered in the Percent Color Thresholds.
When the Input for Use Range Minimum Colors is set to No then this should be set to a light color when using a dark background in the chart as the gradient is based on these two colors.
When the Input for Use Range Minimum Colors is set to Yes then the color gradient is based on this color and the Range 1 Min Bid Color.
See the Block Coloring Logic section for more details.
Range 2 Min Bid Color
This is the minimum intensity color that is used for price levels at which the Bid quantity is greater than the Ask quantity and the depth value as a percentage of the greatest range is greater than the second percentage and less than or equal to the third percentage entered in the Percent Color Thresholds.
This Input is only used when the Input for Use Range Minimum Colors is set to Yes. When this is the case then the color gradient is based on this color and the Range 2 Max Bid Color.
See the Block Coloring Logic section for more details.
Range 2 Max Bid Color
This is the maximum intensity color that is used for price levels at which the Bid quantity is greater than the Ask quantity and the depth value as a percentage of the greatest range is greater than the second percentage and less than or equal to the third percentage entered in the Percent Color Thresholds.
When the Input for Use Range Minimum Colors is set to No then this should be set to a light color when using a dark background in the chart as the gradient is based on these two colors.
When the Input for Use Range Minimum Colors is set to Yes then the color gradient is based on this color and the Range 2 Min Bid Color.
See the Block Coloring Logic section for more details.
Range 3 Min Bid Color
This is the minimum intensity color that is used for price levels at which the Bid quantity is greater than the Ask quantity and the depth value as a percentage of the greatest range is greater than the last percentage entered in the Percent Color Thresholds.
This Input is only used when the Input for Use Range Minimum Colors is set to Yes. When this is the case then the color gradient is based on this color and the Range 3 Max Bid Color.
See the Block Coloring Logic section for more details.
Range 3 Max Bid Color
This is the maximum intensity color that is used for price levels at which the Bid quantity is greater than the Ask quantity and the depth value as a percentage of the greatest range is greater than the last percentage entered in the Percent Color Thresholds.
When the Input for Use Range Minimum Colors is set to No then this should be set to a light color when using a dark background in the chart as the gradient is based on these two colors.
When the Input for Use Range Minimum Colors is set to Yes then the color gradient is based on this color and the Range 3 Min Bid Color.
See the Block Coloring Logic section for more details.
Use Range Minimum Colors
When this Input is set to Yes, the Range # Min Ask/Bid Color Inputs are used along with the Range # Max Ask/Bid Color to determine the color gradient for depth values that fall into a specific range. Otherwise, the background color is used along with the Range # Max Ask/Bid Color to determine the color gradient for depth values that fall into a specific range.
Regardless of this setting, the Minimum Volume Intensity Percent still applies for each range of color values.
Use Percent or Actual Values for Threshold Levels
This Input controls whether the Threshold Levels that determine which color range a particular depth value will be colored, is determined from the Percent Color Thresholds or the Actual Color Thresholds.
This Input has two options:
- Percent: When the Use Percent or Actual Values for Thresholds Levels is set to this selection, the color range thresholds are determined from the Percent Color Thresholds Input.
- Actual Value: When the Use Percent or Actual Values for Thresholds Levels is set to this select, the color range thresholds are determined from the Actual Color Thresholds Input.
For more information, refer to the Block Coloring Logic section.
Percent Color Thresholds
This defines the percentages at which the Range 0-3 Ask/Bid Color options are separated when the Input for Use Percent or Actual Values for Threshold Levels is set to Percent.
Three values are to be entered as decimal values with a comma separating the values. For example, if the desired percentages are 40%, 60%, and 80%, these would be entered in this field as .40, .60, .80.
See the Block Coloring Logic section for more details.
Actual Color Thresholds
This defines the actual depth values at which the Range 0-3 Ask/Bid Color options are separated when the Input for Use Percent or Actual Values for Threshold Levels is set to Actual Values.
Three values are to be entered with a comma separating the values. For example, if the desired values are 500, 1000, and 1500, these would be entered in this field as 500, 1000, 1500.
See the Block Coloring Logic section for more details.
Minimum Volume Intensity Percent
This percentage is the intensity used for the blocks with the smallest, non-zero, market depth quantity within each color range among all of the visible blocks on the chart. The valid range for this Input is 0 to 90.
A greater value for this Input will effectively increase the visibility of blocks towards the bottom of each color range, but decrease the overall contrast. Whereas a lesser value for this Input will increase the contrast between blocks, but decrease the visibility of blocks towards the bottom of each color range. A value of 0 will make it so the blocks with the smallest, non-zero, market depth quantity within each color range, among all of the visible blocks on the chart will have an intensity of 0 percent, effectively making them the same color as the chart background.
See the Block Coloring Logic section for more details.
Color Values Greater Than the Highest Quantity for Coloring
This Input controls whether values that are greater than the Highest Quantity for Coloring will be drawn or not. When this Input is set to Yes (the default), then any quantity that is greater than or equal to the Highest Quantity for Coloring, will be drawn and colored the Range 3 Max Color.
When this Input is set to No, then any value that is greater than the Highest Quantity for Coloring will not be drawn.
Value Type for Highest Quantity for Coloring
This Input controls how the value entered in the Highest Quantity for Coloring is interpreted. The available options are the following:
- Actual Value: This sets the value entered in the Highest Quantity for Coloring Input as the actual Market Depth value that will be used as the largest depth value for coloring purposes.
- Percentage of Maximum Depth: This sets the value entered in the Highest Quantity for Coloring Input as a Percentage of the Maximum Depth which establishes the largest depth value for coloring purposes.
It is important to note that when using the option Percentage of Maximum Depth this is the percentage of the Maximum Market Depth Value based on the setting for the Determine Min and Max Levels From All Bars or Visible Bars Input. When Determine Min and Max Levels From All Bars or Visible Bars is set to Visible Bars then as scrolling through the chart, the highest quantity for coloring, will be constantly changing as the Maximum Depth Value changes based on what is in view.
Highest Quantity For Coloring
This value determines the highest depth level that will be used for the Block Coloring Logic. Any Market Depth value that is greater than or equal to the determined Highest Quantity for Coloring will be colored the Range 3 Max Color.
When the Input for Value Type for Highest Quantity for Coloring is set to Actual Value then the value of this Input is used directly to set the highest depth level that is used for coloring the blocks. In this case, setting this Input to a value of 0 means the highest quantity is set by the actual Maximum Depth being used. Setting this value to any number greater than the actual Maximum Depth will have no effect.
When the Input for Value Type for Highest Quantity for Coloring is set to Percentage of Maximum Depth then this Input is divided by 100 to determine a decimal percentage which is then multiplied by the actual Maximum Depth Value to determine the highest quantity that is used for coloring. In this case, setting this Input to a value of 0 is treated as 0% and 0 is established as the highest and lowest quantity for coloring. Also in this case, setting this to a value greater than or equal to 100 will use the actual Maximum Depth Value as the highest quantity for coloring.
The purpose of this Input is to prevent very large values from desaturating the rest of the graph. For example, if you were viewing a graph where most quantity values are in the range of 100-500, but there are one or two quantities that are over 5000, then these large quantity values will stand out significantly while all of the other quantity values would be barely visible. With this Input, if it is set to a value of 500 or 600 (and the Value Type for Highest Quantity for Coloring is set to Actual Value) for example, then the large quantity values would not stand out as much, and the details of the rest of the graph would be more visible.
Value Type for Lowest Quantity For Coloring
This Input controls how the value entered in the Lowest Quantity for Coloring is interpreted. The available options are the following:
- Actual Value: This sets the value entered in the Lowest Quantity for Coloring Input as the actual Market Depth value that will be used as the lowest depth value for coloring purposes.
- Percentage of Maximum Depth: This sets the value entered in the Lowest Quantity for Coloring Input as a Percentage of the Maximum Depth which establishes the lowest depth value for coloring purposes.
It is important to note that when using the option Percentage of Maximum Depth this is the percentage of the Maximum Market Depth value based on the setting for the Determine Min and Max Levels from All Bars or Visible Bars Input. When Determine Min and Max Levels from All Bars or Visible Bars is set to Visible Bars then as scrolling through the chart, the lowest quantity for coloring, will be constantly changing as the Maximum Depth Value changes based on what is in view.
Lowest Quantity for Coloring
This value determines the lowest depth level that will be used for the Block Coloring Logic. Any Market Depth value that is less than or equal to the determined Lowest Quantity for Coloring is not displayed on the graph.
It is not possible to set a Lowest Quantity for Coloring that is equal to or greater than the Highest Quantity for Coloring. Therefore, when this Input is entered that would establish a Lowest Quantity for Coloring that is greater than or equal to the Highest Quantity for Coloring, then the Lowest Quantity for Coloring is set to be a value of 1 less than the Highest Quantity for Coloring and the number displayed for this Input is appropriately updated.
When the Input for Value Type for Lowest Quantity for Coloring is set to Actual Value then the value of this Input is used directly to set the lowest depth level that is used for coloring the blocks. In this case, setting this Input to a value of 0 means the lowest quantity is set by the actual Minimum Depth being used. Setting this value to any number less or equal to the actual Minimum Depth will have no effect.
When the Input for Value Type for Lowest Quantity for Coloring is set to Percentage of Maximum Depth then this Input is divided by 100 to determine a decimal percentage which is then multiplied by the actual Maximum Depth Value to determine the lowest quantity that is used for coloring. In this case, setting this Input to a value of 0 means the lowest quantity is set by the actual Minimum Depth being used.
Extend Last Known Depth
When this is set to Yes, the last known market depth quantities will be drawn to extend forward into chart columns where no actual depth quantities are known, up to the number of minutes defined in the Number of Minutes to Extend Last Known Depth Input.
This Input only has an effect when market depth data at a price level has been deleted or does not exist and there has not been a market depth update at that price level at subsequent chart bars.
When the depth data for the last bar or bars in the chart are not known, then this setting does not extend the last known depth to the end of the chart bars. In this case it is necessary to use the Display Market Depth Quantities After Last Bar setting.
Number of Minutes to Extend Last Known Depth (0 for All)
This Input controls how far forward the market depth data is extended forward when the input for Extend Last Known Depth is set to Yes. When this input is set to a value of 0, the data is extended as far forward as possible. Otherwise, it is only extended the number of minutes that are entered.
The extension of the market depth for any given bar is only performed when that bar is displayed and visible on the chart. When the bar is not visible, then the extended market depth data from that bar will also not be displayed. Therefore, there may still be areas of the chart in which the Market Depth Historical Graph does not display any depth information regardless of the value of this setting.
Show Quantity Numbers
This Input controls the display of the market depth quantities used for the colored blocks. The quantities are displayed within the colored blocks.
This Input has the following 4 options:
- None: No quantity values are displayed.
- In Bars Only: The quantities are only displayed in the price bars.
- In Bars and After Last Bar: If the Input Display Market Depth Quantities After Last Bar is set to Yes then the quantity numbers are displayed in the price bars as well as the extended last bar on the right side of the chart. If the Input Display Market Depth Quantities After Last Bar is set to No then the quantities are only displayed in the price bars.
- Only After Last Bar: If the Input Display Market Depth Quantities After Last Bar is set to Yes then the quantity numbers are only displayed in the extended last bar on the right side of the chart. If the Input Display Market Depth Quantities After Last Bar is set to No then no quantities are displayed.
If there is not enough space within the block to display the full number, the number will be clipped. This is something to be aware of. In this particular case you will need to increase the chart bar spacing.
You may want to change the color of the quantity numbers to make them more visible. To do this, set the Bid Quantity Numbers Color and the Ask Quantity Numbers Color Inputs to the colors that you want.
Bid Quantity Numbers Color
This is the color that is used for the displayed Bid quantity numbers when the Show Quantity Numbers Input is set to a value other than None.
Ask Quantity Numbers Color
This is the color that is used for the displayed Ask quantity numbers when the Show Quantity Numbers Input is set to a value other than None.
Use Secondary Numbers Color for Quantities Greater Than or Equal To
When this Input is set to a value other than zero and the Input for Show Quantity Numbers is set to a value other than None, then any Market Depth value that is greater than or equal to this Input will be colored the Secondary Numbers Color for Quantities Greater Than or Equal to.
Otherwise, if this Input is set to zero, then the quantity coloring is set by the Bid Quantity Numbers Color and Ask Quantity Numbers Color Inputs only.
Secondary Numbers Color for Quantities Greater Than or Equal To
This Input controls the coloring of Market Depth quantity values that are greater than or equal to the Input for Use Secondary Numbers Color for Quantities Greater Than or Equal To. The Input for Show Quantity Numbers also must be set to a value other than None to see the quantities displayed in the graph.
Display Market Depth Quantities After Last Bar
When this is set to Yes, the depth quantities for the last visible bar will be extended from the last bar to the right side of the chart, subject to the Percentage Of Fill Space To Display Market Depth Quantity Rectangles In Input. The depth values displayed are determined from the Input Depth Quantity Type to Display After Last Bar.
This column of blocks after the last bar which display the market depth quantities (when the Display Market Depth Last Quantities After Last Bar Input is set to Yes), will only update using market depth updates which have timestamps which are within the timeframe of the last bar. If the last bar is a variable timeframe bar, then they will only update using market depth updates with timestamps up to the timestamp of the last trade within that bar.
When a bar completes and before a new bar begins, the market depth data quantities displayed after the last bar, will not update until the new bar begins. This will cause them to appear delayed relative to the current market depth data displayed through other features displaying market depth like the Bid Size and Ask Size columns in the market data and trading columns on the right side of the chart, if enabled.
Depth Quantity Type to Display After Last Bar
This Input controls which data is displayed after the last bar when the Input Display Market Depth Last Quantities After Last Bar is set to Yes. This allows the depth data displayed after the last bar to display different information than what is in the last bar. The following options are available:
- Maximum Depth: This displays the maximum depth value obtained at each price level.
- Last Depth: This displays the last depth value at each price level.
Percentage Of Fill Space To Display Market Depth Quantity Rectangles In
For any depth quantities that are extended to the right side of the chart, such as from the Extend Last Known Depth or Display Market Depth Last Quantities After Last Bar Inputs, this Input controls how much of the fill space may be used for drawing those extensions.
A value of 0 means extensions will not enter the fill space, where as a value of 100 means extensions will fill all of the fill space. A value of 50 means extensions will fill into the left half of the fill space while the right half of the fill space remains untouched.
It is useful to set this to a value of less than 100 when Trade >> Draw DOM Graph on Chart is enabled.
Use Last Quantity Instead Of Max Quantity For Bars
This applies to price levels within bars where more than one depth quantity was recorded within the timeframe of the bar for that price level. When this Input is set to true, only the last quantity at the price level for the timeframe of the bar will be displayed, otherwise the maximum quantity at the price level within the timeframe of the bar will be displayed. This Input has no effect on the quantities that are displayed as extending beyond the end of a bar.
Determine Min and Max Levels from All Bars or Visible Bars
This Input controls how the Minimum and Maximum volumes that are used to determine the coloring of the Market Depth Historical Graph, are determined.
This Input has the following options:
- All Bars: When this option is selected, the Minimum and Maximum depth levels are determined from all bars in the chart that contain market depth data.
- Visible Bars: When this option is selected, the Minimum and Maximum depth levels are determined from the bars where the timeframe for those bars is within the visible portion of the screen. In other words, this setting is only dependent on the visible area from the left to the right of the screen and is not dependent on the top or bottom of the screen. Therefore, if market depth data is displayed above the top, or below the bottom of the visible area, but the bar is still within the visible timeframe, then those market depth levels are taken into consideration for the Maximum and Minimum values.
- Trading Day: When this option is selected, the Minimum and Maximum depth levels are determined for each trading day. The trading day is defined by the Session Times and starts at the Evening Session Start Time and ends at the Primary Session End Time. If an Evening Session is not being used, then the Primary Session Start and End Times are used.
- Day/Evening Sessions: When this option is selected, the Minimum and Maximum depth levels are determined for each trading session. Each trading session is defined by the Session Times where the Primary Session is determined separately from the Evening Session.
Font Size
This Input controls the size of the font that is used to display quantity values when the Input Show Quantity Numbers is set to anything other than None.
When this Input is set to a value of 0, the font size is set by the Chart Text font as defined in the Fonts and Text section of the Graphics Settings.
Maximum Levels to Display (0 for All)
This Input controls the total number of Market Depth levels that are displayed at each bar. The location of the levels is centered around the Last price of the bar.
Note that this is the total number of levels, including both Bid and Ask levels, not just the amount for one side.
Setting this Input to 0 will display all available Market Depth levels.
Combine Increment in Ticks
This Input controls the number of levels of Market Depth that are combined together to form a single new depth level.
The combination is done based on the number of ticks that are to be combined, with the result placed at the rounded price level for the combination.
The following image gives an example of how the combining is performed. In this example, the tick size is 0.25, and the Combine Increment in Ticks is set to 3.
Additional information on differences that can be seen between the Market Depth Historical Graph and other Market Depth values due to the Combine Increment in Ticks can be found in the Combine Increment in Ticks Additional Information section.
Automatic Combine Increment Adjustment Value
When this Input is set to a value of 5 or greater, and the chart scale is compressed (expanded) to a point within the range of the entered value, then the Market Depth Historical Graph data will be automatically combined (disjoined).
A smaller value will require the market depth data to be more closely spaced before they are combined (disjoined), whereas a larger value allows the market depth data to be larger before being combined (disjoined).
This Input works by actually adjusting the Combine Increment in Ticks Input and updates the Combine Increment In Ticks with the actual increment that is being used to join (disjoin) the data.
If the Combine Increment in Ticks is changed when the Automatic Combine Increment Adjustment Value is set to a value of 5 or greater, then the Market Depth Historical Data will change to the entered Combine Increment in Ticks and then will combine (disjoin) the data immediately based on the setting for Automatically Combine Increment Adjustment Value.
A value of 5 or greater is required in order to allow the Automatic Combine Increment in Ticks to function. Any value less than 5 will not combine the market depth data as the scaling is changed.
The actual value entered is the number of pixels on the screen, such that when the size of a data increment of the market depth data becomes smaller (larger) than this number of pixels, then it will combine (disjoin) the data. It is important to understand that although there is an internal methodology as to how it determines when to combine (disjoin), it is not meant for a user to calculate a specific value to be used. Rather, it is expected that the user will simply use this as a control to be tweaked to a value that works best for their circumstances.
When the chart scaling is set to Automatic, it is very likely that as scrolling through the chart, the market depth data will combine (disjoin) due to changes in the scaling of the chart.
Block Coloring Logic
Historical market depth quantities are shown on the chart as colored blocks. Each block represents a market depth quantity within a particular time frame and price level. These blocks are colored such that blocks with greater quantity within a given color range (Range n Max Ask/Bid Color) use a color that is closer to the corresponding color input. Blocks with lesser quantities within a given color range will appear faded toward the color of the background or to the color defined by the Range n Min Ask/Bid Color when the Input for Use Range Minimum Colors is set to Yes.
Blocks are colored relative to the minimum and maximum historical market depth quantities that are established by the Input for Determine Min and Max Levels from All Bars or Visible Bars. The maximum quantity is the greater of both the greatest Bid quantity and the greatest Ask quantity. The minimum quantity is the lesser of both the smallest Bid quantity and the smallest Ask quantity. Very often the minimum market depth value is not visible on the chart, as it is of the opposing depth type (for example, at a price of 2040.25 the Bid Depth is 50 and the Ask Depth is 2, the Bid Depth is displayed on the chart, but the Ask may be the minimum depth value).
If the Highest Quantity for Coloring Input is set to a value greater than zero, any historical market depth quantities that are greater than that value will be treated as equal to that value for the purposes of coloring. This Input value does not increase the maximum quantity value used for coloring if all visible historical market depth quantities are less than the Highest Quantity For Coloring.
The study has separate color Inputs for the Bid side and the Ask side. The color used for a particular block is determined by the side with the greater quantity at that particular price level and chart column. Either the Bid quantity or the Ask quantity will be used.
Intensities for the entire graph are calculated independent of side. If the greatest historical Bid quantity is greater than the greatest historical Ask quantity, the intensity of the greatest historical Ask quantity will be less than the intensity of the greatest historical Bid quantity. Setting the color Inputs for both sides to the same color will make the Bid and Ask sides indistinguishable.
For the block (or blocks) with a quantity that matches the maximum quantity, the exact Range 3 Max Color Input for the dominant side of that block is used. Quantities less than the maximum quantity within the color range are faded into the chart background color or to the Minimum Range Color if the Input for Use Range Minimum Colors is set to Yes.
For the block (or blocks) with a quantity that matches the minimum quantity (if visible), the color for that block will have an intensity equal to the Minimum Volume Intensity Percent Input. The only rare exception to this case is when the minimum quantity is equal to the maximum quantity, in which case the intensity will be 100%.
Intensity is the percentage of the dominant side Range Maximum Input color that is used over the chart background color (or Range Minimum Color if the Input for Use Range Minimum Colors is set to Yes). An intensity of 0% results in the chart background color (Range Minimum Color), and an intensity of 100% results in the exact Range Maximum Input color. An intensity of 50% is half way between the chart background color (Range Minimum Color) and Range Maximum Input color.
The color intensities for blocks with quantities between the lowest quantity and the highest quantity and within a particular color range correspond to a linear scale between the 0% and 100%. The use of a particular color range is determined by the values entered in the Percent Color Thresholds or Actual Color Thresholds depending on the setting for Use Percent or Actual Values for Threshold Levels.
Quantities of zero, if they need to be displayed, will use the same color as the chart background color (Range Minimum Color).
The following logic is used when determining a particular color:
- The range of the highest to lowest depth is determined. If the Highest Quantity for Coloring and the Lowest Quantity for Coloring are both set to 0 and their respective Value Types are both set to Actual Value then this is the highest depth value minus the lowest depth value of the respective bars in the chart. As noted above, the lowest depth value may not be displayed as it is most likely the non-dominant side.
If the Highest Quantity for Coloring is non-zero and is less than the Maximum Depth Value, then the value entered in the Highest Quantity for Coloring Input will be used as the highest depth value.
If the Lowest Quantity for Coloring is non-zero and is greater than the Minimum Depth Value, then the value entered in the Lowest Quantity for Coloring Input will be used as the lowest depth value. - The range of depth values is treated as a percentage ranging from 0% (lowest value) to 100% (highest value), and each depth value is evaluated to determine it's percentage position within the range.
- The choice of Bid or Ask is determined by which side is larger. For example, if the Ask is 243 and the Bid is 54, then the Depth at that Bar and Price will be the Ask at 243.
- When using the Actual Color Thresholds, the entered values are converted internally to percentages of the range of depth values in order to determine the appropriate coloring option. The percentage is determined by the following formula: Percentage = (Actual Color Threshold Value - Minimum Depth) / (Maximum Depth - Minimum Depth). This step is necessary in order to increase the speed of the Market Depth Historical Graph calculations by creating a mask of data that is used once, rather than continually recalculating the data.
Internally, the range of the masking data goes from 0 to 1000, but it is still possible that while using the Actual Color Thresholds with large depth numbers, that a particular depth will not change to the specific color level at the precise number, but will do so at a value within a few points of the entered number. For example, if the Actual Color Thresholds are entered as 5000, 15000, 25000, then it is possible that a depth value of 25001 will still be within the Range 2 colors and that it is not until a depth of 25003 that the color changes to Range 3. - The Range 0-3 Max/Min Ask/Bid Color to be used is determined by the Percentage or percentage equivalent of the Actual value of each depth value (as determined above) and where it falls into the range of values defined in the Percent Color Thresholds or the Actual Color Thresholds. The following determines which specific color range is used:
- If the Percentage is less than or equal to the lowest value in the Percent Color Thresholds or the Depth Value is less than or equal to the percentage equivalent of the lowest value in the Actual Color Thresholds when using the Actual Values, then the Range 0 Bid/Ask Color is used.
- If the Percentage is greater than the lowest value and less than or equal to the middle value in the Percent Color Thresholds or the Depth Value is greater than the percentage equivalent of the lowest value and less than or equal to the percentage equivalent of the middle value in the Actual Color Thresholds when using the Actual Values, then the Range 1 Bid/Ask Color is used.
- If the Percentage is greater than the middle value and less than or equal to the highest value in the Percent Color Thresholds or the Depth Value is greater than the percentage equivalent of the middle value and less than or equal to the percentage equivalent of the highest value in the Actual Color Thresholds when using the Actual Values, then the Range 2 Bid/Ask Color is used.
- If the Percentage is greater than the highest value in the Percent Color Thresholds or the Depth Value is greater than the percentage equivalent of the highest value in the Actual Color Thresholds when using the Actual Values, then the Range 3 Bid/Ask Color is used.
- Each color range is also treated as a percentage range from 0% to 100% (color percentage). A depth value is then converted to a percentage within the range of values within a specific Color range. The final color that is used is determined by a linear interpolation from the Input color to the Background color (or to the Range Minimum Color if the Input for Use Range Minimum Colors is set to Yes) based on this color percentage, where 100% is the entered Input color and 0% is the Background color (or the Range Minimum Color).
If the Minimum Volume Intensity Percent is non-zero, then any color that would be lower than this percentage value is not used in the calculation of the color percentage. This would mean that a Color Percentage of 0% would map to the color value that would be defined at the Minimum Volume Intensity Percent without this scaling.
Example 1 - Interpolation to Background Color with Percent Color Thresholds:
The following example uses only the Ask depths for simplicity. The data and Inputs are as follows:
- Maximum Depth Value: 1000
- Minimum Depth Value: 0
- Range 3 Max Ask Color: Grey (RGB values of 100, 100, 100)
- Background Color: Black (RGB values of 0, 0, 0)
- Highest Quantity for Coloring: 0
- Lowest Quantity for Coloring: 0
- Percent Color Thresholds: .25, .5, .75
- Minimum Volume Intensity Percent: 0
- Depth Value: 850
The following steps are used to calculate the specific color for this depth and price:
- Since the Depth Value is 850, and the range of data is 0 - 1000, the Range Percentage for this value is 0.85 (850 / (1000 - 0)).
- This Range Percentile is greater than the highest value in the Percent Color Thresholds, therefore the Range 3 Max Ask Color is the basis color for this depth value.
- Since the Minimum Volume Intensity Percent is zero, the full range of possible colors for this Color Range will be used. The low value of this color range is 750 (.75 * 1000) and the high value within this color range is 1000, therefore this Depth Value equates to a Color Percentage of 0.4 ((850 - 750) / (1000 - 750)).
- A linear interpolation of the entered color results in a grey color with RGB values of (40, 40, 40).
Example 2 - Interpolation to Range Minimum Color with Percent Color Thresholds:
The following example uses only the Ask depths for simplicity. The data and Inputs are as follows:
- Maximum Depth Value: 1000
- Minimum Depth Value: 0
- Range 3 Max Ask Color: Dark Blue (RGB values of 0, 0, 100)
- Range 3 Min Ask Color: Dark Red (RGB values of 100, 0, 0)
- Highest Quantity for Coloring: 0
- Lowest Quantity for Coloring: 0
- Percent Color Thresholds: .25, .5, .75
- Minimum Volume Intensity Percent: 0
- Depth Value: 850
The following steps are used to calculate the specific color for this depth and price:
- Since the Depth Value is 850, and the range of data is 0 - 1000, the Range Percentage for this value is 0.85 (850 / (1000 - 0)).
- This Range Percentile is greater than the highest value in the Percent Color Thresholds, therefore the Range 3 colors are used to determine the final color for this depth value.
- Since the Minimum Volume Intensity Percent is zero, the full range of possible colors for this Color Range will be used. The low value of this color range is 750 (.75 * 1000) and the high value within this color range is 1000, therefore this Depth Value equates to a Color Percentage of 0.4 ((850 - 750) / (1000 - 750)).
- A linear interpolation of the entered color results in a Burgundy color with RGB values of (40, 0, 40).
Example 3 - Interpolation to Range Minimum Color with Actual Color Thresholds:
The following example uses only the Ask depths for simplicity. The data and Inputs are as follows:
- Maximum Depth Value: 1000
- Minimum Depth Value: 0
- Range 3 Max Ask Color: Dark Blue (RGB values of 0, 0, 100)
- Range 3 Min Ask Color: Dark Red (RGB values of 100, 0, 0)
- Highest Quantity for Coloring: 0
- Lowest Quantity for Coloring: 0
- Actual Color Thresholds: 250, 500, 750
- Minimum Volume Intensity Percent: 0
- Depth Value: 850
The following steps are used to calculate the specific color for this depth and price:
- The Actual Color Thresholds are converted to percentage values based on the Minimum and Maximum Depth values. For the Actual Color Threshold of 250, the following calculation is used: Percentage = (250 - 0) / (1000 - 0). This results in Actual Color Thresholds as percentages of 0.25, 0.50, 0.75.
- Since the Depth Value is 850, and the range of data is 0 - 1000, the Range Percentage for this value is 0.85 (850 / (1000 - 0)).
- This Range Percentile is greater than the highest percentage value of the Actual Color Thresholds, therefore the Range 3 colors are used to determine the final color for this depth value.
- Since the Minimum Volume Intensity Percent is zero, the full range of possible colors for this Color Range will be used. The low value of this color range is 750 and the high value within this color range is 1000, therefore this Depth Value equates to a Color Percentage of 0.4 ((850 - 750) / (1000 - 750)).
- A linear interpolation of the entered color results in a Burgundy color with RGB values of (40, 0, 40).
Combine Increment in Ticks Additional Information
When the Input for Combine Increment in Ticks is set to a value other than 1, there are few changes that occur to the way the Market Depth Historical Graph is displayed. The following gives the information on why these may occur and how they are to be interpreted.
- Rounded Price Level: When using a Combine Increment in Ticks value other than 1, the resulting data is placed at the rounded price level for the given Tick Size and Combine Increment in Ticks. This rounded price level is the price at which the price can be divided by the Combined Tick Size with no remainder.
For example, given a tick size of 0.25 and a Combine Increment in Ticks value of 3, the summed depth values will be placed at price values of 0.75, 1.50, 2.25, ... 3099.75, 3100.50, 3101.25, etc.
This also means that the values that are summed together are those depth values that are surrounding the rounded depth, using a standard rounding mechanism. For example, at the new rounded price level of 3100.50, the depths at the following prices were summed together: 3100.25, 3100.50, 3100.75.
The following image shows this combination of the depths for the above scenario. - Best Bid/Best Ask Does Not Match DOM: When using a Combine Increment in Ticks value other than 1, the data is combined based on the rounding price value as described above. Although they are not displayed in the DOM, there are Bid Depth values above the current price and there are Ask Depth values below the current price. These values are included in the calculation of the combined market depth.
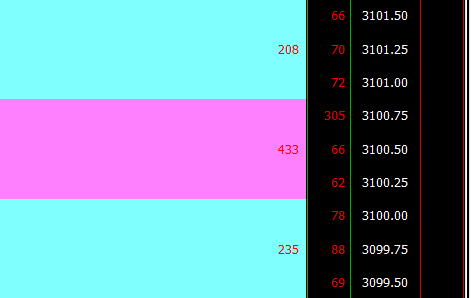
In the image below, both the Market Depth Historical Graph and the Chart DOM have been set to have a Combine Increment in Ticks to 2. As can be seen, there is a difference in the Bid Depth, which is showing as 59 in the Chart DOM and 61 in the Market Depth Historical Graph. This is because the Market Depth Historical Graph is including an additional depth of 2 that would be located at the price above the Best Bid.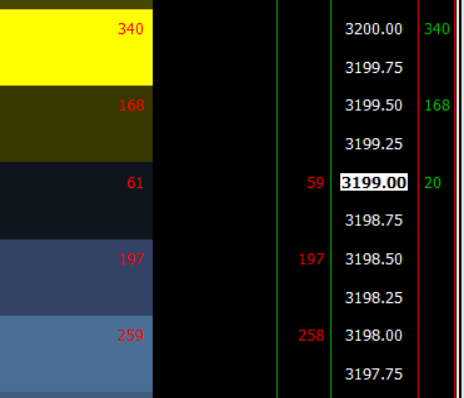
- Space at Top of Market Depth When Using Maximum Levels to Display and Combine Increment in Ticks: When using both the Maximum Levels to Display and the Combine Increment in Ticks there may be a space between the coloring of the Highest Priced Market Depth and the one below it. This is due to the number of depth levels at the top and bottom of the Market Depth Historical Graph being split by the Combine Increment in Ticks based on the actual price at any given time and how that relates to the Rounded Price Level (see above). Therefore, what is presented is the number of levels combined at the top, but then displayed at the rounded price for that level.
In the image below, the Market Depth of 133 is the sum of the 73 and 60 Ask Depths at prices of 3213.50 and 3213.75 respectivly. But the display of the combined depth is at the price of 3215.00 which is the rounded price level for the given Combine Increment in Ticks at that level. The thickness of the market depth bar at that level reflects the number of market depth levels that actually contributed to that bar (2 in this case).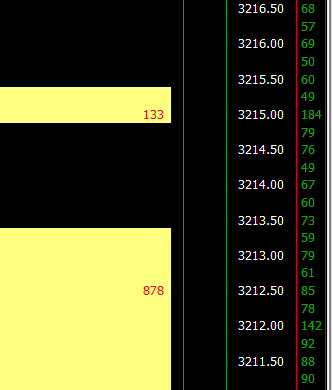
Market Depth Historical Graph Not Displaying
Follow through the instructions here to resolve a problem where the Market Depth Historical Graph study does not display any data, or not displaying any data at particular Date-Times in the chart.
The instructions here also apply to verifying there is historical market depth data for a particular period of time in the chart for the purpose of seeing if during a replay, market depth data will be replayed during that time range.
In this case, the chart must not be replaying and you will need to scroll the chart back in time to the point in time you want to do the replay for, to see if there is historical market depth data for that period of time.
This information also applies to verify there is historical market depth data which is used by the Bid and Ask Depth Bars study. If there is not any data displayed by the Market Depth Historical Graph study for the period of time you want to see data from the Bid and Ask Depth Bars study, then this is why you do not see data for that study.
- First, make sure your Sierra Chart Service Package is set to a Service Package that includes Advanced features. Otherwise, the Market Depth Historical Graph study will not display anything. It will be blank.
- Make sure to add the Market Depth Historical Graph study to the chart if it is not already. Refer to the Step by Step Instructions on this page.
- The Market Depth Historical Graph study can only be used on an Intraday chart. Not Historical Daily charts.
- To ensure there is market depth data from the particular Date-Time you want to see market depth data for in the chart, follow the Downloading of Historical Market Depth Datainstructions on this page. If this resolves the problem, then stop here.
- Reconnect to the data feed. Stop here if the problem is resolved.
- Verify market depth data is being received for the symbol. To do this, first connect to the data feed with File >> Connect to Data Feed.
Go to the chart and select File >> Open Market Depth Window. You should see multiple levels of market depth data. If not, that is where the problem is. You will need to contact your Data/Trading Service provider and make sure that market depth data is authorized for the symbols that you require market depth data for. Stop here if this is the problem.
This step is only applicable for viewing market depth data at the last bar in the chart and ensuring it will be recorded in the present time so it can be viewed historically.
If you want to view historical market depth data on the chart, then this step is not going to be applicable.
There are also settings which limit the amount of market depth data requested from the external data feed and displayed. For more information, refer to Not Receiving the Full Number of Market Depth Levels. - Select Chart >> Chart Settings >> Market Depth. Make sure the Maximum Market Depth Data Days to Load setting is set to the number of days from the last date in the chart, that you want to load market depth data for. This is particularly important during a chart replay, that it is set high enough to load market depth data back to the dates you will be replaying.
- Reset the defaults for the Market Depth Historical Graph study by opening the Study Settings window for the study (Analysis >> Studies >> [select study in Studies to Graph] >> Settings).
Press the Reset Defaults button. - Press OK.
- Press the Remove button on the Chart Studies window to remove the study.
- Add the Market Depth Historical Graph study again from the Studies Available list.
- Press OK. Stop here if the problem is resolved.
- If you see the Market Depth Historical Graph colored rectangles on the chart but no quantity numbers displayed within them, then make sure the Show Quantity Numbers Input for the Market Depth Historical Graph study is set as you require.
Also check the Quantity Numbers Color setting to make sure it is set to a visible color. To adjust Study Inputs, refer to Modifying Studies.
And increase the chart bars spacing to ensure there is sufficient width per chart column to display the quantity numbers. - Set the Lowest Quantity for Coloring Input with the Market Depth Historical Graph study to zero(0). To adjust Study Inputs, refer to Modifying Studies.
- If market depth data is not being displayed on only a portion of the chart (market depth data is displayed in some areas, but not in others), then this indicates that the market depth data is missing where you are not seeing it.
In this case, refer to Downloading of Historical Market Depth Data
If required, the last reported market depth quantities can be displayed from the chart bar which that occurred on, forward into the areas with missing data. To do this, set the Market Depth Historical Graph Input for Extend Last Known Depth to Yes. - Verify that there are data files present. Go to the \Data\MarketDepthData folder in the Sierra Chart installation folder on your system (usually C:\SierraChart), through your operating system file manager.
This folder contains all of the market depth data files. The file extension is .depth. The filename format is [symbol].[UTC date].depth.
The symbol of the market depth data file needs to match the symbol of the chart exactly.
The date on a market depth data file is the UTC date and covers a time span from 0:00:00 to 23:59:59 for that date in UTC time. If the file for a particular date does not exist, then there will be no data for that particular date in the chart.
If connected to the data feed and if receiving market depth data for a symbol, the market depth data file for the current date and for the symbol of the chart will be increasing in size. Periodically check the size of this file for confirmation that the data is actually being appended to the file. If not, then that is an indication of a problem.
Also, consider the fact that the market depth data file may only contain data for a portion of the date it is for. Or Sierra Chart may not have been connected to the data feed at all times during that date or the necessary settings to maintain historical market depth data for the symbol were not present all times. - If there are a large number of chart bars loaded in the chart, there could be a memory allocation error occurring which prevents any historical market depth data from displaying.
This error will display in the Window >> Message Log. The solution to this is to select Chart >> Chart Settings. Set the Days to Load setting to 1. Press OK. Example message:Failed to add to the depth data for [symbol], as a result of running out of memory. The depth data accounted for [memory usage]" of memory. Depth data will be unavailable until the chart can be reloaded.
For additional information for help with errors like this, refer to Out of Memory Condition.
Market Depth Data Time Stamping During Real Time Updates and Replays
For 100% accurate time stamping for market depth data, it is mandatory that you use the Denali Exchange Data Feed. This is the definitive solution to this problem described in this section. The Denali Exchange Data Feed does not use the local computer clock for time stamping and instead timestamps market data according to the exchange timestamps.
Additionally, in newer versions of Sierra Chart, both market depth data and trades, are time stamped to the millisecond. Therefore, it is important to be running a current version of Sierra Chart for the most precise time stamping.
During real-time chart updating and also during Chart Replays, a chart that uses the market depth data in some way like through the Market Depth Window or when using the Market Depth Historical Graph study, it is important to be aware of time stamping differences between the market depth data and trades which can cause the market depth data to be out of sync with the last trade prices within the price bars.
Depending upon the particular data feed being used, trades could be timestamped using the timestamp from the data feed and the market depth data could use the local computer clock timestamp. This will cause these two different data sets to be potentially out of sync when replaying a chart.
It also could be that the time stamping of the market depth data uses the timestamp from the data feed but market depth data timestamp is not completely accurate relative to the timestamp used for trades. Sierra Chart has no control over this.
There is not necessarily a perfect solution to this kind of problem. If the local computer clock is being used for time stamping, it is recommended that your computer's clock be set extremely accurately and synchronized multiple times an hour to a network time server. Refer to Incorrect Date and/or Time Display for further information.
If the particular Data or Trading service you are using supports time stamping using the local computer clock, then set Global Settings >> Data/Trade Service Settings Service Setting >> Timestamp Using Local Computer Clock to Yes/True to use the local computer clock, if this option is available for the Service you are using.
In some cases market depth data is always time stamped using the local computer clock depending upon the particular Data/Trading service being used.
Market Depth Historical Graph Timing in Relation to Chart Bar Date-Times
During real-time updating of a chart and chart replays there are rules related to loading and displaying of market depth data in relation to the latest/ending Date-Time in the last bar in the chart and whether the market depth data with Date-Times beyond this latest/ending Date-Time is loaded/displayed or not.
The following are the rules for this.
The following paragraphs use the term reference Date-Time. What this refers to is what is considered the latest Date-Time in the chart which is the Date-Time for which market depth updates that are beyond this Date-Time are not loaded.
This means that you can see current market depth quantity values, which are not immediately displayed in the last bar in the chart until such time that the reference Date-Time catches up to the Date-Time of the most recent market depth data. This may not be until a new chart bar begins.
During a chart replay, the reference Date-Time for market depth data will be based upon the current Date-Time of the replay whether or not the last bar in the chart includes that particular Date-Time. The current Date-Time during a chart replay depends upon the replay speed and the starting Date-Time of the replay, and the actual elapsed time.
When a chart is not replaying and the chart bars are based upon a fixed time, the reference Date-Time for market depth data is the ending time of the chart bar based upon its time duration whether or not that time has yet been encountered. So in other words in the case of a 5 minute chart bar, with the starting time of 12:00:00 the ending time will be 12:04:59.999999. A new bar does not begin until there is a new trade within the timeframe of that upcoming bar.
When a chart is not replaying and the chart bars are based upon a variable timeframe, Number of Trades, Volume, Range, Reversal, Renko, Delta Volume, Price Change, Point and Figure Bars, the reference Date-Time is the Date-Time of the last trade within that bar.
In all of these cases market depth activity beyond the reference Date-Time will not be displayed until a new chart bar is added to the chart which will only occur when there is a trade within the timeframe of that upcoming bar.
In no case, is market depth data ever missed or ignored. Once a chart bar is added to the chart and contains the Date-Time of market depth data received, then that chart bar will display that market depth data according to the Input settings of the Market Depth Historical Graph study.
If you want to see the market depth data updates on the chart bars in all cases immediately as they occur, it is necessary for there to be a chart bar that contains the timestamp of the market depth data updates. <
In order to have chart bars immediately appear as there are updates with market depth data, and not trades, it is necessary to use a Data Recording Mode suffix on the symbol. You need to use the -BID_ASK_TRADE_SYNC data recording suffix. There are others available as well.
This data recording suffix for the Market Depth Historical Graph is only supported with version 2393 or higher. You need to update to this version or higher for proper use of this recording suffix when using the Market Depth Historical Graph study.
In addition to this, it is necessary to set the Intraday Data Storage Time Unit to 1 Tick. This is essential.
There is no other solution to seeing market depth data updates immediately on the chart bars, other than what is explained in the paragraphs above.
Drawing of Depth Quantities at Price Levels on Chart Bars where there have been No Depth Updates
The maximum market depth quantity at a price level is only shown at the chart bar during the timeframe it occurred. For subsequent chart bars, if there has been no market depth update at that price level, but there have been updates at other price levels in that chart bar, then the last market depth quantity is displayed until it is deleted by the market depth data stream even if there has been no market depth update at that price level at a particular chart bar.
This is the standard functioning of the Market Depth Historical Graph study for price levels on chart bars where there have been no market depth updates but the prior depth levels have not been deleted by the data feed.
This is considered essential functioning of the study otherwise the Market Depth Historical Graph will have a broken appearance.
This occurs whether Extend Last Known Depth is set to Yes or No.
One thing you need to understand is that if Sierra Chart has lost the connection to the data feed and your computer has gone into a Sleep or Hibernate state and then comes out of that state hours or days later or whatever the timeframe is, the market depth levels at the last update still exist and can be extended forward until the time you get a connection to the data feed again by setting the Input Extend Last Known Depth to Yes.
This is why you must always disconnect Sierra Chart from the data feed to cause the current levels to be internally deleted before putting your computer to Sleep/Hibernate.
Improving Performance
To improve the drawing performance and therefore lower the CPU usage when using the Market Depth Historical Graph study, follow the below steps.
- Go to the chart and select Chart >> Chart Settings >> Display.
- Set the Chart Update Interval in Milliseconds to 1000 or higher.
- Press OK.
- Open the Study Settings window for the Market Depth Historical Graph study.
- Set the Show Quantity Numbers Input to None or Only After Last Bar.
- Set the Maximum Levels to Display Input to 20 or lower.
- Press OK to close the Study Settings window.
Downloading Of Historical Market Depth Data
Follow the instructions below to enable the downloading of historical market depth data from either the Denali Exchange Data Feed or the Delayed Exchange Data Feed.
Market depth data is maintained on Sierra Chart servers for a maximum of 180 days. Prior to that, the files are automatically deleted.
- Make sure you are running an up-to-date version of Sierra Chart. Refer to the Fast Update instructions.
- Unless you are specifically wanting to use the Delayed Exchange Data Feed, make sure Allow Support for Sierra Chart Data Feeds is enabled.
- Select Global Settings >> Sierra Chart Server Settings.
- Set the Support Downloading Historical Market Depth Data option to Yes.
- Set the Maximum Historical Market Depth Days to Download setting to the number of days you want to download. The larger the number, the longer it takes for market depth data to be downloaded. This setting only exists in newer versions. Make sure Sierra Chart is up-to-date.
- Press OK.
- When Sierra Chart is connected to the data feed and historical market depth data is required for a chart like when the Market Depth Historical Graph study is on the chart, then historical market depth data will be downloaded for the current symbol of the chart.
In the case of a Continuous Futures Contract chart, historical market depth data will not be downloaded, for prior futures contracts loaded in the chart. - There is the ability to re-download the historical market depth data from a particular Date-Time in the chart. You can add the command for that through Global Settings >> Customize Chart Shortcut Menu.
The name of the command is Download Depth Data from Date-Time. To use this command, right click on the chart at the point in time you want to start the market depth data download at, and select the command. This command only works to download market depth data for the current symbol of the chart.
To download historical market depth data for prior futures contracts symbols in a Continuous Futures Contract Chart, you will need to open a separate chart for those individual prior futures contracts and download historical Market Depth for each of them. - To view the historical market depth data, add the Market Depth Historical Graph study to the chart. Refer to Step by Step Instructions.
- If for some reason the downloaded market depth data is not displaying in the chart, then select Chart >> Reload and Recalculate to load it in, after the historical market depth data download is complete. You can monitor the progress of the data downloading through the Window >> Message Log.
- The amount of market depth data available depends upon the exchange. Market depth data for CME Group is maintained for 180 days. Market depth data from NASDAQ TotalView is maintained for 31 days.
Other Related Useful Studies
Below are some studies which you may find useful to use along with the Market Depth Historical Graph study.
*Last modified Friday, 14th July, 2023.