Home >> (Table of Contents) Supported Data and Trading Services >> Interactive Brokers Trading Service
Interactive Brokers Trading Service
- Introduction
- Notice: Sierra Chart Does Not Provide Support for Interactive Brokers Symbols or Data Issues
- What is Included
- Setup Instructions
- Setup Instructions: Resolving Connection Issue
- Interactive Brokers Symbol Formats and Common Symbols (Opens a new page)
- Market Data Not Subscribed Through Interactive Brokers
- Interactive Brokers Market Data Problems
- Automatically Logging Into TWS
- Running Multiple TWS Instances
- Using Multiple Sierra Chart Instances with TWS
- Market Depth Data
- Accessing Level 2 / Market Depth Data for Stocks
- About Interactive Brokers
- Using Financial Advisor Accounts
- Current Daily High and Low for Forex Data
- Trading Related Error Messages
- Trading Related Issues
- Interactive Brokers Historical Data Issues and Solutions
- Missing Data Due to Incorrect Time Zone Settings
- Interactive Brokers Market Data Error/Status Messages
- Interactive Brokers Historical Daily Data
- Time and Sales Window Data
- Orders Disappear after Being Submitted Although They Are Still Open
- Interactive Brokers Stop Order Trigger Method
- Procedure for Providing TWS Log Files
- Historical and Real-time Stock/Equities Data Volume Differences
- Using Sierra Chart Historical and Real-time Forex Data and Trade through Interactive Brokers Account
- Interactive Brokers Modification of Limit Price of Stop-Limit Orders
Introduction
Notice: Sierra Chart technically supports Interactive Brokers but no technical help is provided when using Interactive Brokers with Sierra Chart. It is fine to use Interactive Brokers if there are no other choices for what you are trading or based upon your country of residency. However, if you have technical issues, you need to be self-sufficient and rely upon this documentation for help and other documentation on the Sierra Chart website.
In regards to the above, if we become aware of an integration issue between Sierra Chart and Interactive Brokers Trader Workstation reported to us by a competent source, or that we are able to determine based upon a support request, we will in good faith resolve this to the best of our ability. However, 99.9% of reported problems are not integration issues but just due to a poorly designed and problematic API provided by Interactive Brokers.
Furthermore, technical integration to Interactive Brokers will always be maintained.
Sierra Chart works with the Interactive Brokers (Interactive Brokers) Trading service.
The Interactive Brokers trading service provides the Sierra Chart software with full access to complete trading services for all types of markets around the world.
The Sierra Chart trading interface fully supports trading with Interactive Brokers. To use Interactive Brokers with Sierra Chart, follow the Setup Instructions below.
Market data which includes historical Daily, historical Intraday data, and streaming real-time data is provided either by Interactive Brokers or the Real-time Exchange Data Feeds Available from Sierra Chart. If you are using one of the Sierra Chart provided data feeds, then Historical Daily Data comes from Sierra Chart sources when using Interactive Brokers for exchanges that Sierra Chart sources provide data for.
We only recommend the use of Interactive Brokers for experienced traders, those who are technically competent with computers and software, and are willing to accept technical issues. The large length of this page confirms the complexity and issues that you will definitely face when using Interactive Brokers. Interactive Brokers does provide many advantages and can be a good choice for many traders, but does have technical challenges as well.
Please do not blame Interactive Brokers problems on Sierra Chart or burden us with technical questions related to their problems or problems encountered when using them.
Even though you may see a particular problem in Sierra Chart when using Interactive Brokers and possibly do not see it in another program, still means the problem is on the Interactive Brokers side. The reason has to do with differences in the way that Sierra Chart may interact with the API, and other specific differing circumstances surrounding the particular interaction and request and response messages, which then results in particular problems encountered with TWS or Interactive Brokers which the other programs may not be encountering because the interaction and circumstances are different. Sierra Chart will interact with TWS in the most reliable and redundant way.
Support policy: Support from Sierra Chart for technical issues encountered when using Interactive Brokers, is within the discretion of Sierra Chart. There are some complex technical issues that a user may encounter when using Interactive Brokers, that can have various causes which are on the side of Interactive Brokers and therefore are outside of the control of Sierra Chart. Therefore these will be hard for us to understand and assist with because they are not within Sierra Chart and the Interactive Brokers system is a highly complex system with many reasons why things may not always work as expected.
Therefore, we will not hesitate to decline support for some issues reported to us involving Interactive Brokers. Be aware of this when making a decision as to whether you should be using Interactive Brokers. What we want to avoid is where you waste a significant amount of your own time because of Interactive Brokers issues and our time gets wasted as well and then you end up giving up. So consider this carefully because we do not want you to get into trouble with Interactive Brokers.
If you are trading CME, CBOT, NYMEX, COMEX futures, then as a matter of policy we do not provide any technical help for trading these futures through Interactive Brokers. We instead recommend using the Teton Order Routing Service for trading these futures markets. This service is supported by many clearing firms. Interactive Brokers is a very substandard and problematic system.
When using Sierra Chart for the first time you should not judge the performance of Sierra Chart using Interactive Brokers since it provides a substandard market data system. When evaluating the charting performance of Sierra Chart both historically and in real-time we recommend using the Sierra Chart Real Time and Historical Forex and CFD Data Service which is provided with all Service Packages.
This may not be the best introduction for a Trading service, but it is absolutely necessary all of this is communicated upfront.
It must be stressed that the integration that Sierra Chart has to the Interactive Brokers Trader Workstation API is superb and of the best engineering. Sierra Chart Engineering has very very high standards, we are perfectionists, and continuously strive towards perfection and top-quality and perfect code. We do not think anyone else has better integration to the TWS API than Sierra Chart does. Based on user feedback, this is confirmed. Sierra Chart uses a direct connection to the TWS socket and there is no use of any external DLL component. It is rocksolid integration but if the TWS or Interactive Brokers system has an issue or due to the complexities of those Interactive Brokers systems, there can potentially be a problem.
Notice: Sierra Chart Does Not Provide Support for Interactive Brokers Symbols or Data Issues
Interactive Brokers symbology is very complicated, and there is not one set text string for a symbol that can be looked up, and used universally within TWS and Sierra Chart. This is a major design flaw with Interactive Brokers.
Instead there are multiple parts of a complex Contract structure which have to be filled out in order to get a match to a particular instrument or security for market data or trading. Some of these fields are optional. All of the documented Symbol Formats allow you to specify each required and optional part of the Contract structure for the particular security type (each part is separated by a hyphen '-' character). So you do have full control over the symbol Contract parts being specified to TWS.
For symbols that are not listed in Sierra Chart, determining exactly what symbol is going to be correct, we do not know and it is not something we can help with. However, you do have full control over specifying the different parts of the Contract structure through the Sierra Chart specified symbol formats for each security type.
Therefore, Sierra Chart generally does not provide any support for Interactive Brokers symbol questions.
Additionally when Sierra Chart is requesting historical data from Interactive Brokers TWS, there is a separate request for each block of data. You can look in the Window >> Message Log and see these requests and the responses from TWS. To increase the amount of historical data downloaded directly from Interactive Brokers in the case where the historical data is only coming from Interactive Brokers, refer to Downloading More Days of Historical Data Directly from Interactive Brokers.
To change the particular type of data whether trades or the Bid and Ask average which is requested from TWS, refer to Data Recording Modes.
So you do have full control and monitoring of historical data requests to Interactive Brokers TWS from within Sierra Chart. You can redo the download by going to the chart and selecting Edit >> Delete All Data and Download. If you are not getting the historical data that you expect, once again we cannot provide any help with this. It is simply out of our control and knowledge.
Additionally, Sierra Chart provides no technical support at all for any historical or real-time market data received from Interactive Brokers Trader Workstation. Therefore, even if you get the symbol correct you may not receive any historical or real-time data, or incomplete historical data is received, or not as much historical data as you want is received. Whatever the cause of these problems, there is no support provided by Sierra Chart Support.
For reliable market data we recommend using the Real-time Data feeds Available from Sierra Chart. These data feeds we provide technical support for.
Finally, if you think that Sierra Chart should be providing support for the above and we have referred you to this section, then we would recommend discontinuing the use of Interactive Brokers with Sierra Chart if you are unable to resolve the problem yourself with the help of Interactive Brokers technical support.
What is Included
- Streaming Real-Time Data: Yes.
- Historical Intraday Data: Yes. Limited amount from Interactive Brokers. It is strongly recommended to use the Sierra Chart Real-time Data Feeds for complete and reliable data when using Interactive Brokers.
- Historical Daily Data: Yes. 1 year if from Interactive Brokers. Historical Daily data for major futures contract, cash index and US stock symbols is provided by the Sierra Chart Historical Data service when using one of the Sierra Chart Real-time Data Feeds. In this case 10+ years are available.
- Historical BidVolume and AskVolume: No from Interactive Brokers. Yes when using the Sierra Chart Real-time Data Feeds.
- Live Trading Services: Yes.
- Simulated Trading: Yes.
- Order Types Supported: All.
- Server Managed OCO (Order Cancels Order): Yes when Global Settings >> General Trade Settings >> Use Server Side OCO Orders is enabled.
- Server Managed Bracket Orders: Yes when Global Settings >> General Trade Settings >> Use Server Side Bracket Orders is enabled.
However, we have heard that it is not possible to modify the child Target and Stop orders before the parent order fills. For a solution to this in the case where you are trading futures, is to use the Teton Order Routing Service or disable the Use Server Side Bracket Orders option. - Automated Trading (applies to Live or Simulated): Yes.
- Supports Negative Offset for Stop-Limit Orders: Yes.
- Supports Account Balance Data from TWS: No. There are too many issues and questions with this data and Sierra Chart has no interest in the associated support.
Amount of Historical Data Available: For historical data downloaded from Interactive Brokers directly and not when using the Sierra Chart Real-time Data Feeds, Interactive Brokers provides 1 year of Historical Daily and a very limited amount of historical Intraday data.
Sierra Chart will always download the full 1 year of Historical Daily data for Historical charts. For Intraday charts, it is not very practical to download a large amount of historical Intraday data all at once from Interactive Brokers. Normally the download will fail and it will take a very long before it completes. Downloading 30 days is more practical. The instructions below explain how to specify the number of historical Intraday days to download.
Setup Instructions
If you are having a problem connecting to the Interactive Brokers Trading service, then be sure to follow through all of the steps below.
- To use the Interactive Brokers trading service, you need an account with Interactive Brokers. Go to the Interactive Brokers website and open an account with them if you do not already have one.
It is possible to use an Interactive Brokers demo account. At the Interactive Brokers Login window from Trader Workstation, there is a way to log into a demo account associated with your email address. This should only be used for test purposes though. - Run the Interactive Brokers Trader Workstation (TWS) software or the Interactive Brokers Gateway program. The Gateway is also acceptable to use and everywhere there is a reference to TWS in this documentation, that is acceptable to substitute with the IB Gateway. It is highly recommended that you use the stand alone TWS software when using TWS, rather than the browser based TWS. Or use the IB Gateway.
- Select File >> Global Configuration on the Interactive Brokers TWS software menu. Or go to the equivalent in the IB Gateway software.
- Go to API >> Settings.
- Enable the Enable ActiveX and Socket Clients option.
- Set the Socket Port to 7496.
- Disable the Read-only API option.
- Make sure the Component Exchange Separator setting is set to a /.
- If you will be running Sierra Chart and Trader Workstation on the same computer, then enable Allow connections from localhost only. If they will be on different computers, you would need to add the local IP Address of the computer that will be running Sierra Chart within the Trusted IPs list.
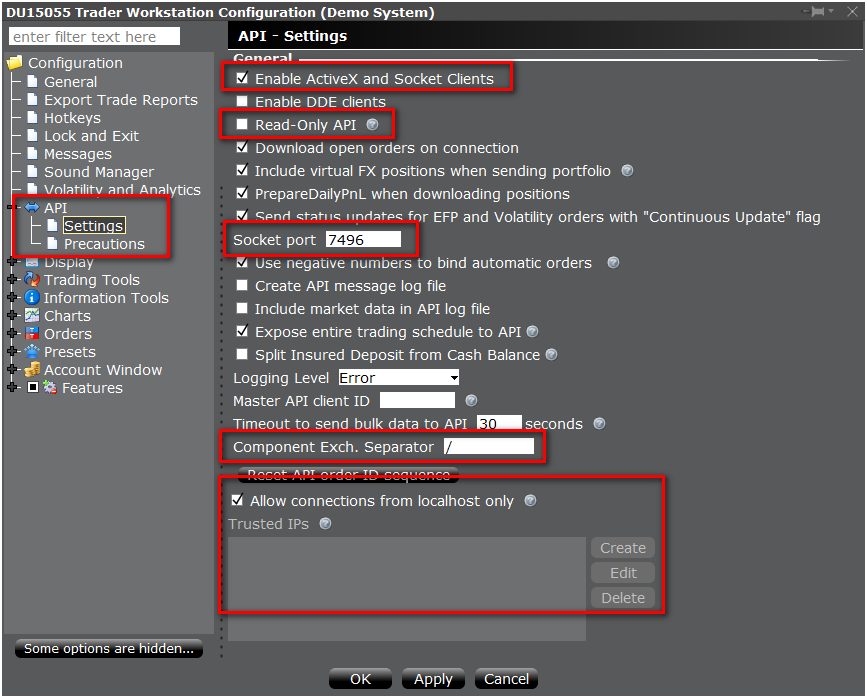
- Go to API >> Precautions in the TWS Configuration window.
- It is essential that you enable Bypass Order Precautions for API Orders.
- Press OK to save the Interactive Brokers API settings.
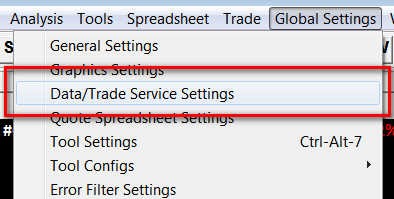
- Go to Sierra Chart. Select Global Settings >> Data/Trade Service Settings on the menu.
- Click on the Service list box arrow. Select Interactive Brokers from the list.
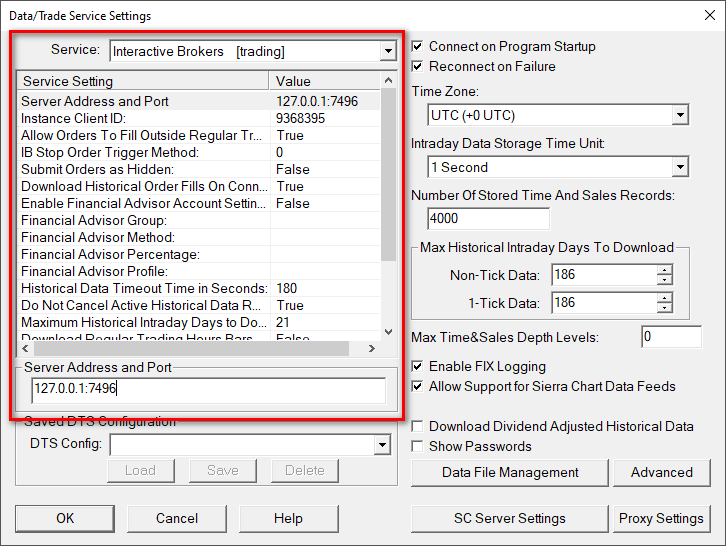
- Select the Service Setting >> Server Address and Port setting. It needs to be set to 127.0.0.1:7496. If the TWS software is running on a computer different than Sierra Chart, then the Server Address can be set to the IP address where TWS is running.
- Enable the Connect On Program Startup option.
- Enable the Reconnect On Failure option.
- For the downloading of historical data to work correctly, your computer's Date and Time need to be set correctly. The last Date and Time in the chart also needs to be correct for that bar. Otherwise, some or all of the data received from Interactive Brokers may be filtered out.
If you have problems with historical data, like pacing violations, refer to Interactive Brokers Historical Data Issues and Solutions. - Multiple Concurrent Connections to TWS: To have multiple copies of Sierra Chart connected to Interactive Brokers Trader Workstation (TWS), then each copy of Sierra Chart needs to be set to a different Instance Client ID number, set with the Service Setting >> Instance Client ID setting in the Global Settings >> Data/Trade Service Settings window. You can use any of the listed Instance Client ID numbers. It does not matter. You only need to be certain that each copy of Sierra Chart uses a different Instance Client ID number.
This Instance Client ID number is given to TWS when Sierra Chart connects to TWS. - Accessing All Trade Orders from TWS [link]: If you want to have access to all trade orders entered from TWS as well as orders entered from Sierra Chart, then you will need to set the Global Settings >> Data/Trade Service Settings >> Service Setting >> Instance Client ID setting to 0. After changing this particular setting, reconnect to the data feed.
- Set the Time Zone setting to the time zone that you want times displayed in.
- Set the Intraday Data Storage Time Unit to what you require.
- Set the Service Setting >> Default Currency Code to the currency code that will be specified with stock symbols when a currency code or exchange is not specified with the symbol. This currency code will be used in cases where the exchange is automatically set to SMART.
- Press OK to close the Data/Trade Service Settings window.
- Uncheck the Global Settings >> General Trade Settings >> Use Server Side OCO Orders | Use Server Side Bracket Orders options if you want to have Sierra Chart provide the OCO and Bracket order management rather than relying upon what Interactive Brokers provides.
The Interactive Brokers provided bracket order functionality may not work well. Therefore, we recommend keeping these options disabled.
However, for the ultimate safety, you may want to enable these options and rely on the Interactive Brokers functionality because if you lose connectivity to Interactive Brokers, then Sierra Chart cannot properly manage OCO orders. - Make sure TWS is running. To connect to the data and trading server, select File >> Connect to Data Feed on the menu.
- Resolving Connection Issue [link]: If the Window >> Message Log window opens and displays messages indicating there was an error connecting to TWS, then perform the following steps:
- Select File >> Disconnect to prevent further connection attempts.
- Restart TWS (Interactive Brokers Trader Workstation) and make certain TWS is running. It should be running on the same computer where Sierra Chart is installed to.
- Select Global Settings >> Data/Trade Service Settings to review the Service Settings.
- Carefully review the Setup Instructions above again to be certain all of the settings are correct.
- If the Message Log displays the following message when attempting to connect to Trader Workstation:
Message from IB: Unable connect as the client id is already in use. Retry with a unique client id. IB Error Code: 326. Request ID: -1.Then set the Service Setting >> Instance Client ID to a different number. This will solve the problem.
- Make sure the Global Settings >> Data/Trade Service Settings >> Server in Sierra Chart is set to 127.0.0.1:[port number]. The port number can be any port number and further information about this is below.
- Be sure to follow the step above to add a Trusted IP Address in the TWS API settings (step 9).
- Disable any firewall software you are running. The built-in operating system firewall can be kept enabled, but you may want to try disabling it as well or make sure it is not blocking TWS or the specified Socket Port.
- If one of the messages in the Message Log says Failed to connect to the data and trade server. Winsock error: (10061) No connection could be made because the target machine actively refused it., then try using a different socket port. To change the socket port, select Global Settings >> Data/Trade Service Settings.
In the Server Address and Port box enter 127.0.0.1:7497 (You can use any port number. The port number is after the colon and in this case is 7497).
In Interactive Brokers TWS, select Edit >> Global Configuration >> API >> Settings >> Socket Port and enter 7497 (use the same port number you have set in Sierra Chart). - Try connecting to the Data and Trading server again in Sierra Chart by selecting File >> Connect to Data Feed on the menu.
- If there still is an error connecting, then review help topic 1.5.
- To open a Historical Chart, an Intraday Chart or a Trading DOM, select File >> Find Symbol on the menu. Locate the symbol in the lists and press the appropriate button. Stock symbols are not listed and have to be manually entered.
If you do not see the symbol listed that you want to use, refer to the Interactive Brokers Symbols page to determine the proper symbol format and manually type the properly formatted symbol into the Selected Symbol box on the Find Symbol window and then open a chart or Trade DOM.
In the case of stock symbols, some of them will require the format which specifies both the exchange and primary exchange. This is true in the case of MSFT and many other symbols. Refer to Interactive Brokers Stock Symbol Format.
You can also yourself add symbols which will be listed in the Find Symbol window, through the Global Symbol Settings. - Symbol Limits: Interactive Brokers may limit the number of symbols you can receive data on at the same time. This limit may be increased based on your trading volume.
If you encounter this limit, then refer to Reducing Number of Symbols Being Tracked. - Historical Order Fills: Upon a connection to the Interactive Brokers Trader Workstation, Sierra Chart will request 10 days of historical order fills for all of the accounts available on the logged in instance of Trader Workstation. This is to insert any missing order fills into the Sierra Chart Trade Activity Log for trade reporting. However, you may not receive 10 days of historical order fills upon the connection. If you do not, then open the Trade Log in Trader Workstation (TWS) and while the Trade Log is displayed, reconnect to TWS from Sierra Chart by selecting Disconnect and Connect to Data Feed on the File menu.
To receive historical order fills, you also need to have Global Settings >> Data/Trade Service Settings >> Service Setting >> Download Historical Order Fills on Connect set to True. - If you require EUREX data, it is important to refer to EUREX Historical and Real-time Data.
- Continue with step number 3 on the Getting Started documentation page.
Market Data Not Subscribed Through Interactive Brokers
In order to receive market data for charts and quote lines within Sierra Chart, it is necessary you are subscribed to the exchange that the Symbol is listed on. If market data is not subscribed, you will see error messages similar to the following in the Sierra Chart Message Log and you will not receive historical and/or real-time data for the symbol:
In this case you will need to contact Interactive Brokers and subscribe to market data from the particular exchanges mentioned in these messages.
After this is done, restart Trader Workstation. Sierra Chart will establish a new connection and you should then receive market data.
Interactive Brokers Market Data Problems
There are a wide array of issues you will and can potentially have with Interactive Brokers market data. They are as follows:
- Missing historical data (moderately common)
- Slow historical data downloading (common)
- Real-time data not updating (uncommon)
- Incomplete price and volume data ( Completely normal and routine. Happens all the time.)
- Confusing and complex symbology which can change from time to time (moderately common)
- No real-time data (Moderately common and depends upon symbol. In particular CFD symbols.)
- Inaccurate Bid Volume and Ask Volume which will affect studies which depend upon these which includes the Cumulative Delta Bars studies (100% occurrence all the time).
These issues will be solved by using either of the Real-Time Exchange Data Feeds Available from Sierra Chart which integrates with Interactive Brokers trading services. Not all of the exchanges Interactive Brokers supports, do the Sierra Chart Data Feeds provide data for, but they do cover the most common ones.
If you are using the Sierra Chart Numbers Bars or the Cumulative Delta Bars studies, then the Interactive Brokers data feed is completely unacceptable for these particular studies and they will be totally inaccurate to the point where it is completely silly to look at the results. Instead, for accuracy, you must use one of the Real-Time Exchange Data Feeds Available from Sierra Chart rather than the Interactive Brokers data feed and provide these studies accurate data.
Running Multiple TWS Instances
This section is relevant if you want to run multiple TWS instances when you have two or more Interactive Brokers accounts that you wish to use at the same time. If you simply want to connect multiple copies of Sierra Chart to a single TWS instance, then you only need to configure each copy of Sierra Chart to work with Interactive Brokers and connect them to the single copy of TWS that is running. In this case, follow the Setup Instructions above for each copy of Sierra Chart.
It is possible to use multiple TWS (Interactive Brokers Trader Workstation) instances and have multiple copies of Sierra Chart using those instances. For example, you can have two instances of TWS running and have two copies of Sierra Chart also running where one is connected to one instance and the other one to the other instance.
The way this is accomplished is by using different port numbers for each TWS instance.
Select Edit >> Global Configuration >> API >> Settings from the Interactive Brokers TWS software menu. Set a different Port number for each TWS instance.
You need to use the same Port number in the Sierra Chart copy that will be connected to that instance. To set the port number in Sierra Chart, select Global Settings >> Data/Trade Service Settings.
In the Server Address and Port box change the number after the colon ":". This is the port number. Example: 127.0.0.1:7494
Using Multiple Sierra Chart Instances with TWS
This section discusses connecting multiple Sierra Chart copies/installations to Trader Workstation.
To have multiple copies of Sierra Chart connected to Interactive Brokers Trader Workstation (TWS), each copy of Sierra Chart needs to be set to a different Instance Client ID number, set with the Instance Client ID setting in the Service Settings section of the Global Settings >> Data/Trade Service Settings window.
You can use any of the listed Instance Client ID numbers except for 0 which should only be used if you want to access all orders submitted from any copy of Sierra Chart or TWS, in the other instances of Sierra Chart.
Normally you will not want to use 0 unless you have a special requirement for that. If you do use 0 for the Instance Client ID, only one instance of Sierra Chart can use 0. If you are not using 0 for the Instance Client ID , each copy of Sierra Chart will need to use a different Instance Client ID number.
This Instance Client ID number is given to TWS when Sierra Chart connects to TWS.
When each copy of Sierra Chart is connected to TWS, the orders submitted from a particular copy of Sierra Chart are separate from other copies of Sierra Chart. When an order fills, only that fill execution will be sent to the copy of Sierra Chart that submitted that order. This keeps trading from different copies of Sierra Chart isolated from each other. Although they will share Common Trade Position data for each Symbol and Trade Account.
If you want to have each copy of Sierra Chart report a different Position for the same Symbol and Trade Account for trading you are doing from that particular copy of Sierra Chart, then it is necessary to use the Order Fill Calculated Trade Positions. This can be set for individual charts/ Trading DOMs or globally.
To keep trading isolated from each copy of Sierra Chart, you may also want to disable Global Settings >> Data/Trade Service Settings >> Service Settings >> Download Historical Order Fills on Connect.
Market Depth Data
There are several features in Sierra Chart which require market depth data. These include the chart DOM, when it has the Bid Size and Ask Size columns (Trade >> Customize Chart/Trade DOM Columns), the Trade >> Draw DOM Graph On Chartfeature, and other features.
When using any of these features that require market depth, the market depth updates will be automatically started for the symbol of the chart.
There may be a limit on the number of symbols that can receive market depth data from Interactive Brokers at a time. This is an Interactive Brokers limitation. If such a limitation is encountered, you will not get market depth beyond the best Bid and Ask on the additional symbols.
After you reduce the use of market depth features to a smaller number of charts, then reconnect to the data feed with File >> Disconnect and File >> Connect to Data Feed.
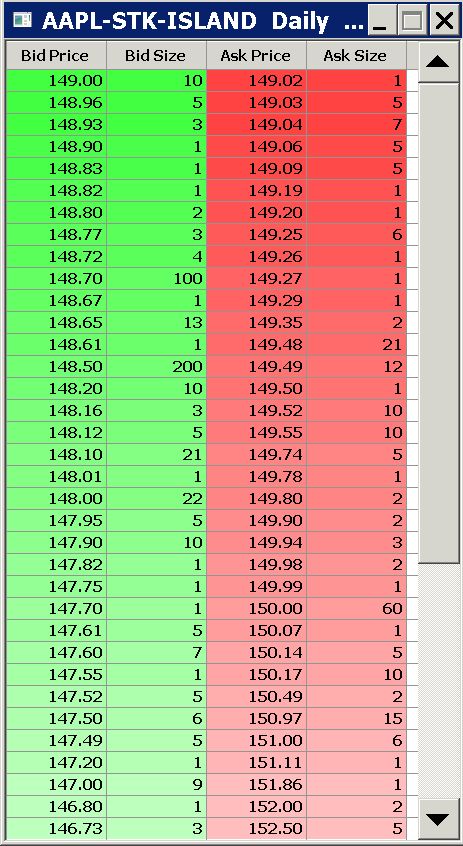
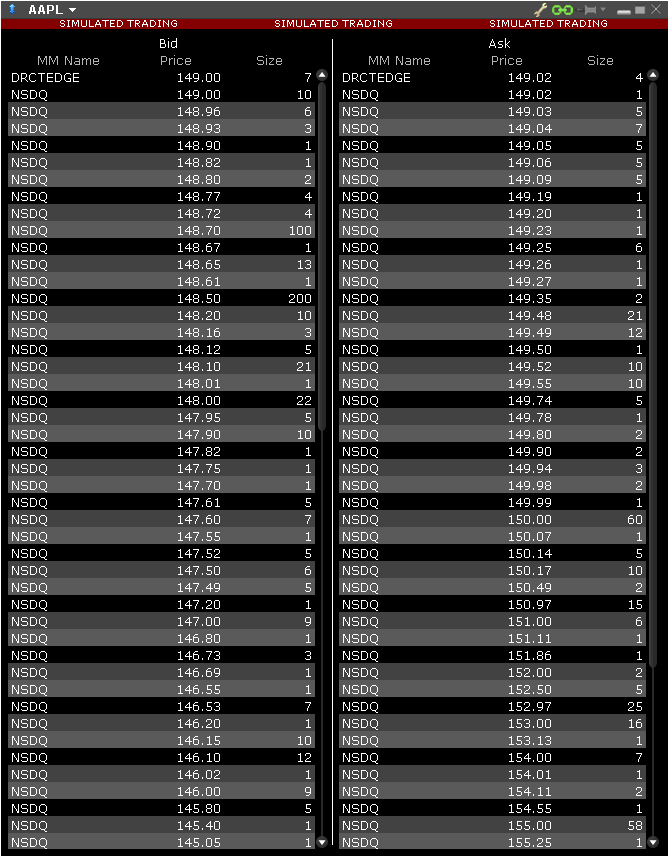
Accessing Level 2 / Market Depth Data for Stocks
To access Level 2 data for stocks in Sierra-Chart when connected to Interactive Brokers Trader Workstation, it is necessary that the symbol the chart is set to specifies the specific exchange code the symbol trades on. You cannot use SMART for the exchange code.
Refer to the stock symbol format.
For example, if the symbol trades on ISLAND, then you can use ISLAND if that exchange is supported for the symbol. Refer to the images below for an example.
About Interactive Brokers
Interactive Brokers, a global electronic brokerage firm, provides professional traders, financial advisors, Brokers and institutions low cost execution and clearing services for stocks, options, futures, forex, and bonds. For Interactive Broker's current commissions and information, visit the Interactive Brokers Commissions page. The Interactive Brokers Universal Account allows customers to trade stocks, options, futures, forex, and bonds on over 50 market centers in 14 countries from a single account.
Using Financial Advisor Accounts
Below is information about using an Interactive Brokers Financial Advisor account with Sierra Chart. Other than the information here, Sierra Chart support does not provide any support for these types of accounts.
The functionality is provided as is and you have to evaluate whether the functionality is useful and whether it works properly for you. Due to the interface provided by Interactive Brokers for Financial Advisor accounts, Sierra Chart cannot have reliable integration to these types of accounts. Sierra Chart can submit orders to a Financial Advisor account, but the tracking of Orders and Trade Positions cannot be regarded as reliable.
Sierra Chart supports using an Interactive Brokers Financial Advisor account. You are able to submit orders from Sierra Chart to your Financial Advisor account.
To configure Sierra Chart for this, select Global Settings >> Data/Trade Service Settings.
Enable the Service Setting >> Enable Financial Advisor Account Settings for Trading option. Fill in the Service Setting >> Financial Advisor Group/Method/Percentage/Profile fields as you require.
These fields are provided exactly as you have specified, with all orders submitted from Sierra Chart to TWS (Trader Workstation).
To disable the use of the Financial Advisor account functionality, disable the Service Setting >> Enable Financial Advisor Account Settings for Trading option.
The specific text or values to use for the Financial Advisor Group/Method/Percentage/Profile fields are beyond the scope of this document and of Sierra Chart support. Consult with Interactive Brokers documentation and their support department.
The following are the list of the fields that are submitted with orders when using a Financial Advisor Account:
- Group
- Method
- Percentage
- Profile
When using a Financial Advisor account, most likely you will need to rely upon the Sierra Chart calculated Trade Position data instead of the Trade Position data provided by Interactive Brokers because there may not be Trade Position data for the particular Trade Account you have selected to trade from within Sierra Chart. To do this, refer to the Using Order Fill Calculated Positions documentation.
Based on user feedback, when using a Financial Advisor account you may want to disable Global Settings >> Data/Trade Service Settings >> Service Setting >> Download Historical Order Fills on Connect.
Current Daily High and Low for Forex Data
The current daily High and Low data for the IDEALPRO Forex markets from Interactive Brokers on the real-time data feed may not represent the High and Low for the current date, but instead from a prior day.
This will be most obvious in a Historical Daily chart. To avoid this issue in a Historical Daily chart, go to that chart and select Chart >> Chart Settings >> Chart Data and disable Allow Real-Time Updating of Historical Chart.
This is an Interactive Brokers issue and we have no control over it. Avoid contacting Sierra Chart support about this.
A similar issue can also happen with other Interactive Brokers symbols where the low price may be wrong. In this case also disable Allow Real-time Updating of Historical Chart as explained above.
Trading Related Error Messages
The following are common error messages that you may see reported in the Trade >> Trade Service Log , when making trades through Interactive Brokers from Sierra Chart and their meanings.
- Order Event Warning:Attribute 'Outside Regular Trading Hours' is ignored based on the order type and destination. PlaceOrder is now being processed. Error Code: 2109. : This message means that the order will be immediately processed and submitted into the market even if the current time is outside of the Regular Trading Hours for the market.
- Notice: An overfill UpdateOrder call has occurred.: This error message will occur when using an Interactive Brokers Financial Advisor account. It is harmless. While Sierra Chart does have some support for Financial Advisor accounts. Due to the inherent complexity of these types of accounts, Sierra Chart cannot handle all aspects of them perfectly. The reason this occurs is that when you submit an order in a Financial Advisor account, that account may be configured to submit the order into more than one subaccount. Therefore, there is going to be more than one fill reported for the order. These additional fills are from the sub accounts.
- Message from IB: API client has been unsubscribed from account data. IB Error Code: 2100.: This message means that the Trade Position data updates have been unsubscribed. It is normal to see this message because Sierra Chart has to unsubscribe and resubscribe to the Trade Position data updates in order to force an update of Trade Position data and when there are multiple trading accounts a user may have. Interactive Brokers has a very poorly designed API when it comes to providing Trade Position data updates.
Trading Related Issues
When using Interactive Brokers you could potentially encounter any of the following trading related issues:
- Canceled order stays in a Pending Cancel state.
- Submitted order stays in an Order Sent state. This usually happens when the symbol itself is not fully specified according to TWS requirements. For example, some stock symbols require a much more complete specification rather than the simple three or four letter stock symbol.
- Submitted and accepted order disappears from chart even though it is still working.
- Current Trade Position is not displayed on chart, Trade Window, or on the Trade >> Trade Positions Window. For information about this issue and possible solutions, refer to Trade Position Line or Quantity Disappearing or Displaying Zero.
- A filled order remains in an Open state on the chart.
- A Trade Position Quantity displayed in Sierra Chart does not update and is displaying a wrong Position Quantity. This can also be a problem if you are using the Order Fill Calculated Position in Sierra Chart.
- A request for Open orders from TWS does not provide the actual open orders and then the orders in Sierra Chart are put into a locally canceled state since they are determined to not exist. The orders are not actually canceled though.
There are various causes of these issues. From the perspective of Sierra Chart, the general cause is that Interactive Brokers does not provide the necessary order data feedback to maintain a proper state of an order, uses inconsistent symbols, or does not provide the necessary Trade Position data feedback for Positions.
If you encounter one of these problems, then you will need to contact Interactive Brokers technical support for help with these. They will need to review your Trader Workstation log file. They may not be able to help you with these kinds of issues. Therefore, please consider carefully whether using Sierra Chart with Interactive Brokers is appropriate.
You could also encounter a condition where a submitted order gets rejected and the Status goes to Error for reasons which are not apparent and not stated by the Trader Workstation API. You will need to contact Interactive Brokers about this.
Order Not Transmitted
When an order is submitted from Sierra Chart to Trader Workstation, it is always flagged to be transmitted by Trader Workstation. There never is any other possibility.
Therefore, if you see an order in Trader Workstation submitted by Sierra Chart with a "Transmit" button next to it, then this means that Trader Workstation is set to not transmit the order automatically. Contact Interactive Brokers support for help with this.
Orders Entered from Trader Workstation do Not Appear in Sierra Chart
When an order is submitted from Trader Workstation, in order for it to appear within Sierra Chart, it is necessary that Global Settings >> Data/Trade Service Settings >> Service Setting >> Instance Client ID be set to 0.
After changing this particular setting reconnect to the data feed.
However, there can be a difference with the Symbol between a chart and the Symbol in the Trade >> Trade Orders Window which will cause both order fills and working orders not to appear in a chart or Trade DOM.
This is due to the very complex and inconsistent symbology from Interactive Brokers.
Orders Not Responded to from Trader Workstation
If you submit an order from Sierra Chart and Trader Workstation does not respond to it, the Trade >> Trade Activity Log Order Action Source field for the order will indicate Trading server did not acknowledge new order, then you need to contact Interactive Brokers about this and give them the exact date, time and time zone of the order submission.
They will need to check the TWS Log to see what the problem is. Sierra Chart is not able to know what the issue is in this case.
Trade Position Line or Quantity Disappearing or Displaying Zero
If you are an Interactive Brokers user, and you do not see the Trade Position for a particular Symbol and Trade Account listed on the Trade >> Trade Positions Window when the Trade Position actually exists for a particular Symbol and Trade Account, or the Position Quantity is incorrect, or the Position is displayed temporarily and disappears on a chart, then this section explains why this can happen.
There are two reasons why these issues can happen. One reason is that TWS did not send the position update to Sierra Chart.
The other reason is that the symbol of the position as it exists in Trade >> Trade Positions Window is different to the symbol in the chart. If you are using the Trade and Current Quote Symbol in the chart, you need to compare the symbol in the Trade Positions Window to this particular symbol. Otherwise, compared to the main symbol of the chart.
On the Trade >> Trade Positions Window tab which displays the Positions, you will see Quantity and Service Position Quantity fields. Normally these will match but could be different for up to 8 seconds. If the Service Position Quantity remains at 0 when there is actually a nonzero Trade Position for a particular Symbol and Trade Account, then the Trader Workstation is not transmitting any Trade Position data to Sierra Chart.
For more information about this subject in general, refer to Incorrectly Reported Trade Position Quantity.
Also refer to Symbol Differences for Positions.
Another solution is to use the Order Fill Calculated Position. Although with this method you must be very diligent to make sure you have all of the order fills for the Symbol and Trade Account being traded.
Sierra Chart development and support cannot solve these numerous problems from Interactive Brokers.
Symbol Differences for Positions
Interactive Brokers has inconsistent and complex symbology specifications. It is the position of Sierra Chart, that this is a major fault of the Interactive Brokers system. There is also the problem where it is possible to use SMART order routing but a Trade Position update will specify the specific exchange the symbol was filled on and this creates an inconsistency.
Therefore, based upon the security type, sometimes it is not possible to match up the symbol provided with a Trade Position update from Interactive Brokers to the symbol of the chart which can be different but essentially the same symbol. You can see the symbols received from the Position updates in Trade >> Trade Positions Window.
Therefore, when looking at the symbols on the Trade Positions Window, you may see a slightly different symbol as compared to the chart. You may also see two symbols listed for the same security. This can be a problem and could potentially be the source of the problem where you do not see the current Position Quantity on a Chart or Trade DOM.
Set the Trade and Current Quote Symbol Chart Setting for the chart to use the same symbol you see on the Trade Positions Window in order to see the Position on the chart.
In the case when trading US equities/stocks, you will want to set the main Symbol of the chart to the simple stock symbol (for example SPY). And set the Trade and Current Quote Symbol Chart Setting for the chart to use the same symbol you see on the Trade Positions Window in order to see the Position on the chart.
Regarding the prior paragraph, to automatically have a particular Trade and Quote Symbol set in the Chart Settings for a Symbol, then add that Symbol (referring to the main Symbol of the chart, not the Trade symbol) to the Global Symbol Settings if it is not already listed there. And set the Trade and Quote Symbol setting to the particular Trade and Quote Symbol you want to use for that Symbol. In this case the Trade and Quote Symbol will automatically be set in the Chart >> Chart Settings window when the symbol of the chart is changed to that Symbol.
Also, due to the complex design of the TWS API, you may see the Symbol for a particular Trade Position display as a number only on the Trade Positions Window. This should only be for a short period of time. Less than about 10 seconds.
Another solution to solve the problem of not seeing your current Trade Position for the symbol displayed on the chart due to symbol differences, is to use the Order Fill Calculated Position. Although with this method you must be very diligent to make sure you have all of the order fills for the Symbol and Trade Account being traded.
Recent Review of TWS Not Providing Trade Position Data
Recently, back sometime in 2016, there was a very detailed review performed in the case where Trader Workstation was not providing any Trade Position updates related to order fills and when the Trade Position in general changes for a symbol.
The TWS log files were examined and showed that Sierra Chart did request Position and Account updates. However, TWS just simply was not sending Position updates any time there was an order fill. This was confirmed by Interactive Broker Technical support as well.
They recommended that we delay the starting of Position and Account updates after connecting to Trader Workstation and they indicated that the delay only needed to be about half a second. As is standard procedure, Sierra Chart always waits 5 seconds before the requesting and starting of Account updates. So even with this long of a delay, it has been shown in many instances, that TWS simply just will not process the Account updates and fails to send any Trade Position updates when they should be sent as they occur.
And in any case, there should not be a reason for any delay. If TWS for whatever reason cannot handle the Account updates request immediately, it just has to remember the request and process it when it can.
Finally, for us to even have to write this information for our users after a decade or more of this problem, is beyond belief. And even if in the rare hypothetical case, we have made some kind of mistake with the requesting or processing of Trade Position data in relation to the TWS API, the very fact that we cannot even get this right after more than 15 years, shows just how poorly designed the TWS API is. Do you see this documentation written for any other supported Trading service? Of course you do not since they do not have this kind of problem.
We want to make it clear though, that we ourselves have not experienced the problem of not receiving Trade Position updates from Trader Workstation through a demo account. It consistently has worked properly. And we estimate the incidence rate of this problem, is less than 5% based on user feedback.
Interactive Brokers Historical Data Issues and Solutions
General Information
When using Interactive Brokers, the required historical chart data is downloaded either entirely from Interactive Brokers or from Sierra Chart Real-time Data Feeds. It is either completely from one or the other source.
You can experience many problems when this historical data is downloaded from the Interactive Brokers system. The Interactive Brokers historical data system is not always reliable and works as you would expect. This historical data is also called backfill.
You may experience a problem where the Interactive Brokers backfill system does respond, but does not give you data and this is known as a pacing violation or possibly the data is just not available. For information about pacing violations, refer to the Pacing Violations section.
You may experience a problem where historical data is not downloaded at all because the Interactive Brokers historical data system does not respond resulting in both a delay with chart updating and missing data. This is called a Timeout and how to deal with it is explained in the No Response When Downloading Historical Data and Timeouts section.
Avoid making postings on our Support Board about the possibility that the problems are with Sierra Chart. They are not, unless Interactive Brokers has made changes to their historical data system that require us to make changes. Also, do not assume that just because you see a problem with one Sierra Chart version and not in another, that somehow it is a Sierra Chart problem. The problem is simply intermittent and what you see is simply coincidental, or the relevant settings are different.
Interactive Brokers is a broker and not a data provider. Review the information in this section about historical data issues from Interactive Brokers. We have done our best to handle the limitations of Interactive Brokers data, however you still will encounter issues.
If you require very reliable and complete historical and real-time data, then the very best choice is to use one of the Real-Time Exchange Data Feeds Available from Sierra Chart which is fully integrated with Interactive Brokers trading.
Although you may see a chart in TWS and you may not get a chart in Sierra Chart, does not at all imply there is something wrong with Sierra Chart. Their API simply is not delivering the data being requested for various reliability and technical reasons such as differences with request parameters.
Sierra Chart also employs special methods to filter out bad data to ensure reliable charts. It is for this reason (although very unlikely in almost all cases) that you may not see data in Sierra Chart compared with other programs.
Pacing Violations
Interactive Brokers has limits on the amount of historical data you can download during a short period of time. In the Sierra Chart Message Log opened with Window>> Message Log, you may see messages that contain the words pacing violation.
This message is from Interactive Brokers and it indicates the limit has been exceeded. There are several different pacing violation rules that Interactive Brokers has. If you get this error, it means you have violated one of their rules. When you get this error, there are some things you can do to minimize it. Follow these instructions:
- Select Global Settings >> Intraday File Update List and remove any symbols that are expired or you are no longer interested in, from that list.
- Close any charts you have open in open chartbooks for expired futures contracts, so there is not any unnecessary downloading. Interactive Brokers will still give you a pacing violation for historical data requests that return no data.
- Select File >> Data/Trade Service Settings >> Main Settings.
- In the list of Service specific settings, set the Service Setting >> Maximum Historical Intraday Days to Download Limit to 15 days or less. The higher this number is set to, the longer historical data will take to download.. You must keep it to a small number to minimize pacing violations and avoid a long time to download historical data.
- Enable Allow Support for Sierra Chart Data Feeds to use Sierra Chart Historical Data for major futures contract symbols and US stock symbols for Intraday charts. Sierra Chart Service Package 3 or higher is required for this. Data for Historical Daily charts for major futures contract symbols, major index symbols, and US stocks symbols, will always be downloaded from the Sierra Chart Historical Data service if on Service Package 3 or higher.
- Press OK.
- Select File >> Disconnect and wait a few minutes for the pacing violation condition to be removed by Interactive Brokers.
- Select File >> Connect to Data Feed
- In the case of Intraday charts, follow the Retrying the Download When There is Data in the Chart instructions to re-download the data in the chart to recover missing data.
- In the case of Historical Daily charts, follow the instructions in Help Topic 6.3 to re-download the data in the chart to recover missing data.
No Response When Downloading Historical Data and Timeouts
This section explains some things you can do to handle a problem where Interactive Brokers Trader Workstation (TWS) does not respond to historical data requests. Eventually this leads to the historical data request timing out and results in missing data in the chart. In the Sierra Chart Message Log, you will see a phrase that says The download timed out in a line for the Historical data requests.
The first thing that you should do is to make certain that you have the minimum amount of charts open and that the symbols of all of those charts are valid and current Interactive Brokers symbols. If you are using an incorrect symbol, then potentially this can lead to this problem. After you have closed some charts for symbols that you do not need or with invalid or expired symbols, then it is necessary to reconnect to the data and trade server by selecting File >> Disconnect and then File >> Connect to Data Feed.
Make sure the Historical Data Timeout Time In Minutes in Global Settings >> Data / Trade Service Settings is set to a reasonable time. We recommend 3 minutes.
When you see your charts say Waiting to Download or Downloading Historical Data, and there is no response for a while, then restart Interactive Brokers Trader Workstation (TWS). Be sure you do this within 3 minutes (default) before the timeout occurs. After restarting TWS, Sierra Chart will then reconnect to TWS.
When a download timeout does occur, the historical data download will fail for the symbol currently having historical data downloaded and all the other symbols will have the download canceled for them. This occurs if Cancel Active Backfill Requests on Timeout in Global Settings >> Data / Trade Service Settings is checked. If it is unchecked, then the remaining symbols will not have their pending downloads canceled and the historical data downloads will continue. However, this may be an excessively long time if the Interactive Brokers system does not respond, which is the reason why we recommend keeping that option enabled.
If you are missing historical data in your charts, refer to the Retrying Downloading of Intraday Data section and help topic number 6.3 for instructions to retry the download for Intraday and Historical charts respectively.
Slow Historical Data Downloading
Downloading historical data from Interactive Brokers is a slow process to avoid Pacing Violations. Also the Interactive Brokers system may respond slowly to historical data requests.
If you see Waiting to Download or Downloading Historical Data. Bars may not appear until done. displayed on a chart or charts for an extended time, then follow these instructions:
- Follow the instructions to Use the Sierra Chart Historical Data Service.
- Go to each chart you have open in each of the open Chartbooks and make sure the symbol of it is a valid and actively trading symbol. If it is not a valid symbol, then close the chart by selecting File >> Close Active Window.
The easiest way to go through all of the charts in all of the open Chartbooks is to use Window >> Windows and Chartbooks. - Select Global Settings >> Data/Trade Service Settings.
- In the list of settings on the left, set the Service Setting >> Maximum Historical Intraday Days to Download Limit to 15 days or less.
- Set Service Setting >> Download 5 Seconds Historical Intraday Data to False.
- Press OK.
- Select File >> Disconnect.
- Select File >> Connect to Data Feed.
Using Sierra Chart Historical Data
When using Interactive Brokers, in order for the historical data in a chart to come from the Sierra Chart Historical Data servers which provide very fast and reliable historical data, it is necessary to use the Denali Exchange Data Feed.
Follow the instructions below to use Sierra Chart provided historical data in your charts for supported symbols.
- Go to the Denali Exchange Data Feed page and read through the information and follow the set up instructions on that page for the exchange or exchanges you want to use. Not all exchanges are supported but the most common ones are.
- Follow the instructions to Update the Symbol Settings. This is an important step to ensure Sierra Chart has the correct Symbol Settings to route data requests to the Denali Exchange Data Feed.
- Select File >> Disconnect.
- Select File >> Connect to Data Feed.
- Open a chart through File >> Find Symbol. In the case of futures contracts, you must use one of the listed symbols to use the historical and real-time data provided by the Denali Exchange Data Feed. Not all of the listed symbols support this data feed. However, if the futures symbol is not listed, then definitely the symbol does not support using the Denali Exchange Data feed.
If the symbol in an existing futures contract chart is not using one of the symbols listed in File >> Find Symbol , then to change the symbol follow the Changing the Symbol of a Chart instructions. - Retry downloading the Intraday chart data again. To do this, go to the Intraday chart and select Edit >> Delete All Data and Download. This only needs to be done once per symbol. For further details, refer to the Retrying the Download When There is Data in the Chart section.
Downloading More Days of Historical Data Directly from Interactive Brokers
Follow the instructions below to download more historical Intraday data from Interactive Brokers for symbols where historical data is obtained only from Interactive Brokers rather than the Sierra Chart Historical Data Service.
- Select Global Settings >> Data/Trade Service Settings >> Main Settings.
- Increase the Service Setting >> Maximum Historical Intraday Days to Download Limit setting to a reasonable number. The higher this number is set, the longer historical data will take to download.
- Press OK.
- Re-download the data in the Intraday chart by selecting Edit >> Delete All Data and Download. This only needs to be done once per symbol.
Support Policy Regarding Interactive Brokers Historical Data
Depending upon the symbol and your Sierra Chart service package, historical data may come partially from the Sierra Chart Historical Data Service and partially from the Interactive Brokers historical data system. Or fully from the Interactive Brokers historical data system.
In the case where data is partially coming from the Interactive Brokers data system, usually this is only about 10 to 15 minutes of data. The majority of data will come from the Sierra Chart Historical Data Service.
Only data for major futures contracts, US stocks and some index symbols comes from the Sierra Chart Historical Data service.
If you are encountering a historical data problem involving data from the Interactive Brokers historical data system and you have received at least 15 days of current historical Intraday data or 6 months of historical Daily data, then as a matter of policy Sierra Chart support will not provide any help for the problem you are having.
There are several choices you have in this particular case. Use one of the Real-Time Exchange Data Feeds Available from Sierra Chart if it provides data for the particular symbol you are having Interactive Brokers market data problems with. Live with the problem. Use another supported Trading service. Or discontinue use of Sierra Chart.
Also keep in mind that only major futures contracts have Continuous Futures Contract Rollover rules defined for them. Therefore, the Continuous Futures Contract Chart feature will not work with all futures markets unless the rollover rules are defined for them.
Missing Data Due to Incorrect Time Zone Settings
If you find that you are consistently missing historical data from your charts or the timestamps of chart bars are not correct, then you may have incorrect Time Zone settings. You need to have the correct Time Zone setting in Sierra Chart and in the operating system. It is also imperative that your computer's clock is accurately set. For complete information, refer to help topic 38.
Interactive Brokers Market Data Error/Status Messages
Data Feed Messages from Interactive Brokers with error codes 2104, 2106, 2107 displayed in the Sierra Chart Message Log indicate the status of market data connections to their servers. They are informational messages from Interactive Brokers. Below are examples of these messages and descriptions.
Message from Interactive Brokers: Market data farm connection is broken:usfuture. Interactive Brokers Error Code: 2103. Request ID: -1. (This message indicates the connection to the US future market data farm is broken.)
Message from Interactive Brokers: Market data farm connection is OK:usfuture. Interactive Brokers Error Code: 2104. Request ID: -1. (This message indicates the connection to the US future market data farm is now OK. If this message follows the message above, then the connection is now OK.)
Message from Interactive Brokers: Market data farm connection is inactive but should be available upon demand.usfarm.us. Interactive Brokers Error Code: 2108. Request ID: -1.
Interactive Brokers Historical Daily Data
In Sierra Chart, you have the option of downloading historical Daily data from Interactive Brokers as 24 hour bars or regular trading session only bars.
However, this option will not work when the symbol is mapped to the Sierra Chart Historical Data Service. The data from that service will always contain the full 24 hour of trading for each Daily bar unless the symbol is a stock.
To change the setting to download regular trading hours Daily bars, select Global Settings >> Data/Trade Service Settings on the menu. If the option Service Setting >> Download Regular Trading Hours Bars (Daily Bars Only) is set to True, Sierra Chart will only request the regular trading hours Daily bar data.
Otherwise, a request for the standard 24-hour Daily bar data will be made.
If you made a change to the Download Regular Trading Hours Bars (Daily Bars Only) setting, then you need to re-download the data in the Historical Daily charts to get the regular trading hours bars. You need to do this only once for each symbol. To do this go to a Historical Daily chart and select Edit >> Delete All Data and Download. This only needs to be done once for each symbol.
Time and Sales Window Data
The data that you see for a symbol in the Time and Sales window when using Interactive Brokers consists of 2 categories of data.
The first category of data are normal Interactive Brokers trade messages for a symbol. There is no assurance that this data is complete from Interactive Brokers and we cannot help with it.
The second category of data is trades which are inserted by Sierra Chart in order to make the volume for chart bars match the total Daily Volume for the symbol. This is documented in the Simulate Trades to Match Daily Volume section.
If Sierra Chart support has referred you to this section, please do not ask us further about discrepancies. We cannot help with them. And please do not use the argument that you do not see the problem in another program. Such a statement is not relevant due to the limitations of the Interactive Brokers substandard data feed. We explain the origin of the data above. You are welcome to use whatever program that meets your requirements.
One solution to the problem is to use one of the Real-Time Exchange Data Feeds Available from Sierra Chart instead of the substandard Interactive Brokers data feed.
Orders Disappear after Being Submitted Although They Are Still Open
In the case when you submit an order from a chart or Trade DOM and the order disappears within about 10 seconds after being submitted, even though the order is still working and has not yet been filled, follow this procedure for help with this:
- For the order that disappears, locate the order in the Trade >> Trade Orders Window. Get the Service Order ID for it.
- Send an email to API@interactivebrokers.com and ask them why when a reqOpenOrders call is made through the API, why is there not a response for the order ID ( tell Interactive Brokers the ID you got from the Service Order ID field in Sierra Chart). The fact that there is no response indicates the order is no longer open.
- Interactive Brokers may need to see your TWS log file. They will give you instructions on how to provide that.
Interactive Brokers Stop Order Trigger Method
It is possible to specify how Interactive Brokers Simulated Stop and Stop-Limit orders are triggered. This setting can be changed in Global Settings >> Data/Trade Service Settings >> Interactive Brokers Stop Order Trigger Method.
Changing this setting has no effect upon Stop orders entered directly from TWS.
The valid values are as follows:
- 0 = The default value. The "double bid/ask" function will be used for orders for OTC stocks and US options. All other orders will used the "last" function.
- 1 = use "double bid/ask" function, where stop orders are triggered based on two consecutive bid or ask prices.
- 2 = "last" function, where stop orders are triggered based on the last price.
- 3 = double last function.
- 4 = bid/ask function.
- 7 = last or bid/ask function.
- 8 = mid-point function.
Procedure for Providing TWS Log Files
Follow the instructions below which are based on instructions from Interactive Brokers to provide the Trader Workstation (TWS) log files.
- In TWS, navigate to Edit > Global Configuration > Settings > API > Settings.
- Then within Setting change the Logging Level to Detail.
- Check the box Create API message log file and hit Apply and OK.
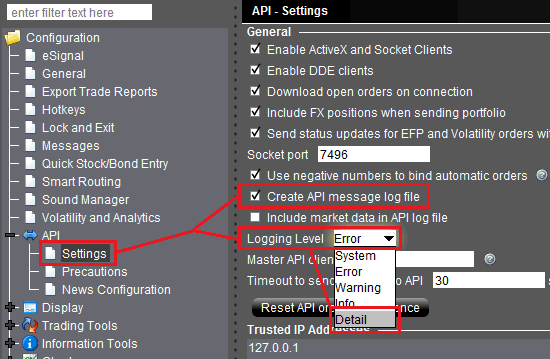
- Once the logging levels have been adjusted please restart TWS.
- Now that the adjustments has been made, replicate the issue again.
- Send by email to Interactive Brokers support a copy of both the TWS and API Log file attached as well as details the specific issue encountered. Both log files are located within C:\JTS folder and it is named log.Day.txt (TWS Log File) and api.clientId.Day.Log (API Log File).
Historical and Real-time Stock/Equities Data Volume Differences
As of approximately version 2033, the information in this particular section is no longer applicable. The volume data downloaded from Interactive Brokers for stock/equities symbols is now actual with this version and higher.
Update with Help >> Download Current Version.
To re-download the data in your Intraday charts to get the correct historical volume data, go to the chart and select Edit >> Delete All Data and Download.
Update: There was a problem with the historical volume data not getting multiplied by the specified multiplier in the TWS contract data in a version after 2033 but this has been resolved in version 2062 and higher. Make sure you are running version 2062 or higher.
The Volume field for all trades received from Interactive Brokers TWS, is multiplied by the volume multiplier value from the security definition data from Interactive Brokers for the symbol.
Also be aware of the Simulate Trades to Match Daily Volume setting.
Using Sierra Chart Historical and Real-time Forex Data and Trade through Interactive Brokers Account
Follow the instructions below to use the Sierra Chart Historical and Real-time Forex Data and send trade orders to your Interactive Brokers account.
The real-time data which updates the chart will be from the Sierra Chart Forex data feed. The real-time data which updates the last trade price box on the chart and the current Bid and Ask data will come from Interactive Brokers Trader Workstation.
This way you will always see the accurate current pricing from IB but have the chart bars based upon a better data feed.
- Follow the Setup Instructions on this page to connect Sierra Chart to your Interactive Brokers account. Skip this step if this has already been done.
- Select File >> Find Symbol.
- In the Find Symbol window expand the Forex - FXCM list. Not the IB Forex (For Trading) list.
- Select the particular Forex symbol that you want to chart and trade and open a chart for it by pressing the Open Intraday Chart or Open Historical Chart button.
- Select Chart >> Chart Settings >> Symbol.
- Select the Trade and Current Quote Symbol field. It should then be in edit mode.
- Press the Find button beside the Trade and Current Quote Symbol edit box.
- Expand the IB Forex (For Trading) list. Choose the corresponding Interactive Brokers symbol. For example: CAD.JPY-CASH-IDEALPRO corresponds to CADJPY.
- Press OK.
- Press OK to close the Chart Settings window.
- When you submit orders from the chart, they will use the Interactive Brokers symbol specified in the Trade and Current Quote Symbol edit box.
Interactive Brokers Modification of Limit Price of Stop-Limit Orders
When submitting a Stop-Limit order from Sierra Chart, and you find that the Limit price of that order no longer has an offset to the Stop price matching the offset that you specified when the order was submitted, then this means that it was modified by Interactive Brokers.
We cannot provide any help with this condition. If you have been referred to this section, then you need to contact Interactive Brokers about this or consider using another supported Trading service other than Interactive Brokers.
*Last modified Thursday, 12th June, 2025.