Home >> (Table of Contents) Help/Frequently Asked Questions >> Help topic 2: Data and Chart Display Errors
Data Errors or Spikes in Charts, Flat or Flat Line Graph, Compressed Graph, Errors with Date/Time Values
Introduction
Below is an example of a chart data error which causes a flat or compressed graph. This error causes the the chart to display incorrectly and be compressed.
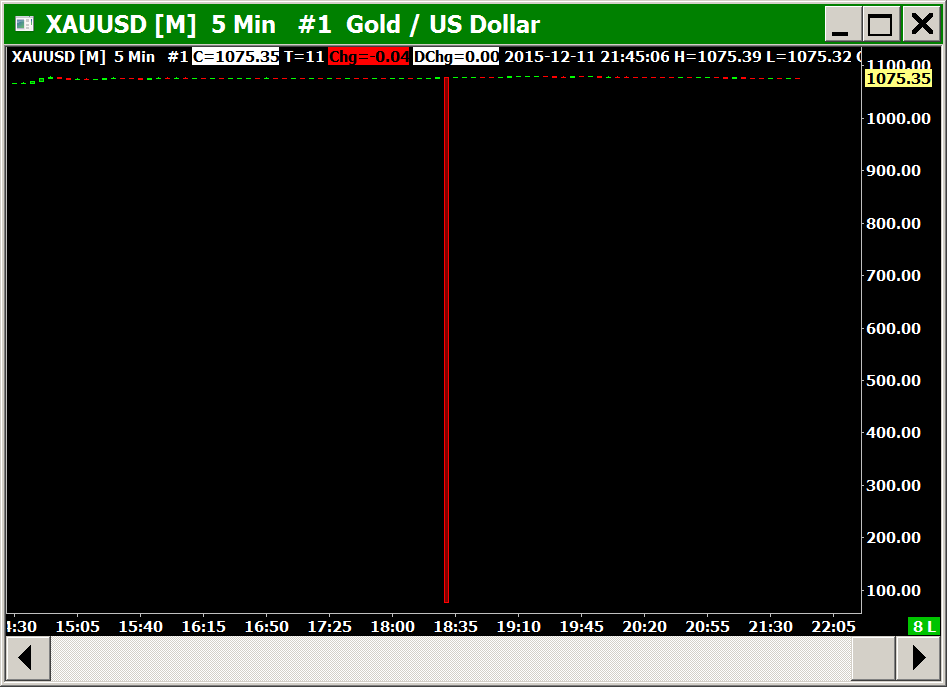
There are different types of errors that can affect charts in various ways. This is only one example. There could be data records with incorrect Date-Time values which will cause out of order Date-Time values in the chart. This could cause Chart Drawings and some Studies not to function properly.
There could be errors with price values that can be either small or large which can also affect the appearance of the chart.
- 2.1 Intraday Charts
- 2.2 Historical Charts
- 2.2.0: General Information
- 2.2.1: Manually Correcting the Data Errors
- 2.2.2: Correcting Data Errors by Downloading the Data Again
- 2.2.3: Last Bar Continues to Have an Error
- 2.2.4: Data Errors Caused by Symbol Differences
- 2.2.5: Data Error at Last Bar in Historical Chart Caused by Incorrect Multiplier Settings
- 2.2.6: Removing Permanent Data Errors from Real-time Data Feed
- 2.3 Method to Filter out Intraday Chart Data Errors
- 2.4 How to Analyze Why There is Inaccurate/Incorrect Data in Chart
2.1 Intraday Charts
There are two ways to correct errors in an Intraday chart.
2.1.1 Manually Correcting Data Errors
The first method is to correct or delete data records that contain errors. For instructions to locate these records and perform the edit, see Quickly Locating a Specific Record In the Editor on the Intraday Data Editor documentation page.
2.1.2 Deleting and Re-downloading Data. (Easier and Recommended Method)
The second method is to delete and re-download the historical Intraday data with the possibility that the newly downloaded data will not contain the errors. This method will not always work, since the server may contain the same errors.
This method is also the very same method used to restore missing data in an Intraday chart.
The following instructions need to be performed in the main instance of Sierra Chart, not a sub instance started with File >> New Instance if you are noticing the data errors in the sub instance and re-downloading the data in the sub instance is not clearing the errors.
Once you perform these steps in the main instance, then you need to go back to the sub instance and perform the identical steps. This is necessary since the historical data in a sub instance is downloaded from the available historical data in the main instance.
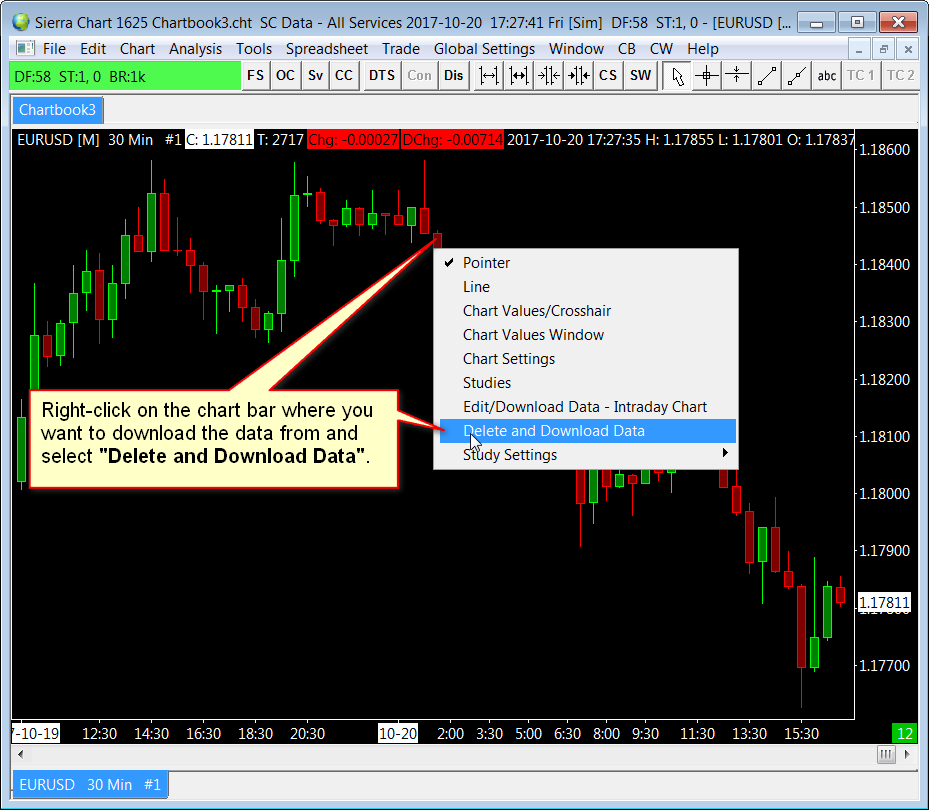
Refer to the image below for the basic procedure.
- Optional: To make sure that the historical Intraday data request is routed to the proper source, it is necessary that the Symbol Settings are up-to-date by following the instructions to Update the Symbol Settings. This only needs to be done one time.
- Make certain Sierra Chart is connected to the data feed by selecting File >> Connect to Data Feed on the menu. Depending upon the particular Data or Trading service being used, if Sierra Chart cannot connect to the data feed, then historical Intraday data may not be able to be downloaded. To determine if Sierra Chart is connected to the data feed, refer to File >> Connect to Data Feed.
- Select Global Settings >> Data/Trade Service Settings on the menu. Make sure the Maximum Historical Intraday Days to Download >> Non-Tick Data / 1 Tick Data settings are set to what you require. 186 is recommended. If you want to get data further back in time than you already have in the chart data file, then you may need to increase this setting, assuming the server has the data.
- Press OK.
- Scroll the chart so that the area before the data errors or missing data is visible.
- Right-click with your Pointer on the chart before the data errors or missing data. Select Delete and Download Data on the menu.
- Press Yes to confirm. The historical data will be downloaded. When the download is complete, the chart will be reloaded.
- Optional: To re-download all the data in the chart, select Edit >> Delete All Data and Download.
2.2 Historical Charts
2.2.0: General Information
There are two methods to correct an error or errors in Historical charts (Daily, Weekly, Monthly, Quarterly, Yearly bar time frames). The first step with either method is to reconnect to the data feed to attempt to clear errors that may exist with the current days quote data for a symbol.
To reconnect select File >> Disconnect on the menu and then File >> Connect to Data Feed.
After reconnecting to the data feed, to clear the potentially invalid data from the prior connection to the real-time data feed providing the current quote data, go to the chart and select Chart >> Reload and Recalculate.
The current days quote data can be displayed by going to the chart for the symbol and selecting Window >> Current Quote Window. It is also merged into the very last bar in the chart.
2.2.1: Manually Correcting the Data Errors
The first method is to correct the error yourself. Look closely at your chart and find the date of the incorrect value. The Chart Values Tool on the Tools menu can be used to display the exact date.
Select Edit >> Edit Data - Historical Chart on the menu to open the text editor. Find the particular date you want to edit in the editor and delete the incorrect data line or correct it.
Save the file and close the editor. When the editor is closed, the charts that use that data file will automatically reload. Refer to Edit Menu for more information.
2.2.2: Correcting Data Errors by Downloading the Data Again
This method relies upon the Data or Trading service to have corrected the error or errors.
There may not actually be a data error, but in the case of Historical Daily data, there may have been a stock split, causing a change in prices in which case all of the data needs to be re-downloaded in the chart (explained further down).
Scroll the chart so that the location of the data error is within view. Right-click on the chart before the data error and select on the displayed menu Delete and Download Data. This will re-download the data.
If the data error is at the last bar in the chart, or the bar before the last bar, then you can select Edit >> Download Data - Historical Chart on the menu. Make sure the From Last Date in Chart Files option is selected. Press OK. This will download data starting at the last two records in the historical chart data file, to the present date.
Depending upon the reason for the data errors and the type of data errors, it may be necessary to fully re-download the data in the chart. For example, there could be price differences between recent bars and prior bars due to a stock split. In these cases, fully re-download the data in the chart by selecting Edit >> Delete All Data and Download from the main menu.
Refer to the Downloading Historical Daily Data documentation page for more information about downloading historical Daily data.
If the error continues to be in the chart, then use the first method described above (2.2.1) to manually correct it yourself. If the data error is at the last bar in the chart, then refer to 2.2.3: Last Bar Continues to Have an Error.
2.2.3: Last Bar Continues to Have an Error
If the very last bar in a Historical chart continues to have an error with either the prices or volume after following the instructions in help topic 2.2.0, 2.2.1 or 2.2.2, then most likely the current days quote data on the real-time data server for the symbol has an error.
The current days quote data can be displayed with Window >> Current Quote Window. If you see incorrect values there with the prices or volume, you need to contact your Data or Trading service to have them correct the error. If the current quote data looks correct, then reload the data in the chart with Chart >> Reload and Recalculate.
If there was a data error with the current quote data from the Data or Trading service and it has been corrected, then follow the instructions in section 2.2.0 to clear the error from the chart. You may also have to follow section 2.2.2: Correcting Data Errors by Downloading the Data Again to correct the data in the chart data file as well.
To determine if the error you see at the last bar in the chart is in the chart data file, select Edit >> Edit Data - Historical Chart. A text editor will display showing the data. Go to the bottom of the file and locate the date for the last bar in the chart. Verify the the prices and volume are correct. If they are incorrect, then the source of the data errors at last in bar is in the data file itself.
2.2.4: Data Errors Caused by Symbol Differences
If you have a Historical chart open that uses Historical Daily data from a service different than the real-time Data or Trading service you are using, and there are symbol differences between these two services, then you may have an error in your chart on the very last bar.
This could appear as a very long bar which compresses the rest of the chart and makes all the other bars look like a thin line.
What is actually happening in this case is the Historical Daily chart symbol matches with another symbol from the real-time data feed but actually is a different symbol. In this case select Chart >> Chart Settings >> Chart Data and disable Allow Real-Time Updating of Historical Chart.
2.2.5: Data Error at Last Bar in Historical Chart Caused by Incorrect Multiplier Settings
Apparent data errors in a chart can be caused by incorrect chart Multiplier settings. Select Chart >> Chart Settings >> Symbol.
Both the Real-time Price Multiplier and Historical Price Multiplier both should be set to 1 in almost all cases.
Change these to 1 and press OK to see if the data errors are resolved.
2.2.6: Removing Permanent Data Errors from Real-time Data Feed
There may be cases for some symbols, that the real-time data feed Sierra Chart is connected to is providing consistently invalid Current Quote values which are affecting the display of the last bar in a Historical chart.
For example, this could be the case with Interactive Brokers where it provides -1 values for some symbols. This may be in the case where there is not a real-time data subscription for the particular symbol.
In this particular case, the solution is to go to the particular Historical chart and select Chart >> Chart Settings >> Chart Data. Uncheck the Allow Real-time Updating of Historical Chart option. Press OK. The invalid real-time Current Quote values will be removed from the last bar in the Historical chart.
2.3 Method to Filter out Intraday Chart Data Errors
There is a method to filter out data errors in Intraday charts.
If the apparent data errors occur at certain regular times, such as outside of regular trading hours, you can adjust the Intraday Session Times in Chart >> Chart Settings to exclude those times where the data errors occur, to prevent the data with the errors from displaying in the chart.
How to Analyze Why There is Inaccurate/Incorrect Data in Chart
When there is a question to Sierra Chart support about incorrect or inaccurate data in a chart, we need a detailed understanding of why there is a problem and how this conclusion is determined.
Go through the list below to make this determination.
- First, remove all studies from the chart.
- Is the symbol of the chart correct. Refer to Changing Chart Symbol.
- Is there any missing data missing historical data in the chart?
- Are there any bar high and low values which are wrong? if so, how do you know they are wrong? What is the basis of your conclusion? In the case of a continuous futures contract chart, you need to understand at each chart bar, what contract month you are looking at to make a determination as to whether there is a problem with the high and low data for a chart bar for a particular contract month and year.
And you must also disabled back adjustments. Sierra Chart will not provide any help at all with claims of inaccurate data if you are using a back adjusted continuous futures contract option. - Sierra Chart support will also not provide help with claims of inaccurate data, and for non-Sierra Chart provided data feeds.
*Last modified Wednesday, 22nd February, 2023.