
Graphics Settings
- Introduction
- Using Different Color and Graphics Settings for Specific Charts
- General Instructions
- Graphics Settings - Colors
- Chart
- Chart Text
- Chart Values Scale Text Color
- Chart Time Scale Text Color
- Chart Background
- Chart Values Scale Background
- Chart Time Scale Background
- Chart Grid
- Chart Grid Secondary
- Chart Rollover Date Line
- Chart Scale Border
- Region Dividing Line
- Chart Selected Tab Color
- Chart Selected Tab Text Color
- Chart Selected Tab Border Color
- Chart Tab Color
- Chart Tab Text Color
- Chart Tab Control Background Color
- Last Trade Price Box
- Last Trade Price Box Foreground
- Last Trade Price Box Outline
- Bar High-Low Down
- Bar High-Low Up
- Bar Open
- Bar Close
- Line On Close / Line On Open / Mountain
- Candlestick Up Outline
- Candlestick Up Fill
- Candlestick Down Outline
- Candlestick Down Fill
- Net Change Up
- Net Change Down
- Bid Ask Average Line
- Scroll End Color
- Scroll Not End Color
- Alert Highlight Color
- Settings
- Window
- Main Window Background
- Window Title Bar
- Inactive Window Title Bar
- Window Title Bar Text
- Inactive Window Title Bar Text
- Window Move Rectangle Color and Width
- Window Border
- Window Inactive Border
- Window Background
- Window System Minimize Maximize Close Foreground
- Window System Minimize Maximize Close Background
- Chartbook
- Chat Window
- Chat Window: Contacts Background Color
- Chat Window: Contacts Text Color
- Chat Window: Messages Background Color
- Chat Window: Received Message Name Background Color
- Chat Window: Received Message Name Text Color
- Chat Window: Received Message Background Color
- Chat Window: Received Message Text Color
- Chat Window: Received Filename Text Color
- Chat Window: Received Message Timestamp and Status Text Color
- Chat Window: Sent Message Name Background Color
- Chat Window: Sent Message name Text Color
- Chat Window: Sent Message Background Color
- Chat Window: Sent Message Text Color
- Chat Window: Sent Message Filename Text Color
- Chat Window: Sent Message Timestamp And Status Text Color
- Chat Window: New Message Text
- Chat Window: New Message Background
- Settings Window
- Settings Windows: Item Text Foreground Color
- Settings Windows: Item Text Background Color
- Settings Windows: Section Title Foreground Color
- Settings Windows: Section Title Background Color
- Settings Windows: Highlight Color
- Settings Windows: 'Yes' Text Color
- Settings Windows: 'No' Text Color
- Settings Windows: Button Foreground Color
- Settings Windows: Button Background Color
- Settings Windows: Pushed Button Foreground Color
- Settings Windows: Pushed Button Background Color
- Settings Windows: Read-Only Setting Description Foreground Color
- Settings Windows: Read-Only Setting Description Background Color
- Settings Windows: Read-Only Setting Value Foreground Color
- Settings Windows: Read-Only Setting Value Background Color
- Settings Windows: Grid Line
- Chart Values
- Time & Sales
- Time and Sales: Bid Trades Background
- Time and Sales: Bid Trades Text
- Time and Sales: Below Bid Trades Background
- Time and Sales: Below Bid Trades Text
- Time and Sales: Ask Trades Background
- Time and Sales: Ask Trades Text
- Time and Sales: Above Ask Trades Background
- Time and Sales: Above Ask Trades Text
- Time and Sales: Bid and Ask Records Trades Background
- Time and Sales: Bid and Ask Records Trades Text
- Time and Sales: Grid
- Time and Sales: Bid Highlight Color
- Time and Sales: Bid Highlight Text Color
- Time and Sales: Ask Highlight Color
- Time and Sales: Ask Highlight Text Color
- List Box
- Status
- Status: Downloading Continuous Contract Data Foreground Color
- Status: Downloading Continuous Contract Data Background Color
- Status: Waiting to Download Historical Data Foreground Color
- Status: Waiting to Download Historical Data Background Color
- Status: Historical Download Skipped Foreground Color
- Status: Historical Download Skipped Background Color
- Status: Downloading Historical Data Foreground Color
- Status: Downloading Historical Data Background Color
- Status: Historical Download Complete Foreground Color
- Status: Historical Download Complete Background Color
- Status: Download Failed Foreground Color
- Status: Download Failed Background Color
- Status: Download Canceled Foreground Color
- Status: Download Canceled Background Color
- Real Time Symbol Status: Invalid Status Foreground Color
- Real Time Symbol Status: Invalid Status Background Color
- Control Bars
- Control Bar: Enabled Button Text
- Control Bar: Disabled Button Text
- Control Bar: Button Default Background
- Control Bar: Background
- Control Bar Status Not Connected
- Control Bar Status Connecting
- Control Bar Status Waiting To Reconnect
- Control Bar Status Connected
- Control Bar: Status Text
- Control Bar: Text Control Text
- Linking
- General
- Market Depth
- DOM Graph Ask Lines Begin Color
- DOM Graph Ask Lines End Color
- DOM Graph Bid Lines Begin Color
- DOM Graph Bid Lines End Color
- Market Depth: Bid Gradient Start Color
- Market Depth: Bid Gradient End Color
- Market Depth: Ask Gradient Start Color
- Market Depth: Ask Gradient End Color
- Market Depth: Text Color
- Market Depth: Background Color
- Market Depth: Grid Line
- Chart DOM
- Trade DOM
- Trade Window
- Trading
- Quote Board
- Quote Board: Background
- Quote Board: Foreground/Text
- Quote Board: Price Change Up
- Quote Board: Price Change Down
- Quote Board: New High Highlight
- Quote Board: New Low Highlight
- Quote Board: Gridlines
- Quote Board: Selected Symbol
- Quote Board: Blank Row Background
- Quote Board: Label Row Background
- Quote Board: Label Row Foreground Text
- Quote Board: Selected Border Highlight
- Quote Board: Alert Triggered Highlight
- Study Summary
- Bid Ask Bars
- Bid Ask Bar: Large Volume Ask Bar
- Bid Ask Bar: Medium-Large Volume Ask Color
- Bid Ask Bar: Light-Medium Volume Ask Color
- Bid Ask Bar: Light Volume Ask Color
- Bid Ask Bar: Large Volume Bid Color
- Bid Ask Bar: Medium-Large Volume Bid Color
- Bid Ask Bar: Light-Medium Volume Bid Color
- Bid Ask Bar: Light Volume Bid Color
- Spreadsheet
- Chart Scale
- Saved Settings
- Chart
- Graphics Settings - Font
- Chart Text
- DOM Quantities/Sizes
- Text Windows
- Spreadsheets
- Chartbook and MDI Tabs Text
- Control Bar Text
- Control Collection Non-Button Text Controls
- Control Collection Non-Button Combo Controls
- Quote Board
- Compact Tool Values Window
- Study Summary Window
- Chart Values Window
- Market Depth Window
- Time and Sales Window
- Chart Order Fills
- Trade Window Buttons
- List Box Header Text
- Settings Windows
- Tool Drawing Configuration Window
- Chat Window
- Chat Window Open Chats
- Chat Window Message Text
- Control Layout Window
- Window Title Bar
- Inactive Window Title Bar
- Hover Text
- Global Default Font
- Reset All Fonts to Their Own Default
- Reset All Fonts to Global Default
- Graphics Settings - Other
- General Graphics
- Candlestick Width Percentage
- OHLC Width Percentage
- Price Volume Width Percentage
- Arrow Draw Style Max Width
- Default Chart Bar Spacing
- Default Right Side Fill Space
- Color Entire OHLC Bar the High/Low Color
- Color Candlestick High-Low Using the Outline Colors
- Draw Bid and Ask Lines at Last Bar When Enabled
- Up/Down Coloring for OHLC Bars Based on Previous and Current Close
- Underline Chart Header Field Names
- Bold DOM Last Price
- OpenGL
- Small Widths
- Control Bar Text Control Text Padding
- Control Bars and Tab Control Content Horizontal Padding
- Control Bars and Tab Control Content Vertical Padding
- Control Bars and Tab Control Separator Size in Pixels
- Control Bars and Tab Control Caption Height in Pixels
- Control Bars and Tab Control Border Height in Pixels
- Control Bars and Tab Control Border Width in Pixels
- Control Bars and Tab Control Margin in Pixels
- Control Bars and Tab Control Default Text Height
- Control Bars and Tab Control Default Text Width
- Control Bars Max Height in Pixels
- Control Bars Max Width in Pixels
- Control Bars Floating Rectangle Top Left Offset
- Tab Control Indicator Width
- Chart Price Graph Area Minimum Width
- Chart Price Graph Area Minimum Width for Trade DOM
- Selection Margin for Adjusting Chart Regions
- Trade Statistics for Chart List Box Column Default Width
- Symbol Selection Window Column Default Width
- File Open Save Dialog Column Default Width
- Numbers Bars Volume Profile Bar Minimum Width
- Numbers Bars Pullback Separator Width
- Numbers Bars Minimum Column Width
- Numbers Bars Open to Close Box Width
- Line Label Edge Margin Width
- Zoom In Tool Line Width
- Study Subgraph Tick Size Rectangle Minimum Padding
- Study Subgraph Tick Size Rectangle Maximum Padding
- Study Subgraph Color Background At Price Minimum Height
- Study Subgraph Transparent Tick Size Rectangle Minimum Height
- List Box Header Move Highlight Rectangle Width
- Chart Horizontal Grid Spacing Minimum Text Height Reduction
- Chart Loading Progress Bar Height
- Studies Window Available Studies List Width
- Manage Chart Drawing Window List Box Margin
- Chart DOM Additional Vertical Padding for Market Depth Summary Values
- Chart DOM Columns Adjust Highlight Width
- Chart DOM Header Resize Margin for Pointer
- Chart DOM Line Graphs Text Horizontal Shift
- Chart DOM Graph Lines Text Padding
- Chart Bid Ask Lines Minimum Horizontal Width
- Chart Bid Ask Lines Minimum Width
- Chart Bid Ask Lines Maximum Width
- Chart Drawing Minimum Region Height
- Chart Drawing Line Marker Minimum Width
- Chart Drawing Bar Spacing Minimum Width for Marker Drawing Width Calculation
- Chart Drawing Ellipse Highlight Minimum Width
- Chart Drawing Line Handle Minimum Radius
- Chart Drawing Anchor Minimum Radius
- Chart Trading Order Line Left Offset
- Chart Trading Association Line Offset
- Chart Trading Order Or Position Line Button Offset
- Chart Trading Order Fill Bar High Low Offset
- Chart Trading Position Line Horizontal Offset
- Chart Trading Filled Order Rectangle Offset
- Chart Tool Values Window Default Rectangle Horizontal Offset
- Chart Tool Values Window Default Rectangle Vertical Offset
- Chart Tool Values Window Default Rectangle Width
- Chart Tool Values Window Default Rectangle Height
- Compact Values Window Initial Horizontal Offset
- Compact Values Window Initial Vertical Offset
- Compact Values Window Initial Width
- Compact Values Window Initial Height
- Volume by Price Profile Spacing
- Volume by Price Minimum Bar Width
- List Box Default Column Width
- List Box Minimum Column Width
- List Box Header Extra Height
- List Box Header Padding
- List Box Text Horizontal Padding
- List Box Text Top Padding
- List Box Text Bottom Padding
- List Box Header Resize Margin for Pointer
- General Graphics
- Chart Bar Widths
- How Chart Bar and Candlestick Up Down is Determined
- Tasks
- Saving and Loading Multiple Graphics Settings Configurations
- Copying Global Graphics Settings To/From Chart Graphics Settings
- Changing the Font Size For Text Displayed with Tool Drawings (Global Chart Drawing Font)
- Adjusting Graphics Settings and Fonts for High DPI Displays
- Adjusting Size of Dialog Windows
- Setting Default Custom Colors
- Adjusting Text Size on Menus
- Setting Colors for Chart and Chartbook Tabs for the Main Window
- Setting Color for Main Window Background
- Setting Colors for List View Headers
- Text Display when using Open GL
Introduction
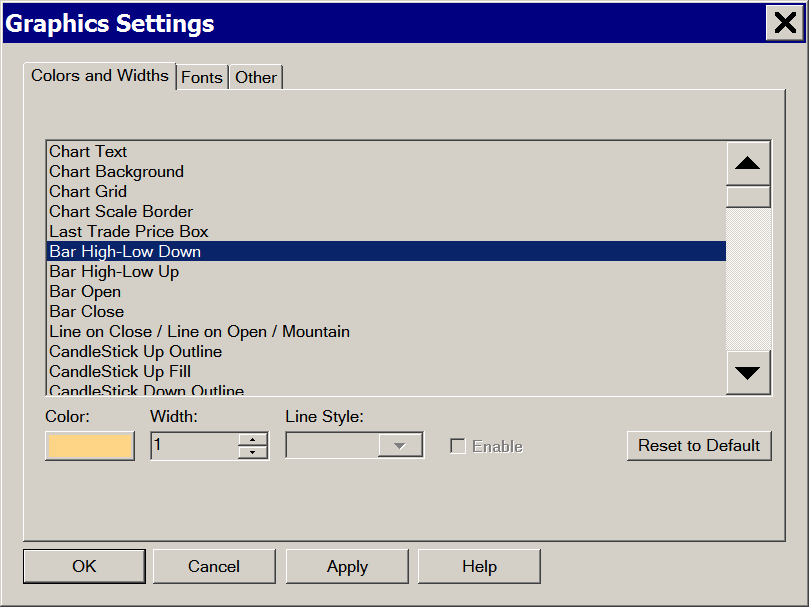
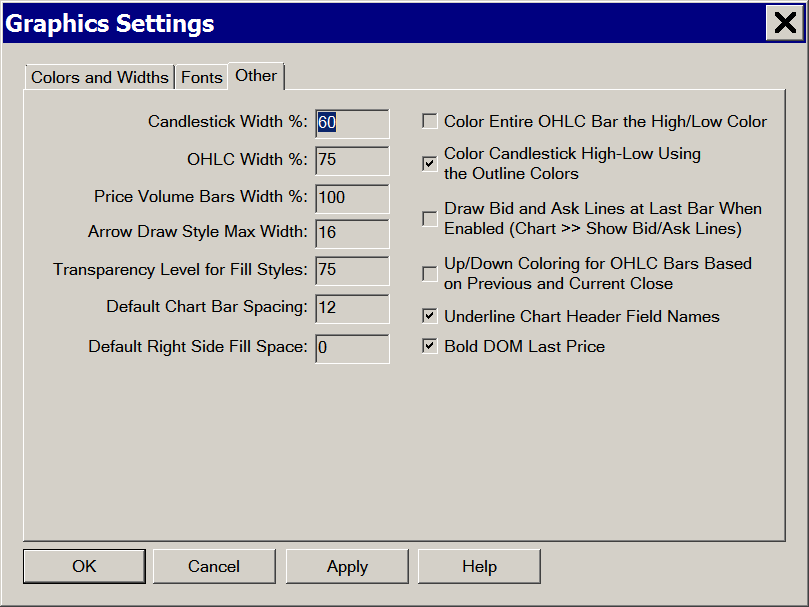
There are two versions of the Graphics Settings window.
The first version is opened by selecting Chart >> Graphics Settings on the menu.
This is the chart specific Graphics Settings window and lets you individually set the Colors and Widths for various chart objects for the active chart. And you can set the Chart Text Font for the chart as well.
When you use this specific Graphics Settings window, you need to uncheck the Use Global Graphics Settings Instead of These Settings option on this window, to let you choose to use the settings specified on this window, rather than the Global Graphics Settings specified in Global Settings >> Graphics Settings.
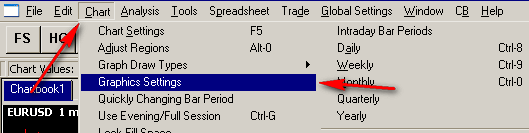
The second version is opened by selecting Global Settings >> Graphics Settings on the menu.
With this Graphics Settings window you are able to set all of the various global graphics and appearance settings. These settings are global and they apply to the entire Sierra Chart program and all charts that are not set to use the chart specific settings under Chart >> Graphics Settings.
All the settings that can be changed are listed in the global graphics settings. Not all of these options will be available in the chart specific graphics settings. If an item is not available in the chart specific graphics settings, then this item can only be controlled through the global graphics settings.
You cannot control the colors and appearance of studies though through this window. Only the main price graph colors and widths, and other global graphics settings.

With either Graphics Settings window, press OK to accept the settings, Apply to apply the settings without closing the window or Cancel to close the window without saving.
Changing the Colors and Appearance of Chart Studies
The colors and appearance of studies is independent from the settings in the Graphics Settings window and is controlled through the Study Settings window for each individual study. For instructions to change the Study Settings for study, refer to the Chart Studies page.
Using Different Color and Graphics Settings for Specific Charts
It is supported to use colors and other graphic settings for individual specific charts that are different than the global color and graphic settings.
To do this, follow these instructions:
- Go to the chart that you want to change the colors and other graphics settings to be different than the global settings. You can select the chart from the CW menu or left click on its title bar.
- Select Chart >> Graphics Settings >> Graphics Settings for Chart - Colors >> Settings.
- Set Use Global Graphics Settings Instead of These Settings to No.
If you want the chart to use the global color and graphics settings, then make sure that Use Global Graphics Settings Instead of These Settings is set to Yes. - Change the colors and other settings as you require.
- Press OK.
For more information on this control, refer to the documentation for Use Global Graphics Settings Instead of These Settings.
General Instructions
There are 3 different graphics settings windows. One for Colors, one for Fonts and one for Other items that are not specified in the other two windows.
The following sections give information on how to use these windows and what can be changed for the entries within each window.
Instructions for Graphics Settings - Colors
The Graphics Settings - Colors is used to change the color, width/size, style, and availability of the various items in Sierra Chart.
To make changes to a specific item, find the desired item and left-click to select it. The Search option at the top can be used to find an item within any tab of this window.
Color Setting
To change the Color of an item, select the color field for the item to be changed. Depending on how the Settings Windows settings are setup, you may have to click once or twice.
Clicking that item will open the Color Picker window.. Select the desired color within the color picker and select OK to close that window. The new color will be displayed in that items's line.
Width Setting
Items that can have their Width changed, will have a number displayed in the Width column. Any item that does not have a number displayed in the Width column does not support a width change.
To change the width for an item, left click on the Width field for that item, this allows the field to be edited. Enter a new value, or use the +/- buttons to increase (+) or decrease (-) the current value. Select the Enter key, or left-click on another item, when done editing that field.
Line Style Setting
Items that can have their Line Style changed, will have a style displayed in the Line Style column. Any item that does not have a style displayed in the Line Style column does not support a line style.
To change the line style, left click on the displayed style field for that item. This will display a drop-down menu of the available selections. Choose the desired style by left clicking on it. Select the Enter key, or left-click on another item, when done editing that field.
"Enable" Setting
If the Enable setting is available for a particular graphics item, then this means that this particular graphics item can be enabled or disabled. If the Enable setting is not available for a particular graphics item, then this means that this particular graphics item is always enabled.
Select the entry in the Enable column to toggle between Yes and No.
Reset Setting
On the Global Graphics Settings - Colors window there is an option to reset the color, line width, and line style back to the original default settings. This reset option is not available on the chart specific color graphics settings
To perform the reset for an individual line item, select the line item to highlight it and select the Reset button in the Reset column for that item.
The Reset button does not reset the Enable option back to the default for a line item. This will stay as it is set when the Reset button is selected.
Instructions for Graphics Settings - Fonts
The Graphics Settings - Font window is used to change the font that is used for the various text items.
Select the line item for which you want to change the font, and select the displayed font name in the Value column. This will bring up the font selection window.
On the font selection window, select the desired Font, Font Style, Size, and Strikeout and Underline effects. The Sample area in the window gives a preview of the font to see what it will look like once applied. The Color can not be changed through this window. To change colors of an item, refer to the Instructions for Graphics Settings - Colors.
Select the OK button to set that font and related settings for the highlighted item.
In order for the change to take effect, the OK or Apply All button must be selected on the Graphics Settings - Fonts window. Selecting Cancel will cancel any changes that were made to individual font selections if they were not saved.
Fonts can be reset to their default settings by selecting the Reset to Default button for an item in the Reset column.
Instructions for Graphics Settings - Other
The Graphics Settings - Other window is used to set various graphics related items that are not controlled through either the colors or fonts settings.
Each item in the Graphics Settings - Other window has a single value that can be modified. Left-click in the Value field for an item to modify it. The instructions for how to adjust a particular entry type can be found on the Settings Window Interface documentation.
Graphics Settings - Colors
Select an object in the Graphics Settings - Color window to change its color, width, and/or line style.
Intructions for how to modify items on this window can be found in the Instructions for Graphics Settings - Colors section.
This section defines the colors, line styles, and widths for items that are part of the main chart. This sets the color of the text that is displayed in the Scales and the Chart Header. It also is used for the color of the box that is displayed when using the Zoom In Chart Drawing Tool. This sets the color of the text in the Values Scale (Vertical Scale) on the right side of the chart and also the left side of the chart if Use Left Side Scale is enabled. When Trading Chart DOM is enabled or Show Market Data Columns is enabled, then this color setting does not apply and the Chart DOM Values Scale Text color setting applies instead to change the Values Scale Text Color. This sets the color of the text in the Time Scale (Horizontal Scale) This sets the color of the background of the chart window. This sets the color of the background in the Values Scale (Vertical Scale) on the right side of the chart and also the left side of the chart if Use Left Side Scale is enabled. When Trading Chart DOM is enabled or Show Market Data Columns is enabled, then this color setting does not apply and the Chart DOM Values Scale Background Color setting applies instead to change the Values Scale Background Color. This sets the color of the background in the Time Scale (Horizontal Scale) This sets the color and line style of the Horizontal and Vertical Grid lines. This sets the color and line style of the Secondary Grid lines. This sets the color, width and line style of the Rollover Date Line that shows where the rollover took place for a Continuous Futures Contract Chart and Chart >> Show Rollover Dates is enabled. This sets the color of the border surrounding the graphics area and the left side of the Price Scale/Chart DOM. This sets the color of the dividing line between regions. The dividing line between regions is only displayed when Display Region Dividing Lines is set to Yes. This sets the background color of the tab for the selected (active) chart within a Chartbook. This sets the color of the text on the tab for the selected (active) chart within a Chartbook. This sets the color of the border on the tab for the selected (active) chart within a Chartbook. This sets the background color of the tabs for the not selected (not active) charts within a Chartbook. This sets the color of the text on the tabs for the not selected (not active) charts within a Chartbook. This sets the color of the background of the chart tabs control area. The chart tabs control area is the area in which the chart tabs are displayed, therefore this sets the color of the area that is not covered by chart tabs. This sets the color of the background of the last trade price box on the right side of the chart in the Values Scale. The Enable option to the right of this color setting needs to be enabled for the Last Trade Price Box to be displayed. It is also possible to change the background color based upon whether the last trade is a Bid trade or Ask trade. Refer to Chart DOM Last Price Background Bid Trade, Chart DOM Last Price Background Ask Trade in the case of a Chart DOM. In the case of a Trade DOM, refer to Trade DOM Last Price Background Bid Trade, Trade DOM Last Price Background Ask Trade. This sets the color of the foreground (text) of the last trade price box on the right side of the chart in the Values Scale. It is also possible to change the text color based upon whether the last trade is a Bid trade or Ask trade. Refer to Chart DOM Last Price Text Bid Trade, Chart DOM Last Price Text Ask Trade in the case of a Chart DOM. In the case of a Trade DOM, refer to Trade DOM Last Price Text Bid Trade, Trade DOM Last Price Text Ask Trade. The Last Trade Price Box Outline can be optionally enabled and controls the color and size of the outline of the last trade price box on the right side of the chart in the Values Scale. The Bar High-Low Down item in the Colors and Widths list box represents the High to Low portion of a chart bar when the bar is considered a Down bar. This color setting also applies to Candlestick bars as well. In the case of Candlestick bars, when you have the option Other >> Color Candlestick High-Low Using the Outline Colors enabled, then this color setting will be ignored and the Candlestick Up/Down Outline colors will be used for the High-Low portion (wick) of the bar instead. Therefore, if you want to color the wick portion of a Candlestick bar differently than the body color and its outline, disable Other >> Color Candlestick High-Low Using the Outline Colors. The Bar High-Low Up item in Colors and Widths list box represents the High to Low portion of a chart bar when the bar is considered an Up bar. This color setting also applies to Candlestick bars as well. In the case of Candlestick bars, when you have the option Other >> Color Candlestick High-Low Using the Outline Colors enabled, then this color setting will be ignored and the Candlestick Up/Down Outline colors will be used for the High-Low portion (wick) of the bar instead. Therefore, if you want to color the wick portion of a Candlestick bar differently than the body color and its outline, disable Other >> Color Candlestick High-Low Using the Outline Colors. The Bar Open item in Colors and Widths list box is for the open marker on the left side of a chart bar. This color setting is ignored when Color Entire OHLC Bar the High/Low Color is enabled. The Bar Close item in Colors and Widths list box is for the close marker on the right side of a chart bar. This color setting is ignored when Color Entire OHLC Bar the High/Low Color is enabled. This sets the color, size, and line type when using the Line On Close, Mountain, Line On Open, Line on HL Avg, or Stair Step on Close Chart Draw Types. This sets the color of the outline of a Candlestick Bar when it is an Up bar. This sets the color of the interior fill of a Candlestick Bar when it is an Up bar. This sets the color of the outline of a Candlestick Bar when it is a Down bar. This sets the color of the interior fill of a Candlestick Bar when it is a Down bar. This sets the color of the Net Change Up header text. If Reverse Color is selected for this header text, then this is the color used to Highlight the text and the text will use the Background Color of the chart. This sets the color of the Net Change Down header text. If Reverse Color is selected for this header text, then this is the color used to Highlight the text and the text will use the Background Color of the chart. This sets the color of the Bid Ask Average Line. This sets the highlight color of the Chart Settings Indicators at Lower Right when the chart is fully scrolled to the end. This sets the highlight color of the Chart Settings Indicators at Lower Right when the chart is not fully scrolled to the end. This is the color of the background for an alert notice in the Chart Header. This tab is only available on the Graphics Settings for Chart - Colors window. It is not available on the global color graphics settings window. This controls whether the graphics settings set in the Graphics Settings for Chart apply to this chart, or if the global color graphics settings will be used. Set the option for Use Global Graphics Settings Instead of These Settings to No to use graphics settings that are specific to this chart. Each new chart you open, inherits the Global Graphics Settings specified under Global Settings >> Graphics Settings by default. Set Use Global Graphics Settings Instead of These Settings to Yes to use graphics settings that are global and are set through the Global Settings >> Graphics Settings - Colors window. When this button is selected, the currently set chart graphics settings for the Graphics Settings for Chart - Colors will be copied to the active Global Graphics Settings (set in Global Settings >> Graphics Settings - Colors). This does not affect any of the Saved Global Graphics settings, only the active settings. When this button is selected, the currently set global graphics settings for the Graphics Settings - Colors (set in Global Settings >> Graphics Settings - Colors) will be copied to the active chart's graphics settings. This section contains settings for the color, line style, and line width for window related items that are not part of another specific entry. This tab is only available on the global graphics settings window. None of these items can be set for an individual chart. This sets the color of the background area behind where chart windows are displayed. This area can be viewed when first starting Sierra Chart and no Chartbook has been opened, or when charts are not Maximized and the background area can be seen behind the charts. This is the color for a Multiple Document Interface (MDI) window title bar when it is active. This applies to windows within the main Sierra Chart window. The height of the Title Bar in pixels is set through the Width setting. This height for an active title bar can be different than an inactive Title Bar. The font is set with the Window Title Bar font in the Font Settings. This is the color for a Multiple Document Interface (MDI) window title bar when it is inactive. This applies to windows within the main Sierra Chart window. The height of the Title Bar in pixels is set through the Width setting. This height for an inactive title bar can be different than an active Title Bar. This is the color of the text on an active Title Bar for a Multiple Document Interface (MDI) window. This is the color of the text on an inactive Title Bar for a Multiple Document Interface (MDI) window. This sets the color and width of the rectangle that shows the position of an MDI window when it is being moved within the main Sierra Chart application frame. This set color is blended with the colors over which it moves, therefore it may not appear the exact color as set unless it is over an area of black coloring. This option only applies when the setting for Use Outline Window Move for MDI Child Windows is set to Yes. This is the color of the window border for a Multiple Document Interface (MDI) window. This is the color of an inactive window border for a Multiple Document Interface (MDI) window. This is the background color for a window. This is only used by Control Bars. This is the foreground color used by the Minimize, Maximize and Close buttons at the top right of a MDI child. This is the background color used by the Minimize, Maximize and Close buttons at the top right of an MDI child. The width of the Minimize, Maximize and Close buttons is set with the Width setting. This section contains settings for the color, line style, and line width of chartbook related items. This tab is only available on the global graphics settings window. None of these items can be set for an individual chart. This sets the background color of the tab for the selected (active) Chartbook. This sets the color of the text on the tab for the slected (active) Chartbook. This sets the background color of the tabs for the not selected (not active) Chartbooks. This sets the color of the text on the tabs for the not selected (not active) Chartbooks. This sets the color of the background of the chartbook tabs control area. The chartbook tabs control area is the area in which the chartbook tabs are displayed, therefore this sets the color of the area that is not covered by chartbook tabs. This section contains settings for the color, line style, and line width of items in the Chat Window. This tab is only available on the global graphics settings window. None of these items can be set for an individual chart. This sets the color of the background in the area where contacts are listed in the Chat Window. This sets the color of the text for contacts in the Chat Window. This sets the color of the background of the messages area of the Chat Window. This is not the background of the messages themselves, but the area where the messages are not present. This sets the color of the background behind the name of the person from whom a chat message has been received and read in the Chat Window. This sets the color of the text for the name of the person from whom a chat messages has been received and read in the Chat Window. This sets the color of the background of the text for messages that have been received and read in the Chat Window. This sets the color of the text for messages that have been received and read in the Chat Window. This sets the color of the text for filenames in messages that have been received in the Chat Window. This sets the color of the text for the timestamp and status for messages that have been received in the Chat Window. This sets the color of the background behind the name of the sender of a message in the Chat Window. This sets the color of the text of the name of the sender of a message in the Chat Window. This sets the color of the background for messages that have been sent (outgoing) in the Chat Window. This sets the color of the text for messages that have been sent (outgoing) in the Chat Window. This sets the color of the text for filenames in messages that have been sent (outgoing) in the Chat Window. This sets the color of the text for the timestamp and status for messages that have been sent (outgoing) in the Chat Window. This sets the color of the text for new messages that have been received, but not read, in the Chat Window. This sets the color of the background for new messages that have been received, but not read, in the Chat Window. This section contains settings for the color, line style, and line width for items that are part of the Settings windows. This tab is only available on the global graphics settings window. None of these items can be set for an individual chart. This sets the text color for the settings names and values on the Settings Windows, except for items that have their own specific color setting (such as Yes and No values. This sets the background color of the Settings Windows. This sets the text color of the section headers on the Settings Windows. This sets the background color of the section headers on the Settings Windows. This sets the color of the background for a selected item in the Settings Windows. This sets the color of the text for a Yes answer in the Settings Windows. This sets the color of the text for a No answer in the Settings Windows. This sets the color of the text for buttons in the Settings Windows. This sets the color of the background for buttons in the Settings Windows. This sets the color of the text for a pushed button in the Settings Windows. This sets the color of the background for a pushed button in the Settings Windows. This sets the color of the descriptive text for read-only items in the Settings Windows. This sets the color of the background for the descriptive area of read-only items in the Settings Windows. This sets the color of the text of the value displayed for read-only items in the Settings windows. This sets the color of the background for the value displayed for read-only items in the Settings windows. This sets the color, line type, and line thickness for the Grid lines in the Settings Windows. This section contains settings for the color, line style, and line width of items in the Chart Values windows. This sets the default color of the text and the header background in the Chart Values windows. The Chart Values window may need to be closed and re-opened in order to see the color change. This sets the background color of the Chart Values windows. The Chart Values window may need to be closed and re-opened in order to see the color change. This sets the color of the Price and Time boxes that are displayed in the scales when the crosshair is being used and the option Show Y Values and Price Boxes is set to Yes on the General Settings >> Tool Settings >> Chart Values tab. This sets the color of the text in the Price and Time Boxes that are displayed in the Scales when the crosshair is being used and the option Show Y Values and Price Boxes is set to Yes on the General Settings >> Tool Settings >> Chart Values tab. This sets the color, width and style of the Crosshairs. To control the appearance of the center cross, which is provided by the operating system, refer to Controlling the Type of Pointer Displayed When Using Drawing Tools. This section contains settings for the color, line style, and line width of items on the Time and Sales window. This sets the background color for a line of data in the Time and Sales window when a Trade is considered a Bid Trade. This sets the text color for a line of data in the Time and Sales window when a Trade is considered a Bid Trade. This sets the background color for a line of data in the Time and Sales window when a Trade is considered a Below Bid Trade. This sets the text color for a line of data in the Time and Sales window when a Trade is considered a Below Bid Trade. This sets the background color for a line of data in the Time and Sales window when a Trade is considered an Ask Trade. This sets the text color for a line of data in the Time and Sales window when a Trade is considered an Ask Trade. This sets the background color for a line of data in the Time and Sales window when a Trade is considered an Above Ask Trade. This sets the text color for a line of data in the Time and Sales window when a Trade is considered an Above Ask Trade. This sets the background color for a line of data in the Time and Sales window that is a Bid Ask Record. The Bid Ask Records are only displayed if the option for Show Bid and Ask Records is enabled on the Time and Sales Window >> Settings. This sets the text color for a line of data in the Time and Sales window that is a Bid Ask Record. The Bid Ask Records are only displayed if the option for Show Bid and Ask Records is enabled on the Time and Sales Window >> Settings. This sets the color and width of the grid in the Time and Sales window. This sets the background color for a line of data in the Time and Sales window when a Trade is considered a Bid Trade or a Below Bid Trade. This coloring only occurs when the Highlight and Alert condition is met and the Color Row option is enabled on the Time and Sales Window >> Settings page. For more information refer to the Highlight sections within the Time and Sales Window Settings. This sets the text color for a line of data in the Time and Sales window when a Trade is considered a Bid Trade or a Below Bid Trade. This coloring only occurs when the Highlight and Alert condition is met and the Color Row option is enabled on the Time and Sales Window >> Settings page. For more information refer to the Highlight sections within the Time and Sales Window Settings. This sets the background color for a line of data in the Time and Sales window when a Trade is considered an Ask Trade or an Above Ask Trade. This coloring only occurs when the Highlight and Alert condition is met and the Color Row option is enabled on the Time and Sales Window >> Settings page. For more information refer to the Highlight sections within the Time and Sales Window Settings. This sets the text color for a line of data in the Time and Sales window when a Trade is considered an Ask Trade or an Above Ask Trade. This coloring only occurs when the Highlight and Alert condition is met and the Color Row option is enabled on the Time and Sales Window >> Settings page. For more information refer to the Highlight sections within the Time and Sales Window Settings. This section contains settings for the color, line style, and line width for List Box windows.
This tab is only available on the global graphics settings window. None of these items can be set for an individual chart. List Box windows in Sierra Chart include the following: This sets the background color of the header in a list box window. This sets the color of the header divider (the bar that separates the cells in the header) in a list box window. This sets the color of the border around the headers in a list box window. This sets the color of the header divider in a list box window when adjusting the size of a column. This sets the color of the text in the header of a List Box. This section contains settings for the color, line style, and line wdith for items that are part of the status messages. This tab is only available on the global graphics settings window. None of these items can be set for an individual chart. This sets the color of the text of the status message for Downloading Continuous Contract Data. This sets the color of the background of the status message for Downloading Continuous Contract Data. This sets the color of the text of the status message for Waiting to Download Historical Data. This sets the color of the background of the status message for Waiting to Download Historical Data. This sets the color of the text of the status message for Historical Download Skipped. This sets the color of the background of the status message for Historical Download Skipped. This sets the color of the text of the status message for Downloading Historical Data This sets the color of the background of the status message for Downloading Historical Data This sets the color of the text of the status message for Historical Download Complete. This sets the color of the background of the status message for Historical Download Complete. This sets the color of the text of the status message for Download Failed. This sets the color of the background of the status message for Download Failed. This sets the color of the text of the status message for Download Canceled. This sets the color of the background of the status message for Download Canceled. This sets the color of the text of the real-time symbol status message for Invalid Status. This sets the color of the background of the real-time symbol status message for Invalid Status. This section contains settings for the color, line style, and line width of items for the Control Bars. This tab is only available on the global graphics settings window. None of these items can be set for an individual chart. This sets the color of the control bar button text when a control bar button is set to display the Caption and not an image and the Control Bar Button can be selected. This sets the color of the control bar button text when a control bar button is set to display the Caption and not an image and the Control Bar Button is not available to be selected. This sets the default color for control bar buttons background. This coloring can be changed for each control bar button through the control bar button Properties. This sets the background color for the control bar itself. That is, it is the color of the control bar area where the buttons are not present. This sets the color of the Status Bar when the system is not connected to the selected service nor is it trying to connect to the selected service. This sets the color of the Status Bar when the system is trying to connect to the selected service. This sets the color of the Status Bar when the system is waiting to reconnect to the selected service. This sets the color of the Status Bar when the system is connected to the selected service. This sets the color of the Status Bar text. It is important to consider the various colors that are used for the Status Bar when choosing a text color. This sets the color of the text in the trading related special control bar items, such as the Daily/Net Profit/Loss. This section contains settings for the color of the link numbers. This tab is only available on the global graphics settings window. None of these items can be set for an individual chart. This sets the color of the button for each link number displayed in the link settings for the Quote Board. This section contains the settings for the color, line style, and line width for General Text Windows and for General Buttons. This tab is only available on the global graphics settings window. None of these items can be set for an individual chart. General Text Windows include the following windows in Sierra Chart: This sets the window background color for the General Text Windows. This sets the color of the text (foreground) for the General Text Windows. For a list of General Text Windows to which this setting applies, refer to the General Text Window Background Color section. This sets the color of the highlighting (selected text background) for the General Text Windows. For a list of General Text Windows to which this setting applies, refer to the General Text Window Background Color section. This sets the color of the highlighting for text related to a true alert condition for the General Text Windows. For a list of General Text Windows to which this setting applies, refer to the General Text Window Background Color section. This sets the color of the grid for the General Text Windows that have a grid displayed. For a list of General Text Windows to which this setting applies, refer to the General Text Window Background Color section. This section contains settings for the color, line style, and line width for the DOM Graph. This tab will not be present on the chart specific graphics settings for a Trade DOM, as the DOM Graph can not be utilized on a Trade DOM. This is the color of the first (lowest price) Ask Market Depth line in the DOM Graph. The coloring of the remaining lines is a blend going from this Begin Color to the DOM Graph Ask Lines End Color. This is the color of the last (highest price) Ask Market Depth line in the DOM Graph. The coloring of the remaining lines is a blend going from the DOM Graph Ask Lines Begin Color to this End Color. This is the color of the first (highest price) Bid Market Depth line in the DOM Graph. The coloring of the remaining lines is a blend going from this Begin Color to the DOM Graph Bid Lines End Color. This is the color of the last (lowest price) Bid Market Depth line in the DOM Graph. The coloring of the remaining lines is a blend going from the DOM Graph Bid Lines Begin Color to this End Color. This sets the color of the most recent Bid Price on the Market Depth window. This color is then used in combination with the Market Depth: Bid Gradient End Color to create the gradient of colors used for the Bid data on the Market Depth Window between the current Bid Price and the lowest Bid Price displayed in the window. This sets the color of last (lowest) Bid Price on the Market Depth window. This color is used in combination with the Market Depth: Bid Gradient Start Color to create the gradient of colors used for the Bid data on the Market Depth Window between the lowest Bid Price and the current Bid Price displayed in the window. This sets the color of the most recent Ask Price on the Market Depth window. This color is then used in combination with the Market Depth: Ask Gradient End Color to create the gradient of colors used for the Ask data on the Market Depth Window between the current Ask Price and the highest Ask Price displayed in the window. This sets the color of the last (highest) Ask Price on the Market Depth Window. This color is then used in combination with the Market Depth: Ask Gradient Start Color to create the gradient of colors used for the Ask data on the Market Depth Window between the highest Ask Price and the current Ask Price displayed in the window. This sets the color of the text in the Market Depth window. This sets the color of the background of the Market Depth window. This is the color of the areas of the Market Depth window where no information is displayed. This sets the color of the grid lines of the Market Depth window. The descriptions for items related to the Chart DOM can be found in the Customizing Trading Graphics for the Chart DOM documentation. This tab will only be present when chart specific graphics settings are being modified for a chart. The descriptions for items related to the Trade DOM can be found in the Customizing Trading Graphics for the Trade DOM documentation. This tab will only be present when chart specific graphics settings are being modified for a Trade DOM. The descriptions for items related to the Trade Window can be found in the Customizing Trading Graphics for the Trade Window documentation. The descriptions for items related to general Trading can be found in the Customizing Trading Graphics for Trading documentation. This section contains settings for the color, line style, and line width for items on the Quote Board window. This tab is only available on the global graphics settings window. None of these items can be set for an individual chart. Refer to the information for Quote Board >> Setting Colors. Refer to the information for Quote Board >> Setting Colors. Refer to the information for Quote Board >> Setting Colors. Refer to the information for Quote Board >> Setting Colors. Refer to the information for Quote Board >> Setting Colors. Refer to the information for Quote Board >> Setting Colors. Refer to the information for Quote Board >> Setting Colors. Refer to the information for Quote Board >> Setting Colors. Refer to the information for Quote Board >> Setting Colors. Refer to the information for Quote Board >> Setting Colors. Refer to the information for Quote Board >> Setting Colors. Refer to the information for Quote Board >> Setting Colors. This section contains settings for the color, line style, and line width for items on the Study Summary window. This sets the default background color for cells in the Study Summary Window. For information on the background coloring of the Study Summary cells, refer to Number Text and Color Control For Study Summary Subgraph Cells. This sets the color of the Gridlines that are displayed in the Study Summary Window. This sets the background color for cells in the Study Summary Window that are highlighted when the row is selected. For more information on how to color the background of just the first cell or all cells in a row when selected, refer to Selection Highlights All Columns. This sets the background color for cells that have a True alert condition associated with them. For more information on the background coloring of the Study Summary cells, refer to Number Text and Color Control For Study Summary Subgraph Cells. This section contains settings for the color, line style, and line width for Bid Ask Bars. This tab will not be present on the chart specific graphics settings for a Trade DOM, as the Trade DOM can not display bars and therefore the Bid Ask Bars can not be utilized. This sets the ask color of a Bid Ask Bar when the total volume of the bar is equal to or greater than 75% of the largest volume range within the chart. This sets the ask color of a Bid Ask Bar when the total volume of the bar is equal to or greater than 50% and less than 75% of the largest Volume range within the chart. This sets the Ask color of a Bid Ask Bar when the total volume of the bar is equal to or greater than 25% and less than 50% of the largest Volume range within the chart. This sets the Ask color of a Bid Ask Bar when the total volume of the bar is less than 25% of the the largest Volume range within the chart. This sets the Bid color of a Bid Ask Bar when the total volume of the bar is equal to or greater than 75% of the largest volume range within the chart. This sets the Bid color of a Bid Ask Bar when the total volume of the bar is equal to or greater than 50% and less than 75% of the largest Volume range within the chart. This sets the Bid Color of a Bid Ask Bar when the total volume of the bar is equal to or greater than 25% and less than 50% of the largest Volume range within the chart. This sets the Bid color of a Bid Ask Bar whe the total volume of the bar is less than 25% of the largest Volume range within the chart. This section contains settings for the color, line style, and line width for spreadsheet related items. This tab is only available on the global graphics settings window. None of these items can be set for an individual chart. This sets the default text color for spreadsheets. This sets the default background color for spreadsheets. This sets the default color, thickness, and line style for the cell border of the active cell on a spreadsheet. This sets the color of the highlight that is used when a group of cells is selected. This sets the color of the marker that is placed in the upper right corner of a spreadsheet cell that denotes that the cell contains a function. This sets the color of the marker that is placed in the lower left corner of a spreadsheet cell that denotes that there is a comment for the cell. This sets the color of the text for a comment associated with a spreadsheet cell. This sets the color of the background for a comment associated with a spreadsheet cell. This sets the color, thickness, and line style for the spreadsheet grid. This section contains width settings for items related to the scales. This tab will not be present on the chart specific graphics settings for a Trade DOM, as the Trade DOM does not utilize the items in this section. This sets the width (length) of the dashes displayed to the left of the prices in the values scale. This sets the height (thickness) of the dashes displayed to the left of the prices in the values scale. This sets the spacing between the dashes displayed to the left of the prices and the prices themselves in the values scale. This sets the width (thickness) of the dashes displayed above the times in the time scale. This sets the height (length) of the dashes displayed above the times in the time scale. This sets the spacing between the dashes displayed above the times and the times themselves in the time scale. This sets the spacing between the bottom of the chart window and the scales (both vertical and horizontal). This does not affect the Chart Settings Indicator in the lower right corner of the chart window. This section is used to save and load graphics configurations. Up to 20 different configurations can be setup. This section is not available on the Graphics Settings for Chart - Colors window, as specific configurations can not be setup per chart. In order to use a configuration for a chart, load the desired global configuration and use the Copy from Global button in the Settings section on the chart specific graphics settings. Selecting a configuration from this list sets that configuration as the configuration that will be used when selecting either the Save Settings or Load Settings buttons. When selected, this button saves all of the settings that are part of the Graphics Settings - Colors to the selected configuration in the Saved Graphics Settings field. When this button is selected, a new window will appear asking for confirmation to save the settings to that configuration, and giving an option to change the name of the configuration. Change the name, if desired, and select Yes to save the configuration or No to not save the configuration. This does not save any of the items that are part of the Graphics Settings - Font or Graphics Settings - Other. When selected, this button loads all of the settings that were saved in the selected configuration in the Saved Graphics Settings field. Saved graphics configurations include items that are part of the Graphics Settings - Colors window. It does not include items that are part of the Graphics Settings - Font or Graphics Settings - Other.Chart
Chart Text
Chart Values Scale Text Color
Chart Time Scale Text Color
Chart Background
Chart Values Scale Background
Chart Time Scale Background
Chart Grid
Chart Grid Secondary
Chart Rollover Date Line
Chart Scale Border
Region Dividing Line
Chart Selected Tab Color
Chart Selected Tab Text Color
Chart Selected Tab Border Color
Chart Tab Color
Chart Tab Text Color
Chart Tab Control Background Color
Last Trade Price Box
Last Trade Price Box Foreground
Last Trade Price Box Outline
Bar High-Low Down
Bar High-Low Up
Bar Open
Bar Close
Line On Close / Line On Open / Mountain
Candlestick Up Outline
Candlestick Up Fill
Candlestick Down Outline
Candlestick Down Fill
Net Change Up
Net Change Down
Bid Ask Average Line
Scroll End Color
Scroll Not End Color
Alert Highlight Color
Settings
Use Global Graphics Settings Instead of These Settings
Copy to Global (Chart >> Graphics Settings >> Graphics Settings for Chart - Colors)
Copy from Global (Chart >> Graphics Settings - Chart)
Window
Main Window Background
Window Title Bar
Inactive Window Title Bar
Window Title Bar Text
Inactive Window Title Bar Text
Window Move Rectangle Color and Width
Window Border
Window Inactive Border
Window Background
Window System Minimize Maximize Close Foreground
Window System Minimize Maximize Close Background
Chartbook
Chartbook Selected Tab Color
Chartbook Selected Tab Text Color
Chartbook Tab Color
Chartbook Tab Text Color
Chartbook Tab Control Background Color
Chat Window
Chat Window: Contacts Background Color
Chat Window: Contacts Text Color
Chat Window: Messages Background Color
Chat Window: Received Message Name Background Color
Chat Window: Received Message Name Text Color
Chat Window: Received Message Background Color
Chat Window: Received Message Text Color
Chat Window: Received Filename Text Color
Chat Window: Received Message Timestamp and Status Text Color
Chat Window: Sent Message Name Background Color
Chat Window: Sent Message Name Text Color
Chat Window: Sent Message Background Color
Chat Window: Sent Message Text Color
Chat Window: Sent Message Filename Text Color
Chat Window: Sent Message Timestamp And Status Text Color
Chat Window: New Message Text
Chat Window: New Message Background
Settings Window
Settings Windows: Item Text Foreground Color
Settings Windows: Item Text Background Color
Setings Windows: Section Title Foreground Color
Settings Windows: Section Title Background Color
SettingsWindows: Highlight Color
Settings Windows: 'Yes' Text Color
Settings Windows: 'No' Text Color
Settings Windows: Button Foreground Color
Settings Windows: Button Background Color
Settings Windows: Pushed Button Foreground Color
Settings Windows: Pushed Button Background Color
Settings Windows: Read-Only Setting Description Foreground Color
Settings Windows: Read-Only Setting Description Background Color
Settings Windows: Read-Only Setting Value Foreground Color
Settings Windows: Read-Only Setting Value Background Color
Settings Windows: Grid Line
Chart Values
Chart Values Window Default Text Color
Chart Values Window Background Color
Chart Values: Color of the Price and Time Boxes
Chart Values: Price and Time Boxes Text Color
Chart Values: Crosshair
Time & Sales
Time and Sales: Bid Trades Background
Time and Sales: Bid Trades Text
Time and Sales: Below Bid Trades Background
Time and Sales: Below Bid Trades Text
Time and Sales: Ask Trades Background
Time and Sales: Ask Trades Text
Time and Sales: Above Ask Trades Background
Time and Sales: Above Ask Trades Text
Time and Sales: Bid and Ask Records Trades Background
Time and Sales: Bid and Ask Records Trades Text
Time and Sales: Grid
Time and Sales: Bid Highlight Color
Time and Sales: Bid Highlight Text Color
Time and Sales: Ask Highlight Color
Time and Sales: Ask Highlight Text Color
ListBox
List Box Header Color
List Box Header Divider Color
List Box Header Border Color
List Box Adjust Header Width Divider Color
List Box Header Text Color
Status
Status: Downloading Continuous Contract Data Foreground Color
Status: Downloading Continuous Contract Data Background Color
Status: Waiting to Download Historical Data Foreground Color
Status: Waiting to Download Historical Data Background Color
Status: Historical Download Skipped Foreground Color
Status: Historical Download Skipped Background Color
Status: Downloading Historical Data Foreground Color
Status: Downloading Historical Data Background Color
Status: Historical Download Complete Foreground Color
Status: Historical Download Complete Background Color
Status: Download Failed Foreground Color
Status: Download Failed Background Color
Status: Download Canceled Foreground Color
Status: Download Canceled Background Color
Real Time Symbol Status: Invalid Status Foreground Color
Real Time Symbol Status: Invalid Status Background Color
Control Bars
Control Bar: Enabled Button Text
Control Bar: Disabled Button Text
Control Bar: Button Default Background
Control Bar: Background
Control Bar Status Not Connected
Control Bar Status Connecting
Control Bar Status Waiting To Reconnect
Control Bar Status Connected
Control Bar: Status Text
Control Bar: Text Control Text
Linking
Link Number Color #[1-16]
General
General Text Window Background Color
General Text Window Foreground Color
General Text Window Highlight Color
General Text Window Alert Color
General Text Window Grid Color
Market Depth
DOM Graph Ask Lines Begin Color
DOM Graph Ask Lines End Color
DOM Graph Bid Lines Begin Color
DOM Graph Bid Lines End Color
Market Depth: Bid Gradient Start Color
Market Depth: Bid Gradient End Color
Market Depth: Ask Gradient Start Color
Market Depth: Ask Gradient End Color
Market Depth: Text Color
MarketDepth: Background Color
Market Depth: Grid Line
Chart DOM
Trade DOM
Trade Window
Trading
Quote Board
Quote Board: Background
Quote Board: Foreground/Text
Quote Board: Price Change Up
Quote Board: Price Change Down
Quote Board: New Low Highlight
Quote Board: Gridlines
Quote Board: Selected Symbol
Quote Board: Blank Row Background
Quote Board: Label Row Background
Quote Board: Label Row Foreground/Text
Quote Board: Selected Border Highlight
Quote Board: Alert Triggered Highlight
Study Summary
Study Summary: Background
Study Summary: Gridlines
Study Summary: Selected Row
Study Summary: Alert True Background
Bid Ask Bars
Bid Ask Bar: Large Volume Ask Bar
Bid Ask Bar: Medium-Large Volume Ask Color
Bid Ask Bar: Light-Medium Volume Ask Color
Bid Ask Bar: Light Volume Ask Color
Bid Ask Bar: Large Volume Bid Color
Bid Ask Bar: Medium-Large Volume Bid Color
Bid Ask Bar: Light-Medium Volume Bid Color
Bid Ask Bar: Light Volume Bid Color
Spreadsheet
Spreadsheet Default Text Color
Spreadsheet Default Background Color
Spreadsheet Active Cell Border
Spreadsheet Selection Highlight Color
Spreadsheet Function Marker Color
Spreadsheet Comment Marker Color
Spreadsheet Comment Text Color
Spreadsheet Comment Background Color
Spreadsheet Grid
Chart Scale
Chart Values Scale Dash Width
Chart Values Scale Dash Height
Chart Values Scale Dash Margin
Chart Time Scale Dash Width
Chart Time Scale Dash Height
Chart Time Scale Dash Margin
Chart Scale Padding
Saved Settings
Saved Graphics Settings
[Save Settings]
[Load Settings]
Fonts
Open the Chart >> Graphics Settings >> Graphics Settings >> Graphics Settings for Chart - Font window to change the Font settings for the active chart or Trading DOM if it is set to use its own specific graphic settings.
Or open the Global Settings >> Graphics Settings - Font window to change the Font settings globally for all Charts and Trading DOMs which are set to use the Global settings.
For additional details, refer to the Introduction section.
Refer to the Instructions for Graphics Settings - Fonts section for instructions on how to use this window.
If changes to the Font Size are not going into effect, then choose a different Font name and then change the Size again because it is possible the particular Font name currently selected is not properly supported on your operating system.
If changes to the Chart Text do not go into effect and you are using the Global Settings >> Graphics Settings - Font window to change the Chart Text, then the chart is set to use its own independent Graphics Settings. For more information, refer to Introduction on this page.
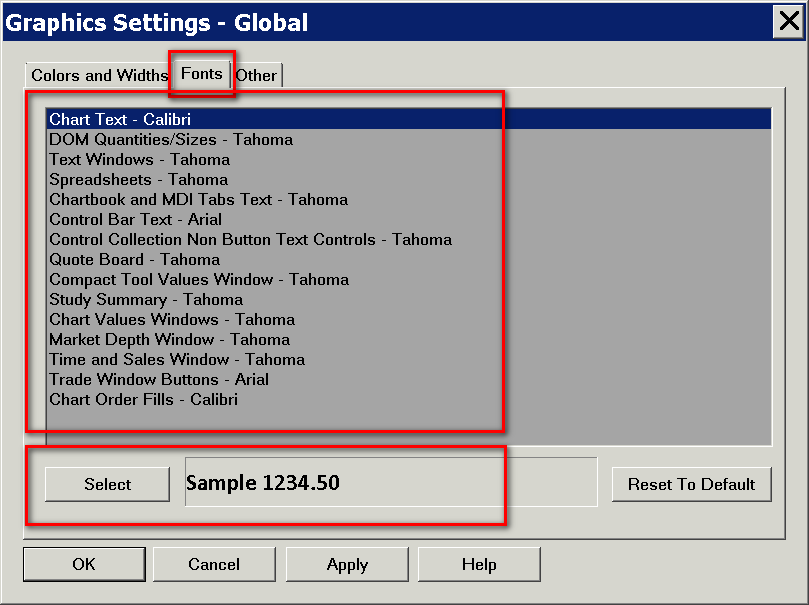
When you select a particular Size for a particular Font in Sierra Chart, you are selecting it based on a Point Size, and the Point Size is internally stored in Sierra Chart and transformed during actual drawing to the actual required pixel height, based upon the Dots per Inch (DPI) setting in the operating system.
After changing the Chart Text font size, to resize the Values Scale column on a chart to fit the new font size, select Chart >> Recalculate.
Below are descriptions of each of the available Font settings in the list of fonts that can be changed.
Chart Text
The Chart Text font setting changes the font properties for all charts if using the Global Settings >> Graphics Settings - Font window.
The Chart Text font setting changes the font properties for the active chart if using Chart >> Graphics Settings >> Graphics Settings for Chart - Font window.
This font applies to either the selected chart or is global depending upon whether the chart specific or Global Graphics settings window has been opened.
DOM Quantities/Sizes
This changes the font properties for the Chart or Trading DOM Quantities and Sizes.
This font applies to either the selected chart or is global depending upon whether the chart specific or Global Graphics settings window has been opened.
Text Windows
This changes the font properties for the following windows:
- Window >> Current Quote Window
- Window >> Chart Values Window
- Window >> Tool Values Window
- Data Feed Status on the Control Bar
- Window >> Alerts Manager
- Window >> Trade Service Log
- Window >> Message Log
- Trade >> Trade Activity Log (Trade Activity, Trade Statistics, Trades, Trade Stats for Charts)
Spreadsheets
This changes the font properties for Spreadsheets.
Chartbook and MDI Tabs Text
This changes the font properties for Chartbooks and MDI Tabs Text.
Control Bar Text
This changes the font properties for the button text and the Status Bar on the Control Bar.
Control Collection Non-Button Text Controls
This changes the font properties for Control Bar items that are not a button and display text information, such as the Status Bar.
Control Collection Non-Button Combo Controls
This changes the font properties for Control Bar items that are not a button, but rather give a list selection, such as the Watch List.
Quote Board
This changes the font properties for text on the Quote Board.
Compact Tool Values Window
This changes the font properties for the Compact Tool Values Window.
Study Summary Window
This changes the font properties for the Study Summary window which is opened through File >> Open Study Summary Window.
Chart Values Window
This changes the font properties for the Chart Values window.
Market Depth Window
This changes the font properties for the Market Depth window.
This font applies to either the selected chart or is global depending upon whether the chart specific or Global Graphics settings window has been opened.
Time and Sales Window
This changes the font properties for the Time and Sales window.
This font applies to either the selected chart or is global depending upon whether the chart specific or Global Graphics settings window has been opened.
Chart Order Fills
This changes the font properties for the chart order fills displayed on a chart.
This font applies to either the selected chart or is global depending upon whether the chart specific or Global Graphics settings window has been opened.
Trade Window Buttons
This sets the font properties for the buttons on the Trade Window.
List Box Header Text
This changes the font properties for the Header text of List Box windows.
Settings Windows
This changes the font properties for the Settings Windows. This includes windows like Chart >> Chart Settings and Global Settings >> General Settings.
This font also sets the font for the Analysis >> Build Custom Studies DLL window.
Tool Drawing Configuration Window
This sets the font properties for the tool configuration/properties windows.
Chat Window
This sets the font properties for the areas of the Chat Window other than the open chat names and chat messages.
Chat Window Open Chats
This sets the font properties for the open chat names int he Chat Window.
Chat Window Message Text
This sets the font properties for the messages in the Chat Window.
Control Layout Window
This sets the font properties for Control Layout Windows, such as the Manage Tool Drawings window.
Window Title Bar
This sets the font properties for the font used in the title bar of MDI Windows when the window is active.
Inactive Window Title Bar
This sets the font properties for the font used in the title bar of MDI Windows when the window is inactive.
Hover Text
This sets the font properties for the text displayed when the pointer is above an item, such as a Control Bar button, that shows a secondary text.
Global Default Font
This sets a Global Default Font to which all fonts can be set to by using the Reset All Fonts to Global Default button.
Reset All Fonts to Their Own Default
Selecting this button will reset all the fonts back to their original default setting.
Reset All Fonts to Global Default
Selecting this button will reset all the fonts to be the same as the Global Default Font.
Graphics Settings - Other
This section contains the items found on the Graphics Settings - Other Window.
General Graphics
This section contains general graphics settings.
Candlestick Width %
This sets the width of a candlestick's body as a percentage. Where 100% would mean the ccandlestick body would extend to the adjacent candlestick body on either side.
The Chart >> Increase Bar Width and Chart >> Decrease Bar Width menu commands also alter the chart bar width relative to this percentage setting. To go back to the default width which corresponds to this percentage setting, repeatedly use Chart >> Decrease Bar Width until you go down to the minimum width which will equal the specified percentage.
OHLC Width %
This sets the width of an OHLC bar as a percentage. Where 100% would mean the Open and Close dashes would extend to the adjacent bar Open and Close dashes on either side.
The Chart >> Increase Bar Width and Chart >> Decrease Bar Width menu commands also alter the chart bar width relative to this percentage setting. To go back to the default width which corresponds to this percentage setting, repeatedly use Chart >> Decrease Bar Width until you go down to the minimum width which will equal the specified percentage.
Price Volume Width % (Global Settings >> Graphics Settings - Other >> General Graphics)
This sets the overall width of a Price Volume bar body as a percentage. Where 100% would mean the Price Volume Bar body would occupy 100% of the width allocated for a chart bar which is based upon the current chart bar spacing.
Arrow Draw Style Max Width
Sets the maximum width of the Arrow Up, Arrow Down, Arrow Left, and Arrow Right Draw Styles in the Subgraphs tab of Study Settings Window.
Default Chart Bar Spacing
This setting sets the default chart bar spacing in pixels. This applies to new charts that are opened and also applies to a chart when Chart >> Reset Bar Size/Spacing/Scale is selected.
Default Right Side Fill Space
This setting sets the default right side fill space. Refer to Right Side Fill Space for more information about this feature.
When the fill space is not locked and you press the End key on the keyboard, then the fill space will be set to the number of bars according to this setting.
To lock the fill space which has been set by the Default Right Side Fill Space setting so it is not reduced to 0 as new bars are added to the chart, refer to Scrolling the Chart.
Color Entire OHLC Bar the High/Low Color
When this option is enabled, the Open and Close dashes of an OHLC (Open High Low Close) bar will be colored the same as the High to Low portion of the bar.
The colors of the High to Low portion of the bar are set with the Bar High-Low Up/Down color settings.
Color Candlestick High-Low Using the Outline Colors
This setting determines the rule for coloring the High to Low portion of a Candlestick bar.
If it is disabled, the Bar High-Low Up color, set through the Colors and Widths list, is used when the Close of the candlestick is greater than or equal to the Open of the candlestick.
If it is disabled, the Bar High-Low Down color, set through the Colors and Widths list, is used when the Close of the candlestick is less than the Open.
If it is enabled, then High to Low portion of the bar, the wick, uses the Candlestick Outline color instead.
Draw Bid and Ask Lines at Last Bar When Enabled
When this option is enabled and Chart >> Show Bid and Ask Lines is enabled, then the bid and ask lines are drawn on the last in the chart, instead of at the edge of the price scale on the right side of the chart. This option only applies when Chart >> Show Bid and Ask Lines is enabled.
Up/Down Coloring for OHLC Bars Based on Previous and Current Close
When this option is enabled, and the Graph Draw Type in the chart is set to OHLC Bars (OHLC stands for Open, High, Low, Close), then the High to Low portion of a chart bar will be colored the Bar High-Low Up Color if the close of the bar is greater than or equal to the close of the previous bar.
The High to Low portion of a bar will be colored the Bar High-Low Down Color if the close of the bar is less than the close of the previous bar.
When this option is disabled, then the High to Low portion of OHLC Bars are colored based upon the comparison of the Open to Close within the same bar.
This setting also applies to Candlestick Bars and only affects the High to Low portion of the chart bar.
Underline Chart Header Field Names
When this option is enabled, then the field names on the chart header at the top of the chart are underlined to make them more clear.
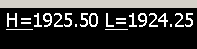
Bold DOM Last Price
When this option is enabled, then the last trade price in the Trade DOM is bolded.
OpenGL
Maximum Fonts for OpenGL
The Maximum Fonts for OpenGL setting specifies the maximum amount of font face and font size combinations that will have character glyphs pregenerated and kept in memory.
The default is 20. You may want to increase this to 30 or 40 as needed.
If this is too small of a number and there are a lot of different font face and font size configurations being used, then this will result in poor performance. However, if this is a larger number there can also be poor performance.
Changes to this setting require a restart of Sierra Chart.
Use OpenGL for Chart Graphics
When this option is enabled, then the OpenGL graphics library provided by the operating system and the video drivers on your system is used for graphics output which means that the graphics output is hardware accelerated.
Any changes to this option requires that Sierra Chart is restarted for it to go into effect.
It is recommended not to specify through the operating system or your video driver settings what GPU Sierra Chart should be using. The operating system or driver needs to make that decision itself. This is for performance reasons. It will know best.
For best performance a particular chart must not be contained in more than one physical display if those displays use a different GPU. If two or more displays a chart is contained within are driven by different GPUs, you would create a situation where there are inefficiencies because the operating system has to start transferring resulting graphics output between different GPUs. A chart can only be rendered within a single GPU.
It is not efficient to have a GPU do the rendering, and then have this output transferred to another display which uses a different GPU.
When changing which GPU Sierra Chart is assigned to, you do need to restart Sierra Chart so there is a re-initialization of OpenGL on the Sierra Chart side.
If you enable the OpenGL option and restart Sierra Chart and then this OpenGL option is automatically disabled, it means there was a failure to initialize OpenGL on your system.
Known Issue: It has been observed that when using the OpenGL option, sometimes when scrolling the chart the chart does not visibly update. This is usually resolved by directly grabbing the scrollbar box and moving the chart left or right. There are other conditions, which can cause a chart not to visibly update when using OpenGL.
Based on user feedback it is strongly recommended to disable Threaded Optimization in the OpenGL settings for your video driver. This is not a Sierra Chart setting but it is a setting in the video driver settings for your graphics adapter.
OpenGL version 3.3 and higher is supported with Sierra Chart.
For an understanding of text with OpenGL, refer to Text Display when using Open GL.
Use Compatible OpenGL Profile
Enable OpenGL Debug Output
When this option is set to Yes, then additional debugging output related to OpenGL will be output to the Message Log.
It is not recommended to set this to Yes unless requested to do so by Sierra Chart Support.
Additional Height Percent for OpenGL Font Glyph
Active GPU for OpenGL
Small Widths
This section contains settings that control various size settings, including maximum or minimum sizes and spacing.
All items on this page are defined in pixels.
Control Bar Text Control Text Padding
This controls the amount of space above and below the text in a Control Bar Text Control item.
The following control bar items are affected by this setting:
- Status Bar
- Position Data Text
- Position Open Profit/Loss
- Daily/Net Profit/Loss
If this value causes the Text Control item to be the largest button in the Control Bar, then this will cause the entire Control Bar to expand all the buttons to match that height.
A Change to this setting requires that Sierra Chart be restarted in order for the change to take effect.
Control Bars and Tab Control Content Horizontal Padding
This controls the amount of space that is set to the left and right of the text in Control Bar Buttons, Chart Tabs, and Chartbook Tabs.
A change to this setting requires that Sierra Cahrt be restarted in order for the change to take effect.
Control Bars and Tab Control Content Vertical Padding
This controls the amount of space that is set above and below the text in the Control Bar Buttons, Chart Tabs, and Chartbook Tabs.
A change to this setting requires that Sierra Chart be restarted in order for the change to take effect.
Control Bars and Tab Control Separator Size in Pixels
This controls the amount of space that is defined for the Control Bar Separator.
A change to this setting requires that Sierra Chart be restarted in order for the change to take effect.
Control Bars and Tab Control Caption Height in Pixels
Control Bars and Tab Control Border Height in Pixels
Control Bars and Tab Control Border Width in Pixels
Control Bars and Tab Control Margin in Pixels
Control Bars and Tab Control Default Text Height
Control Bars and Tab Control Default Text Width
Control Bars Max Height in Pixels
Control Bars Max Width in Pixels
Control Bars Floating Rectangle Top Left Offset
This sets the default vertical and horizontal location of the upper left corner of a Control Bar when it is set to Float. This position is relative to the monitor's upper left corner and not to the Sierra Chart window.
Once a floating control bar has been moved, then it will continue to open at the position to which it was moved. Selecting Chart >> Reset Child Windows will set floating control bars back to the default position as defined by this setting.
A change to this setting requires that Sierra Chart be restarted in order for the change to take effect.
Tab Control Indicator Width
This sets the width of the indicator that displays when a tab is being moved.
A change to this setting requires that Sierra Chart be restarted in order for the change to take effect.
Chart Price Graph Area Minimum Width
Chart Price Graph Area Minimum Width for Trade DOM
Selection Margin for Adjusting Chart Regions
This sets how close the pointer needs to be to the Region Adjustment Line in order for the system to allow for the region height to be adjusted.
Trade Statistics for Chart List Box Column Default Width
Symbol Selection Window Column Default Width
File Open Save Dialog Column Default Width
Numbers Bars Volume Profile Bar Minimum Width
This sets the smallest size that a Volume Bar can be within the Numbers Bars study.
Setting this to too small of a value could cause bars for very low values to not display at all.
Numbers Bars Pullback Separator Width
This sets the amount of space that is placed between the last standard Numbers Bars column in the chart and the Pullback column separator.
Numbers Bars Minimum Column Width
This sets the smallest width that a Numbers Bars column can be.
Numbers Bars Open to Close Box Width
This sets the size of the Open to Close Boxes when they are displayed on a Numbers Bars chart.
Line Label Edge Margin Width
This sets the distance the Name Label and/or Value Label will be offset from the left edge of the chart when the Horizontal Align option is set to Left Edge.
Zoom In Tool Line Width
This sets the width of the lines that make up the Zoom In rectangle to define the area to zoom into.
Study Subgraph Tick Size Rectangle Minimum Padding
This sets the distance from the edge of the bar drawing area to where a Tick Size Rectangle Draw Style will start to be drawn. A setting of 0 sets the Tick Size Rectangle at the edge of the bar area.
Study Subgraph Tick Size Rectangle Maximum Padding
This sets the maximum value that will be used for the Study Subgraph Tick Size Rectangle Minimum Padding.
Study Subgraph Color Background At Price Minimum Height
This sets the smallest height to which a subgraph using the Color Background at Price Draw Style will be displayed, regardless of the actual distance in prices set in the Values Scale.
Study Subgraph Transparent Tick Size Rectangle Minimum Height
This sets the smallest height to which a subgraph using the Transparent Tick Size Rectangle Draw Style will be displayed, regardless of the actual distance in prices set in the Values Scale.
List Box Header Move Highlight Rectangle Width
Chart Horizontal Grid Spacing Minimum Text Height Reduction
Chart Loading Progress Bar Height
This sets the height of the progress bar that is displayed when a chart is loading.
Studies Window Available Studies List Width
Manage Chart Drawing Window List Box Margin
This sets the height of the spacing between the list of drawings and the buttons at the bottom of the Manage Chart Drawings Window.
Chart DOM Additional Vertical Padding for Market Depth Summary Values
This sets the distance between the last Bid/Ask market depth value and the Bid/Ask Market Depth Total when it is displayed.
Chart DOM Columns Adjust Highlight Width
This sets the width of the highlighted area in a Chart/Trade DOM to change the width of a column.
Chart DOM Header Resize Margin for Pointer
This sets the distance the pointer must be from the edge of a Chart/Trade DOM column in order for the highlighted area to change the width of a column for that highlight to show up.
Chart DOM Line Graphs Text Horizontal Shift
This sets the distance between the left side of the DOM and the lines displayed for the DOM Graph.
Chart DOM Graph Lines Text Padding
This sets the distance from the Top and Bottom of the DOM Graph to where the summary information is displayed.
Chart Bid Ask Lines Minimum Horizontal Width
This sets the length of the Bid and Ask Lines when they are displayed on a chart.
Chart Bid Ask Lines Minimum Width
This sets the minimum length that the Bid and Ask Lines can be on a chart.
Chart Bid Ask Lines Maximum Width
This sets the maximum length that the Bid and Ask Lines can be on a chart.
Chart Drawing Minimum Region Height
This sets the minimum size that a region must be in order for the graphs, scales, drawings, and grid to be displayed in that region. In other words, if the region is set to be smaller than this value, then nothing will be displayed in that region.
Chart Drawing Line Marker Minimum Width
This sets the size of the anchor marker for drawings that support displaying this item.
Chart Drawing Bar Spacing Minimum Width for Marker Drawing Width Calculation
This sets the minimum size that a Marker Drawing can be when the option for Marker Size Based on Bar Spacing is set to Yes. Therefore, if the bar spacing is smaller than this setting, then the marker will be set to the size of this setting.
Chart Drawing Ellipse Highlight Minimum Width
This sets the minimum size that an Ellipse chart drawing can be. When a new Ellipse is being drawn, it will start as a circle with a diameter that is this this setting's value in pixels.
Chart Drawing Line Handle Minimum Radius
This sets the diameter of the dots that display within drawing when it is selected helping to denote the chosen drawing.
These are different and separate from the anchor points. The diameter of the anchors is controlled by the Chart Drawing Anchor Minimum Radius.
Chart Drawing Anchor Minimum Radius
This sets the diameter of the anchor point circles that are displayed while drawing and after selecting a drawing.
Chart Trading Order Line Left Offset
This sets the distance from the left side of the chart at which order/position lines will be drawn when the setting for Align Trade Drawings Text to Right is set to No.
This is also the starting position of the placement of the order/position lines with respect to the setting for Trade Drawing Left Align %. This means that setting the Trade Drawing Left Align % to 50% will move the order/position lines halfway between the Chart Trading Order Line Offset and the right edge of the chart.
Chart Trading Association Line Offset
Chart Trading Order Or Position Line Button Offset
Chart Trading Order Fill Bar High Low Offset
This sets an additional distance that the Order Fill displays will be shown on the chart when the chart is set to Show Order Fills.
This is not the actual distance at which the Order Fill is placed. There is a built-in method to place the Order Fill notations to minimize their impact on bars. This setting offsets the notations an additional amount beyond the standard placement.
Chart Trading Position Line Horizontal Offset
Chart Trading Filled Order Rectangle Offset
Chart Tool Values Window Default Rectangle Horizontal Offset
Chart Tool Values Window Default Rectangle Vertical Offset
Chart Tool Values Window Default Rectangle Width
Chart Tool Values Window Default Rectangle Height
Compact Values Window Initial Horizontal Offset
Compact Values Window Initial Vertical Offset
Compact Values Window Initial Width
Compact Values Window Initial Height
Volume by Price Profile Spacing
This sets the distance between Volume by Price profiles in pixels, when multiple profiles are aligned to the far right.
Volume by Price Minimum Bar Width
This sets the minimum size that a Volume by Price profile bar can be.
Setting this to a value of 0 can cause some bars that have the smallest volume value to not display.
List Box Default Column Width
List Box Minimum Column Width
This sets the smallest size that a List Box column can be set to.
List Box Header Extra Height
This sets the amount of space above and below the header titles in a List Box.
A setting of zero means that there is no additional spacing and the header height is set by the size of the text in the header.
List Box Header Padding
This sets the horizontal offset, from the left, for the header text per column in a List Box.
A setting of zero means that the text for each header column is aligned fully to the left of the column.
List Box Text Horizontal Padding
List Box Text Top Padding
This sets the amount of space above and below the text in the fields for a List Box.
A setting of zero means that there is no additional spacing and the field height is set by the size of the text in the field.
List Box Text Bottom Padding
List Box Header Resize Margin for Pointer
This sets how far the pointer can be from a column separator in a list box header when the resize indicator will display and the pointer can be used to resize the column.
The lower the value, the closer the pointer must be to the actual separator item in the list box header. The larger the value, the farther away the pointer can be to the actual separator item in the list box header.
Chart Bar Widths
There are several ways in which the width of chart bars are affected. These are explained below.
Changing the High-Low Draw Width
The width of the High-Low portion of a chart bar can be modified with the Colors settings on the Graphics Settings window. You will want to modify the width of Bar High-Low Down and Bar High-Low Up in the list.
Increasing and Decreasing the Chart Bar Spacing
As you increase the chart bar spacing, the width of the bars will automatically become wider. As you decrease the chart bar spacing, the width of the bars will automatically become narrower. Refer to the Changing Bar Spacing and Zooming In section for instructions to change bar spacing.
Changing the Candlestick Width % or OHLC Width %
Increasing or decreasing the Candlestick Width % in the Global Settings >> Graphics Settings - Other >> General Graphics tab will increase or decrease the width of candlesticks respectively.
Increasing or decreasing the OHLC Width % in the Global Settings >> Graphics Settings - Other >> General Graphics tab will increase or decrease the width of OHLC bars respectively.
How Chart Bar and Candlestick Up/Down is Determined
In the case of the Candlestick bar, it is considered and up bar when the Close value is higher than the Open value within the same bar. It is considered a down bar when the Open value is higher than the Close value within the same bar. The same is true for a standard OHLC bar when Graphics Settings - Other >> General Graphics >> Up/Down Coloring for OHLC Bars Based on Previous and Current Close is set to No. Otherwise, the coloring is based on the comparison of the bar) to the previous close value.
In the case where the Open and Close are equal, the Candlestick or OHLC bar coloring will use the same coloring as the prior chart bar. If in that prior bar, the Open and Close are equal, then there is an iteration back, up to a certain number of bars, until there is a difference between the Open and Close. The relationship between those is what sets the coloring for the subsequent bars that have the same Open and Close values.
Tasks
This section documents the procedures to perform various tasks related to Graphics Settings.
Independent Coloring and Widths for Candlesticks High-Low Bars (Wicks)
- Open the Graphics Settings - Other window as explained in the Introduction section.
- Select the General Graphics tab.
- Set Color Candlestick High-Low Using the Outline Colors to No.
- Open the Graphics Settings - Colors window as explained in the Introduction section. Select the Chart tab.
- In the list, set the color and width for Bar High-Low Down and Bar High-Low Up. These settings will now apply to candlesticks.
- Press OK to close Graphics Settings window.
Setting the Background Color, Text Color, and Font for Text Only Windows
Follow the instructions below to set the Background Color, Text Color, Grid Color, and Font setting for the following windows:
- Trade >> Trade Orders Window
- Trade >> Trade Positions Window
- Trade >> Account Balances Window
- Trade >> Trade Activity Log
- Trade >> Trade Service Log
- Window >> Message Log
- Window >> Alerts Manager
- All File Open and Save Windows
- Service Connection Error Window
When the Foreground and Background colors for General Text Windows are set to the same or similar colors, the text will not be visible or will be hardly visible. There needs to be sufficient contrast between the Foreground and Background colors in order to see the text properly.
Instructions:
- Open the Graphics Settings - Colors window as explained in the Introduction section. Select the General tab.
- Select the General Text Window Background Color line.
- Press the Select Color button.
- Select the color that you want to use for the background and press OK.
- In the list of objects, select the General Text Window Foreground Color line.
- Press the Select Color button for this line.
- Select the color that you want to use for the text and press OK.
- Set the General Text Window Highlight Color and General Text Window Grid Color as required.
- In the case of trading windows which display a Long or Short Position quantity or a Profit/Loss value, change the Position/Trades Tabs Long/Profit, Position/Trades Tabs Short/Loss color settings as required.
- Select OK to close the Graphics Settings - Colors window.
- Open the Graphics Settings - Fonts window as explained in the Introduction section.
- Select the Text Windows item.
- Press the button displaying the current selectd font and adjust the Font properties as you require.
- Press OK to close the Graphics Settings - Font window.
Hollow Renko Bricks
Follow the instructions below to display hollow Renko Bricks with Wicks by changing the Graphics Settings for the Candlestick Bar Fill Colors.
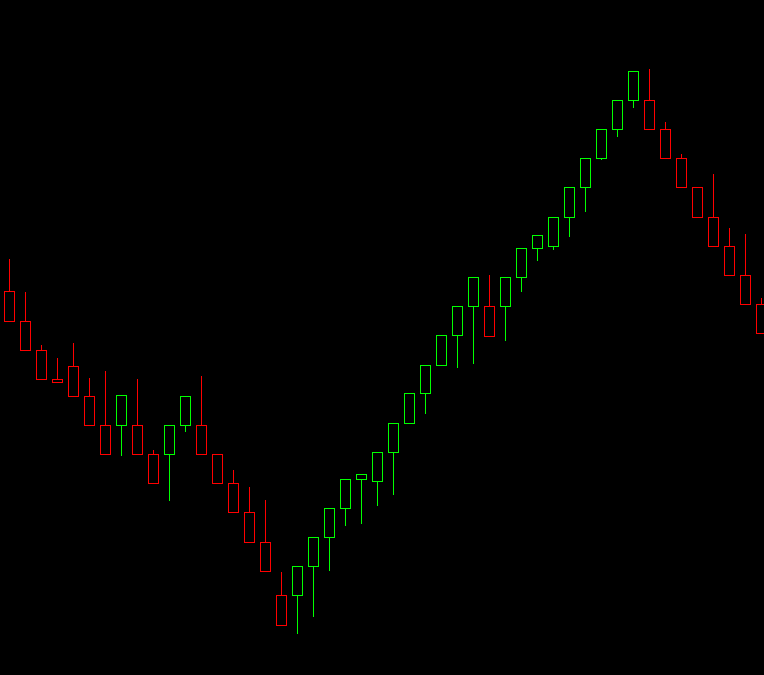
- Open the Graphics Settings - Colors window as explained in the Introduction section. Keep in mind that if you only want to apply these settings to the current chart, instead of globally, then you need to select Chart >> Graphics Settings >> Graphics Settings for Chart - Colors and set the option for Use Global Graphics Settings Instead Of These Settings to No.
- On the Chart tab in the list of objects, select Candlestick Up Fill.
- Select the Select Color button.
- Set the color to match the background color (the default background color is black).
- Select OK to close the Color Selection window.
- In the list of objects select Candlestick Down Fill.
- Select the Select Color button.
- Set the color to match the background color (the default background color is black).
- Select OK to close the Color Selection window.
- Select OK to close the Graphics Settings - Colors window and to have the bricks update to display as hollow.
Saving and Loading Multiple Graphics Settings Configurations
It is supported to save the settings on the SavedSettings tab of the Graphics Settings - Colors window as one of up to 20 configurations, and then load that configuration. This lets you switch between multiple Graphics Settings configurations easily.
The option to Save and Load a configuration is only available for the Global Graphics settings, that is when selecting Global Settings >> Graphics Settings - Colors. The option to save and load a configuration will not be available if the Graphics Settings is selected from the Chart menu (Chart >> Graphics Settings >> Graphics Settings for Chart - Colors).
If a chart is set to use the Chart Graphics Settings such that the option for Use Global Graphics Settings Instead of These Settings is set to No for that chart, then loading a confguration will not have any effect on that chart.
If wanting to use different graphics settings for different charts, then each setting for the chart would have to be individually adjusted using the settings accessed by selecting Chart >> Graphics Settings >> Graphics Settings for Chart - Colors.
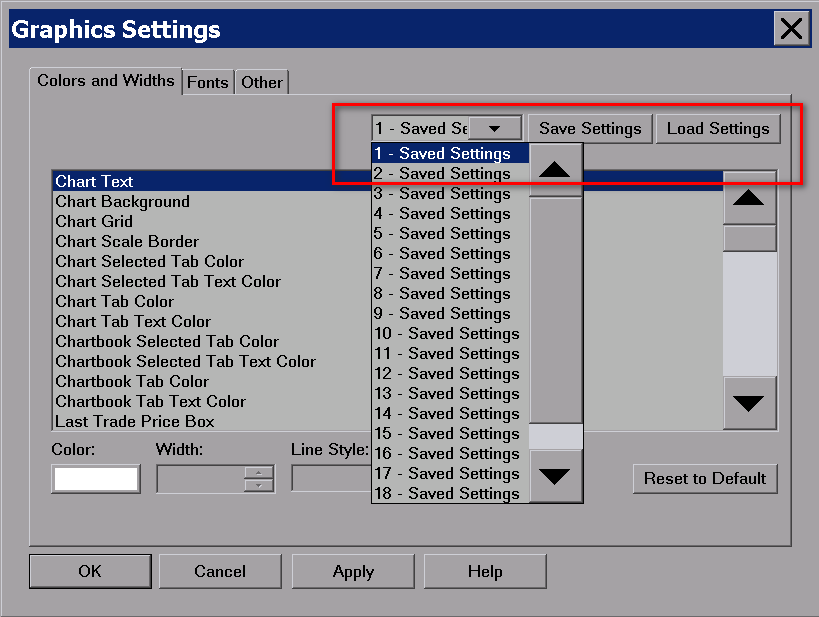
To save a configuration follow these instructions:
- Select Global Settings >> Graphics Settings - Colors.
- Select the Saved Settings tab.
- In the list box that contains the Saved Settings, select the particular Saved Settings configuration number that you want to save the settings to. There are 20 different slots or configurations that you can save settings into and then load from.
- Press the Save Settings button.
To load a previously saved configuration follow these instructions:
- Select Global Settings >> Graphics Settings - Colors.
- Select the Saved Settings tab.
- In the list box that contains the Saved Settings, select the particular Saved Settings configuration number that you want to load the configuration from. There are 20 different slots or configurations that you can save settings into and then load from.
- Press the Load Settings button.
Copying Chart Graphics Settings To/From Global Graphics Settings
Chart specific color, line style, and line width graphics can be copied to and from the global graphics using the controls located on the Graphics Settings for Chart - Colors >> Settings tab.
Copy Chart Graphics Settings To Global Graphics Settings
Selecting the button for Copy to Global updates the color graphics settings for the global graphics based on the then-current chart specific graphics settings.
This does not change any of the saved global graphics configurations, including the configuration that may be selected at that time. After this action is performed and the chart specific color graphics settings have been copied to the global color graphics settings, then those settings can be saved into a specific configuration for recall at a later time.
Follow these instructions to copy the chart specific graphics settings to the global graphics settings.
- Select Chart >> Graphics Settings >> Graphics Settings for Chart - Colors to open the chart specific color graphics settings window.
- Set the options on the Graphics Settings for Chart - Colors window as desired.
- Select the Settings tab.
- Select the Copy to Global button.
- Select Yes on the prompt to verify that you want to copy the chart graphics settings to the global graphics settings
Copy Chart Graphics Settings From Global Graphics Settings
Selecting the button for Copy From Global updates the color graphics settings for the chart graphics based on the then-current global graphics settings.
Follow these instructions to copy the global color graphics settings to the chart color graphics settings.
- Select Chart >> Graphics Settings >> Graphics Settings for Chart - Colors to open the chart specific color graphics settings window.
- Select the Settings tab.
- Select the Copy From Global button.
- Select Yes on the prompt to verify that you want to copy the global graphics settings to the chart graphics settings
Changing the Font Size For Text Displayed with Tool Drawings (Global Chart Drawing Font)
To adjust the size and other properties of Text that is displayed with Tool drawings, select Global Settings >> Tool Settings on the menu. Modify the Global Chart Drawing Font by pressing the Select button within that frame.
The Global Chart Drawing Font applies to Chart Drawings that display text whether as part of the drawing type like with the Type Text, Stationary Text drawing types, or optionally display text like with the Price Retracement drawings.
Some Chart Drawings will have the setting Use Global Font in their Chart Drawing Properties. When this is enabled, then those Chart Drawings will use the Global Chart Drawing Font. Otherwise, they will use the fonts specified within the Properties for the Chart Drawing.
Adjusting Graphics Settings and Fonts for High DPI Displays
When Sierra Chart is running on a computer system with a monitor that has a high dots per inch (DPI) like 4K monitors, text can appear to be small.
Another issue you may see is that Control Bar buttons that use graphics are narrow in width because the graphic for the Control Bar button is small relative to the high DPI setting.
Follow the instructions below to solve all of this.
- Select Global Settings >> Graphics Settings - Fonts on the main menu.
- Increase the Size setting of each of the Fonts if the current size is too small.
- When done increasing the font sizes, press OK to close the Graphics Settings - Fonts window.
- Some charts can use font sizes which are specific to that chart and are not global. For more information about this, refer to Using Different Color and Graphics Settings for Specific Charts. These fonts can be set independently for individual charts:
Chart Text
DOM Quantities/Sizes
Market Depth Window
Time and Sales Window
Chart Order Fills
To change these Fonts for a particular chart, go to that chart and select Chart >> Graphics Settings >> Graphics Settings for Chart - Fonts. - Increase the Size setting of each of the Fonts listed above if the current size is too small.
- When done increasing the font sizes, press OK to close the Graphics Settings window.
- Follow the instructions in the Control Bar Button Properties section to set either a Text (most reliable and automatically scalable) Button Caption for Control Bar buttons, or set your own custom graphic on the Control Bar button.
- To increase the size of the Text in Control Bar buttons, refer to Control Bar Buttons Size and Text Size. There is both a global text size setting and the text size can be set individually for buttons as well.
- To adjust to the thickness of study Subgraph lines and other styles, refer to the Subgraphs Tab of the Study Settings window. You will want to adjust the Width setting.
- To adjust to the thickness of Chart Drawings, refer to Chart Drawing Properties.
- To adjust the font size for text displayed with Chart Drawings, refer to Changing The Font Size For Text Displayed With Tool Drawings.
Adjusting Size of Dialog Windows
There are two different styles of windows within Sierra Chart. There are the Microsoft Windows Dialog windows and there are the Sierra Chart Settings windows. Each of these is controlled differently.
To change the size of the Sierra Chart Settings windows, move your pointer to an edge and when the pointer changes shape to indicate that the size can be changed, left click and drag the pointer to change the size.
The size of the Windows Dialog windows, for example Global Settings >> Symbol Settings, are dependent upon operating system settings and the resolution of your monitor or monitors. The size of these windows is not controlled by Sierra Chart. On some systems they can appear small, on other systems they can appear large.
Follow the instructions below to adjust the size of these Window Dialog windows to be either larger or smaller. Keep in mind, these instructions are also going to affect the dialog windows for all programs running on the computer system and also affect the text size in all programs.
- Through your Windows desktop, select Start >> Control Panel >> Display. You should see the below page.
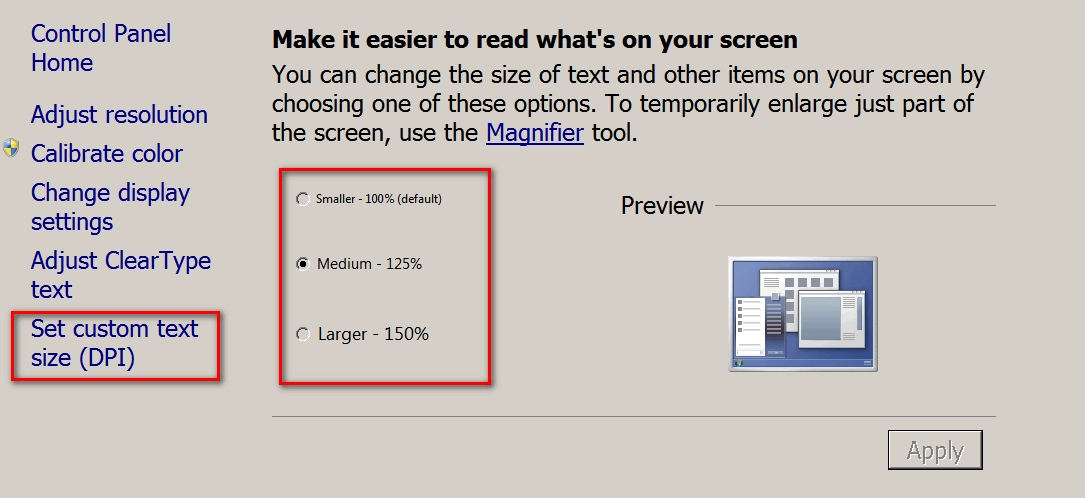
- Select one of the preset Text Size options or click on the Set Custom Text Size link to set a custom text size. Using a smaller percentage, reduces the size of dialog windows. Using a larger percentage increases the size of dialog windows.
- It is also possible to increase or reduce the size of text on dialog windows which may also increase or reduce the size of the dialog windows itself. This can be done through the Personalization >> Window Color and Appearance settings in the Windows Control Panel. Refer to the image below.
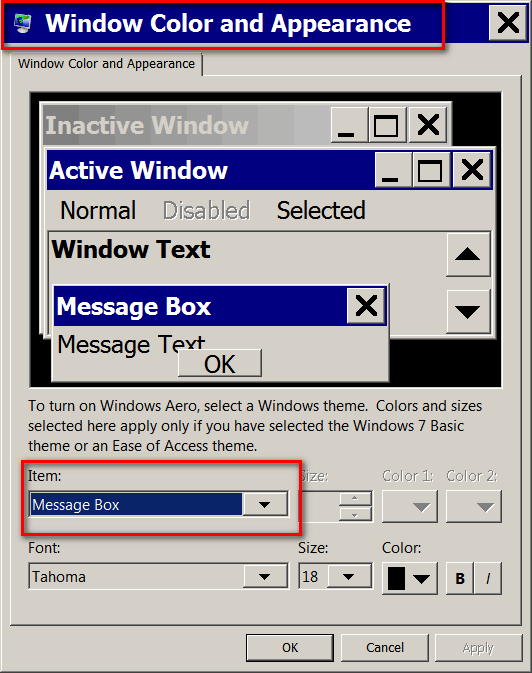
Setting Default Custom Colors
Is supported to customize the 16 colors listed on the operating system Color selector window. Follow the instructions below to do this. These custom colors are used throughout Sierra Chart when the Color selector window is displayed.
- Open the Graphics Settings - Colors window by following the instructions in the Introduction section.
- Press any Select Color button on any tab.
- Press the Define Custom Colors button if the color customization portion of the window is not already displayed to the right. If the rightmost portion of the window is already displayed, then Define Custom Colors will be disabled which indicates this.
- Select one of the 16 colors on the bottom left side of the Color selector window in the Custom Colors section by left clicking on the color box.
- Modify the color to what you want using the color controls on the right side of the Color selector window. Press the Add to Custom Colors button when done, to set the color. Do this for any of the other 16 Custom Colors.
- Press OK when done.
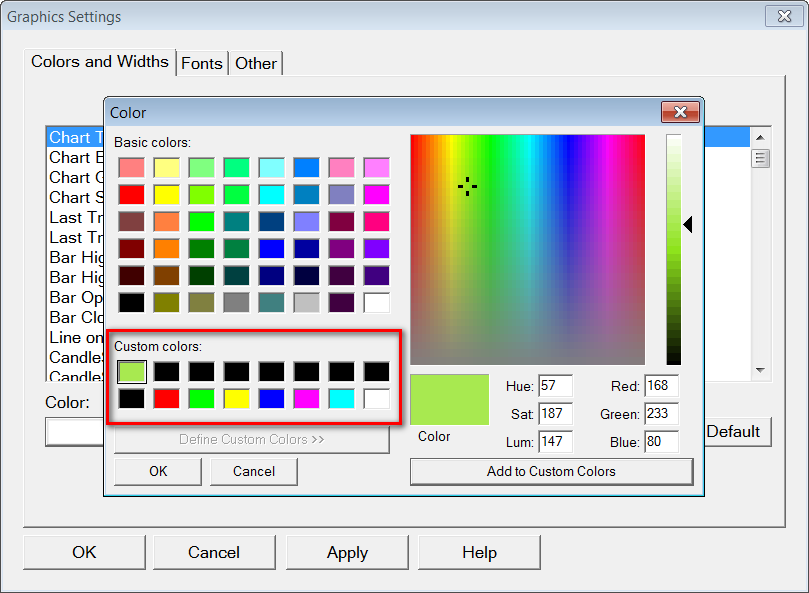
Adjusting Text Size on Menus
The text size and font for the menus in Sierra Chart are controlled at the operating system level since these menus are created using the operating system.
Consult your operating system documentation for how to change the text size and font for the menus. For Windows 7, refer to this article.
Setting Colors for Chart and Chartbook Tabs for the Main Window
The colors of the Chart and Chartbook tabs can be modified in the Graphics Settings window. The following items are available for modification:
- Chart Selected Tab: This sets the background color of the tab for the selected (active) chart within a Chartbook.
- Chart Selected Tab Text Color: This sets the color of the text on the tab for the selected (active) chart within a Chartbook.
- Chart Selected Tab Border Color: This sets the color of the border on the tab for the selected (active) chart within a Chartbook.
- Chart Tab Color: This sets the background color of the tabs for the not selected (not active) charts within a Chartbook.
- Chart Tab Text Color: This sets the color of the text on the tabs for the not selected (not active) charts within a Chartbook.
- Chartbook Selected Tab Color: This sets the background color of the tab for the selected (active) Chartbook.
- Chartbook Selected Tab Text Color: This sets the color of the text on the tab for the slected (active) Chartbook.
- Chartbook Tab Color: This sets the background color of the tabs for the not selected (not active) Chartbooks.
- Chartbook Tab Text Color: This sets the color of the text on the tabs for the not selected (not active) Chartbooks.
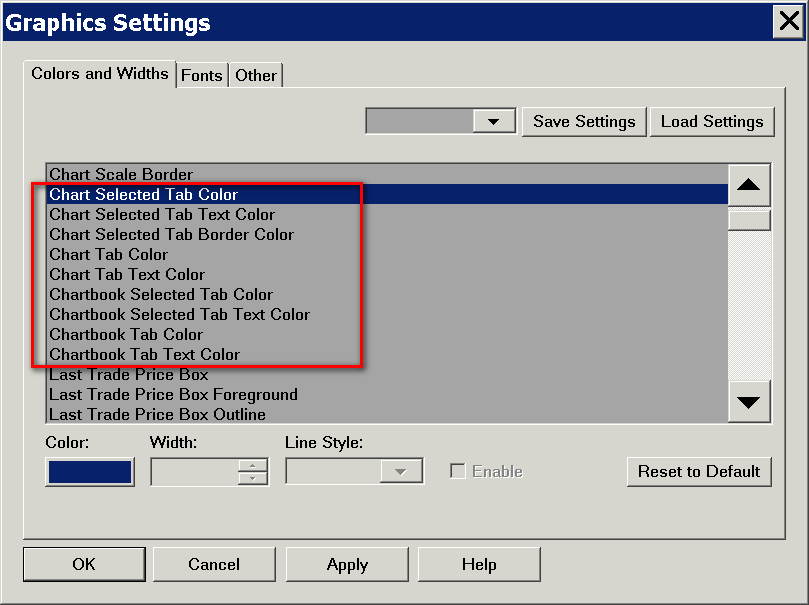
Setting Color for Main Window Background
Follow the instructions below to control the background color of the main program window.
- Select Global Settings >> Graphics Settings - Colors.
- Select the Window tab.
- In the list of objects, select Main Window Background.
- Press the Select Color button.
- Select the desired color.
- Press OK to close the color picker window.
- Press OK to close the Graphics Settings - Colors window.
Setting Colors for List View Headers
Sierra Chart contains many list view windows which include the Time and Sales window, Chart Values windows, and the Trade Activity Log among others
Follow the instructions below to control the color of the header line of these list view windows.
- Select Global Settings >> Graphics Settings - Colors.
- Select the ListBox tab.
- In the list of objects, select any of the List Box Header objects.
- Press the Select Color button.
- Select the desired color.
- Press OK to close the color picker window.
- Press OK when all done setting colors in order to close the Graphics Settings - Colors window.
Text Display when using Open GL
When using OpenGL, there is no support in OpenGL for text rendering. Refer to OpenGL Text Rendering.
It is necessary that Sierra Chart implements its own text rendering. Inherently there are going to be limitations with text rendering and not all fonts can be used. And you cannot use an excessive number of fonts and sizes, as this will lead to performance issues.
If you have problems with the display of fonts, then some fonts we recommend using are: Arial and Segoe UI.
The way that Sierra Chart outputs text to a window, is by iterating through the characters in a text string, and copying to the window, a pre-generated bitmap for the particular character using a particular font and size.
This bitmap has been created previously with the GetGlyphOutlineW Windows API function.
Some font characters do not give a correct or expected output with this function. In this case, the character will be blank. This is why you will notice this particular effect of broken up text where in a text string, you notice skipped characters. The solution in this case is to use a different font.
For font Point sizes greater than 40, a Point size of 40 for the particular font name will be used and then scaled up to the higher size. Glyphs for the characters for the larger sizes greater than 40 Points are not generated because it is not possible based on memory limitations and performance considerations with OpenGL.
It is important, if you have any issues with fonts or stability issues in OpenGL to update to version 2852, or higher.
*Last modified Wednesday, 02nd September, 2026.