Home >> (Table of Contents) Other Pages >> Additional Files (Study Collections, Spreadsheets, Chartbooks)
Additional Files (Study Collections, Spreadsheets, Chartbooks)
General Instructions
This page lists various Study Collections, Spreadsheets, Chartbooks and Custom Studies Files that you may find helpful.
When you click the link to one of these files, you will then need to save the file to your Sierra Chart Data Files Folder. This folder can be determined by selecting Global Settings >> General Settings on the menu.
The path to the folder where you need to save the files is displayed in the Data Files Folder box.
For complete instructions, refer to the How to Use an Advanced Custom Study or a Study Collection page.
Files
- SingleBarVolumeProfilesWithBAV.StdyCollct [Study Collection file]. Description: This is a study collection file that applies a Volume by Price study to the chart where there is a single profile for each bar in the chart. At each price level within the Volume Profiles you will see the bid volume and ask volume for that price level. For more information, refer to Single Bar Volume Profiles with Bid Volume and Ask Volume.
- 60MT - Cash.StdyCollct [Study Collection file]. Description: This is a study collection file for the 60 Minute Trader method.
- 60MT - Futures.StdyCollct [Study Collection file]. Description: This is a study collection file for the 60 Minute Trader method.
- Average of Daily Range.StdyCollct [Study Collection file]. Description: This Study Collection is meant to be used on a chart where the timeframe of each bar is 1 Day. It calculates and displays the 10 day average of the daily price range. The result of this is very similar to the Average True Range study used on a Daily bar chart.
- Bands.StdyCollct [Study Collection file]
- BasedOnExamples.StdyCollct [Study Collection file]
- Buffy.StdyCollct [Study Collection file]
- Removed
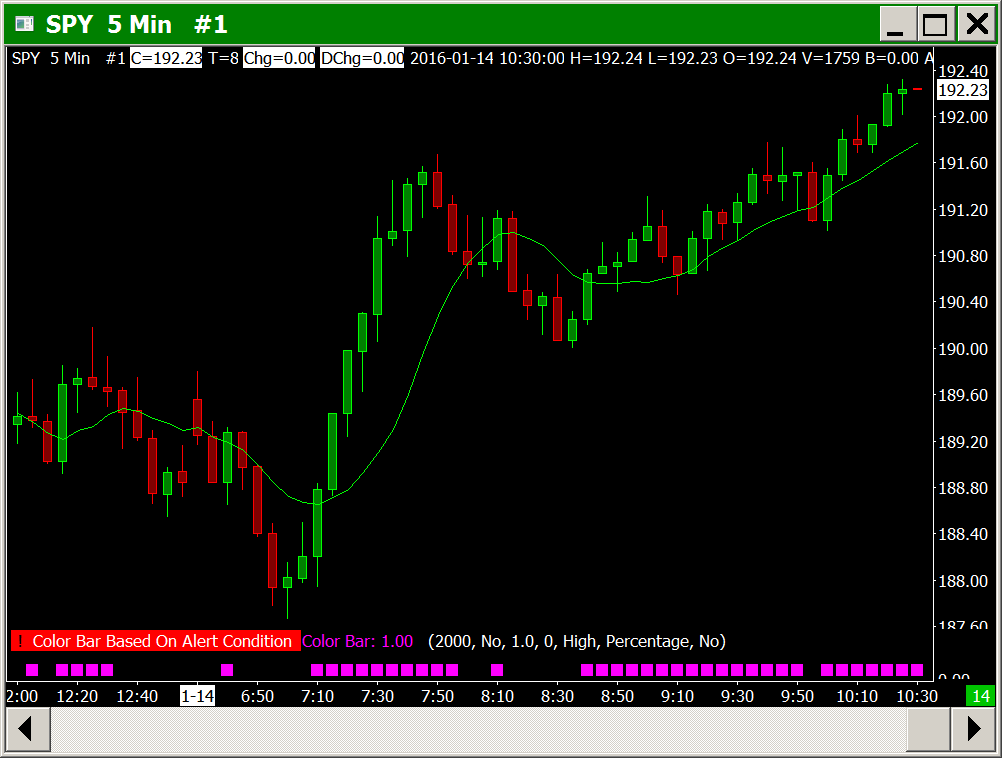
- ColoredCCI.StdyCollct [Study Collection file]. Description: This study collection uses the Color Bar Based on Alert Condition studies to custom color the Commodity Channel Index. The CCI bars are colored when they are over 100 and less than -100. For more information, refer to Color Bar Based on Alert Condition study documentation.
- CumulativeAskBidVolumeDifference.StdyCollct [Study Collection file]
- Removed
- Removed
- Removed
- Removed
- Removed
- Removed
- Ichimoku.StdyCollct [Study Collection file]
- MACD Crossing.StdyCollct [Study Collection file]
- McClellanOscillator.cht [Chartbook file]
- Pivot Points Study Example.cht [Chartbook file]
- Removed
- Rockwell.cht [Chartbook file]. Description: Sierra Chart provides this chartbook for the Rockwell Trading method. After you have saved this chartbook to your Data Files Folder, select File >> Open Chartbook in Sierra Chart. Select this file from the Open Chartbook window and press Open. You will notice at least 8 charts in this chartbook. The relevant charts are #1, #3, #5 and #7 (the odd-numbered ones). Each chart has a number that you will see on the chart tabs at the bottom of the main window, and on the title bar of of each chart. The symbols of these charts will need to be updated because these are futures contracts. Go to each of these charts and select Chart >> Chart Settings on the menu. In the Symbol box, update the symbol to the current month and year. If the symbol format used by the Data or Trading service you are using is significantly different, then you will need to change more than just the month and year. Refer to Changing the Symbol of a Chart. For more information, visit Rockwelltrading.com.
- Removed
- Time and Sales.StdyCollct [Study Collection file]
- Woodies for Range Charts with PP.StdyCollct [Study Collection file]. Description: If you wish to use the Woodies CCI analysis methods, use this study collection. More information can be found in this Support Board subtopic.
- Woodies for Range Charts.StdyCollct [Study Collection file]. Description: If you wish to use the Woodies CCI analysis methods, use this study collection. More information can be found in this Support Board subtopic.
- MovingAverageAngleDisplay.StdyCollct [Study Collection file]. Description: This is a collection of studies which demonstrates how to calculate the angle of a moving average and display that angle as text on the chart. Be sure to look at all of the Studies on the chart and their settings to gain an understanding of how this configuration works.
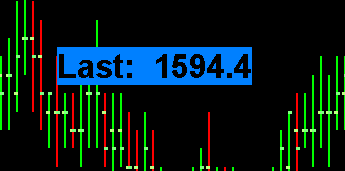
- Large_Last_Price_Display-.StdyCollct [Study Collection file]. Description: This is a study collection that contains the Text (Large) Display for Study. It displays the last trade price in large text on the chart. Refer to image. You can modify the colors and other Input settings in the Study Settings window for the study to customize it the way that you require.
- Stochastic_With_Blocks.StdyCollct [Study Collection file]

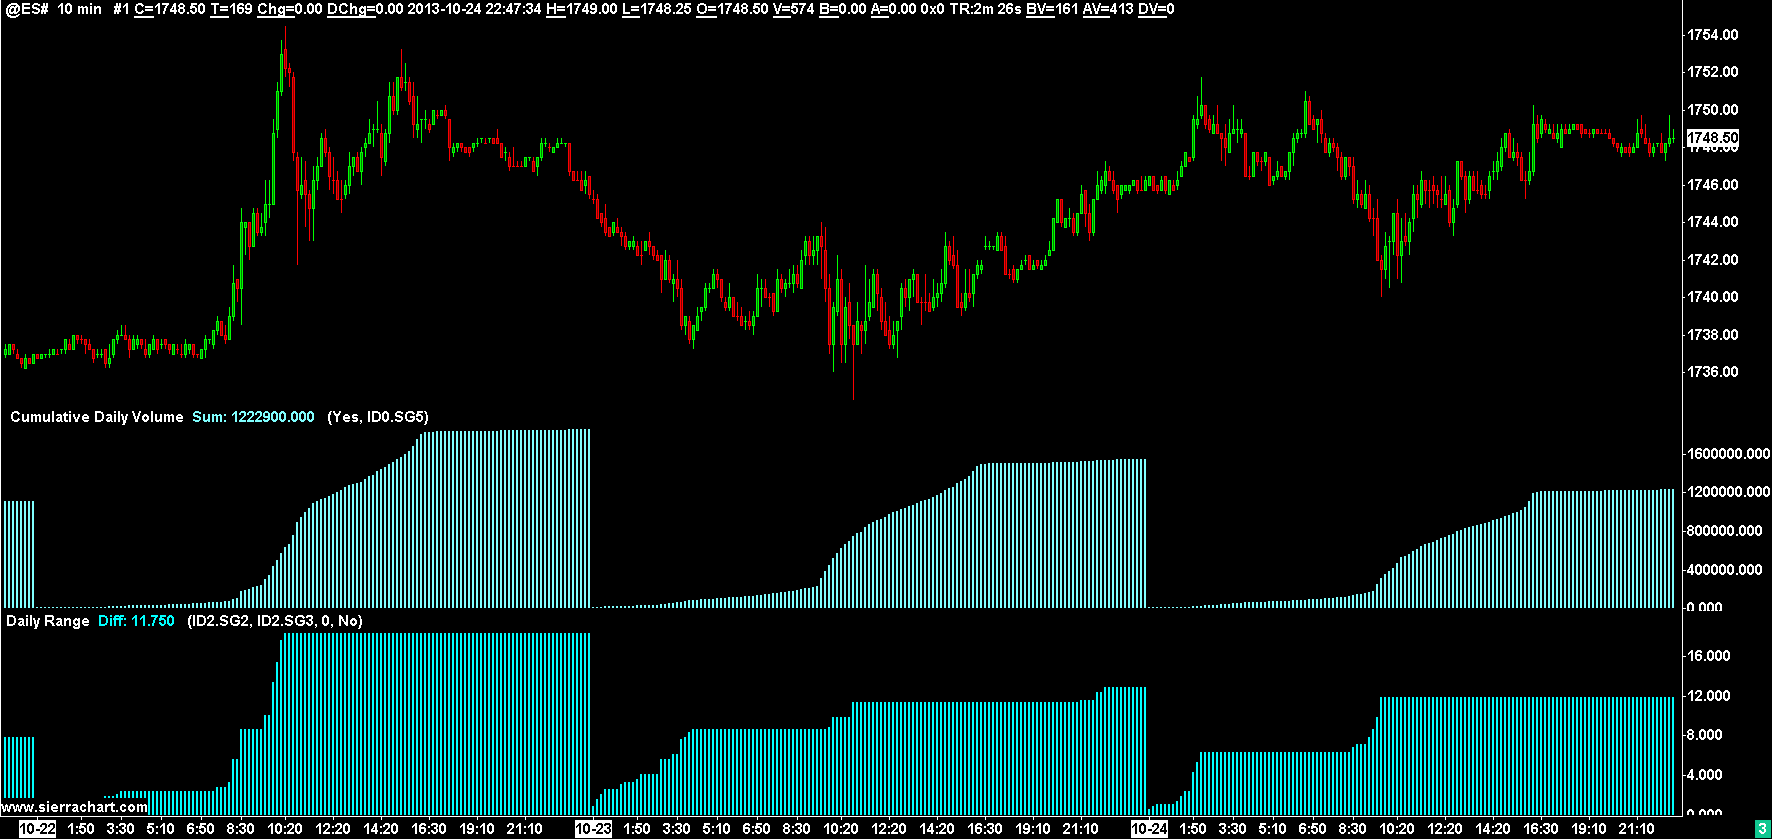
- CumulativeVolumeAndDailyRange.StdyCollct [Study Collection file]. Description: This is a study collection that contain studies which will calculate and display the cumulative Daily volume at each chart bar. This is meant to be used on Intraday charts. This volume gradually rises for each new bar. The study collection also contains studies which calculate and display the current Daily range at each chart bar.
- CCI_with_Avg.StdyCollct [Study Collection file]. Description: This is a study collection which consists of a Commodity Channel Index study and a Moving Average-Simple study based upon the Commodity Channel Index which calculates the moving average of the CCI line. Both of these studies are set to be displayed in the same Chart Region.
- AverageDailyRangeText.cht [Chartbook file]. Description: This is a Chartbook which consists of 2 charts, a Historical Daily chart and an Intraday chart. On the Historical Daily chart, there are studies which calculate the Average Daily Range. On the Intraday chart, there is the Text Display for Study study which displays the most recent Average Daily Range value from the Historical chart, as text.
- Removed
- HighAndLowBarValues.StdyCollct [Study Collection file]. Description: This is a study collection which consists of 2 Moving Average-Simple studies which are configured in a way to display on each chart bar the high of the bar and the low of the bar.
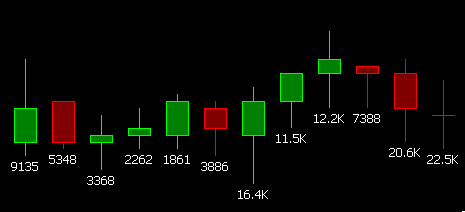
- Volume on Low.StdyCollct [Study Collection file]. Description: This is a Study Collection which consists of a Moving Average-Simple study with a Length Input of 1 which displays the volume of the bar at the low of the bar.
- CloseAboveAverageBlocks.StdyCollct [Study Collection file]. Description: This is a Study Collection which consists of a Moving Average-Simple study and a Color Bar Based on Alert Condition study which draws blocks in a separate Chart Region indicating where the closing price of a bar is above the moving average at that bar.
- Text at High Alert Condition.StdyCollct [Study Collection file]. Description: This Study Collection file uses a Color Bar Based on Alert Condition study which places text above the high of the last bar in the chart when the Alert Condition Formula defined on the Alerts tab of the Study Settings window is true.
The provided formula compares the closing price to a fixed coded price in the Formula. Modify the formula as required. Refer to To Enter an Alert Condition on a Study to modify the formula.
To modify the text, change the Text to Draw setting on the Study Settings >> Subgraphs window tab for the Color Bar Based On Alert Condition study. - Open Price As Text.StdyCollct [Study Collection file]. Description: This is a Study Collection file which uses the Text Display for Study study which displays the Open price for the current bar as a text value on the chart.
- Ask Bid Volume Difference Below Bar.StdyCollct [Study Collection file]. Description: This is a Study Collection file which displays the difference between Ask Volume and Bid Volume for a chart bar below the chart bar.
- Current to Previous Close Difference Text.StdyCollct [Study Collection file]. Description: This Study Collection file displays as text, the difference between the current price and the previous closing price in an Intraday chart. The specific text displayed on the chart before this number can be controlled through the Prefix Text for Display Value Input with the Text Display for Study study.
- ColorBarCopyToHigherTimeframe.cht [Chartbook file]. Description: This Chartbook file contains two charts which demonstrates copying the Color Bar Based on Alert Condition signals from a shorter timeframe per bar chart, to a higher timeframe per bar chart. In uses the Study Overlay - OHLC study.
- NumbersBarsExampleChartbook.cht [Chartbook file]. Description: This is an example Numbers Bars Chartbook displaying Bid Volume and Ask Volume at each price level. The more dominant side at each price level is covered. For additional information, refer to Numbers Bars.
- FillOpenRange.StdyCollct [Study Collection file]. Description: This Study Collection file combines several studies to display a filled area on the chart 2 points above and two points below the prior days opening price.
- High - Low Range as Text.StdyCollct [Study Collection file]. Description: This Study Collection file uses the Daily OHLC, Study Subgraphs Difference, Text Display for Study studies to display as text on the chart, the current high to low price range for the current day.
- Daily_Range_Text.StdyCollct [Study Collection file]. Description: This Study Collection displays the difference between the previous days high value and low value.
- ZigZagCumulativeVolumeResetAlert.StdyCollct [Study Collection file]. Description: This Study Collection has the Zig Zag Cumulative Volume study with an alert set that triggers when the Cumulative Volume resets.
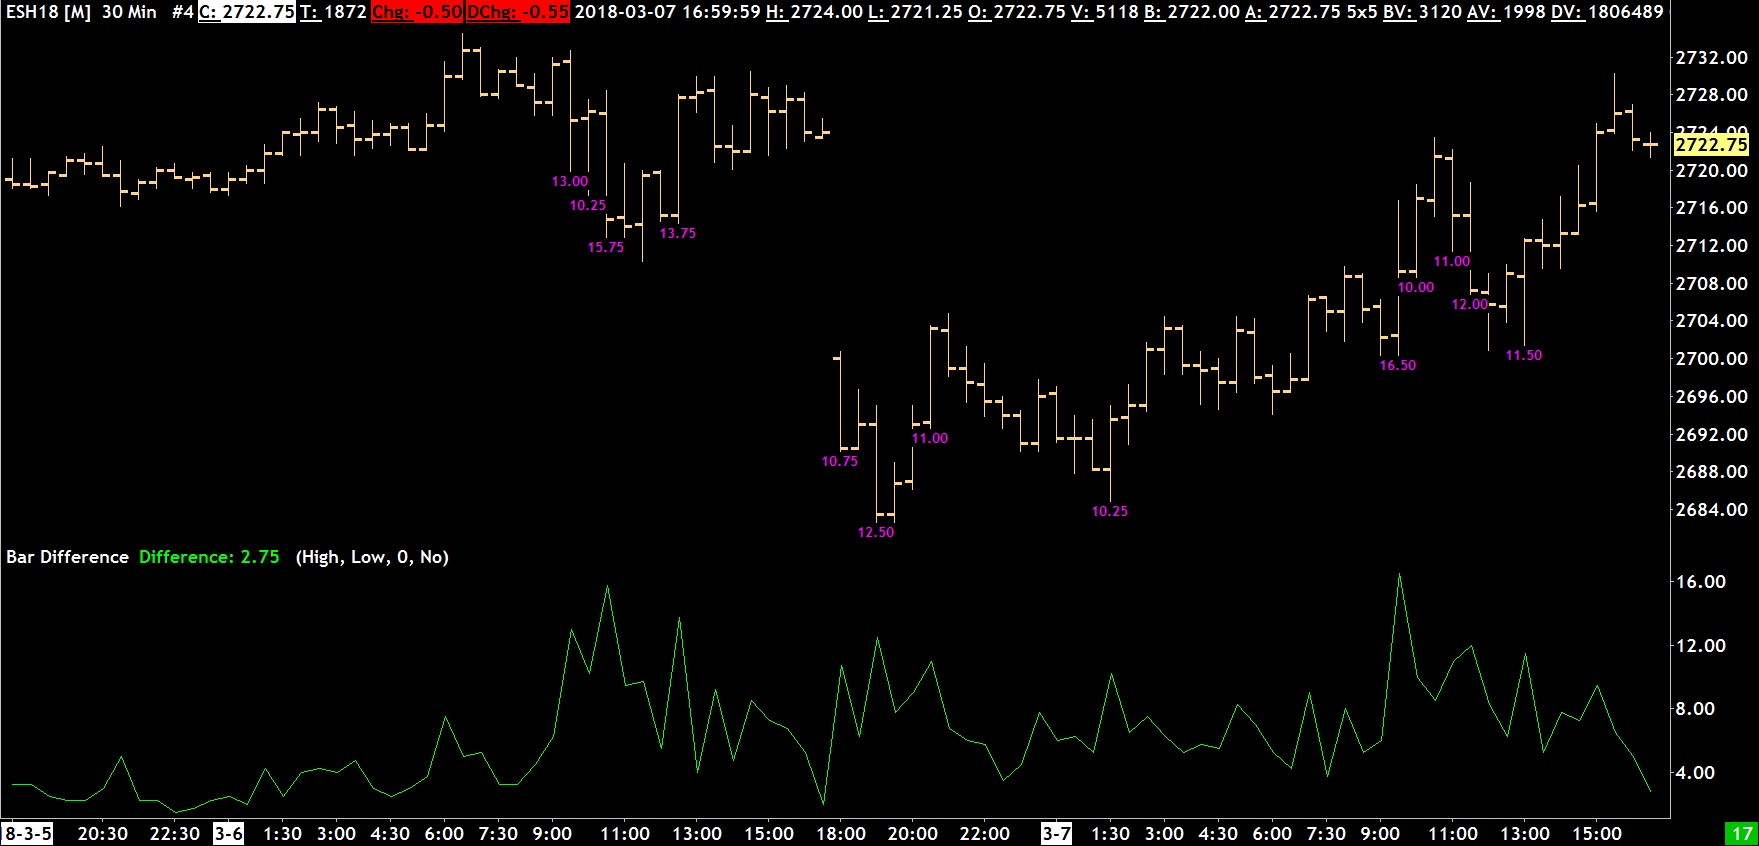
- BarDifferenceOverValueOnLow.StdyCollct [Study Collection file]. Description: This Study Collection has the Bar Difference study and also displays the actual Bar Difference on the Low of the Main Price Graph when the Bar Difference is greater than a set value (in this case 10.0).
- CumDeltaVolAlert-BarCloseOpposites.StdyCollct [Study Collection file]. Description: This Study Collection has a Cumulative Delta Bars - Volume study with an Alert that triggers when the Close of the Cumulative Delta Volume bar is Down and the Close of the Main Price Bar is Up, and vice versa.
- CumDeltaVolAlert-BarUpDownOpposites.StdyCollct [Study Collection file]. Description: This Study Collection has a Cumulative Delta Bars - Volume study with an Alert that triggers when the Bar type of the Cumulative Delta Volume bar is Down and the Main Price Bar is Up, and vice versa. This check is performed by comparing the Close against the Open to determine Up or Down.
- CumulativeSheepIndex.StdyCollct [Study Collection file]. Description: This study collection compares the current bar Volume against the average volume over the past 20 days at the same time and displays this difference.
- TextDisplayOfAverageTrueRange.StdyCollct [Study Collection file]. Description: This study collection uses the Text Display for Study study to display the current value of the Average True Range study on the Main Price Graph without displaying the Average True Range study itself.
- BarRangeTextAboveBar.StdyCollct [Study Collection file]. Description: This study collection uses a hidden Study Subgraphs Subtract/Difference study to supply the bar range to the Study Subgraph Above/Below Bar As Text in order to display the range of each bar at the top of the bar.
- ColorCurrentBarLastAboveBelowOpen.StdyCollct [Study Collection file]. Description: This study collection uses two Color Bar Based on Alert Condition studies to control the color of the most recent bar in the chart depending on whether the current price is above the Open, or below the Open.
- NumbersBars4xImbalanceHighlight.StdyCollct [Study Collection file]. Description: This study collection has a Numbers Bars study with the Bid Vol x Ask Vol text displayed with the dominant side colored Red (Bid) or Green (Ask) when the dominant side is 4x (400%) larger than the non-dominant side.
- MarkerOnNonZeroBidAndAskAtHighLow.StdyCollct [Study Collection file]. Description: This study collection places a green marker above a bar when both the Ask and Bid volumes at the High Price are non-zero. It also places a red marker below the bar when both the Ask and the Bid volumes at the Low price are non-zero.
- ZigZagAccVolumeColorByPosNeg.StdyCollct [Study Collection file]. Description: This study collection has a Zig Zag study with Volume calculation set to Ask Bid Volume Difference and then uses 4 Color Bar Based on Alert Condition studies to place the accumulated volume at the zig zag reversal points above and below the bars in different colors based on whether the accumulated volume is positive or negative.
- StochasticSlow-ColorAboveBelow.StdyCollct [Study Collection file]. Description: This study collection has the Stochastic - Slow study with two Color Bar Based on Alert Condition studies to color the Slow %K line one color when it is above 70 and another color when it is below 30.
- StudyOutput.StdyCollct [Study Collection file]
- Keltner Alert.StdyCollct [Study Collection file]
- New High New Low Alert.StdyCollct [Study Collection file]
- SlowStochasticCrossoverAlert.StdyCollct [Study Collection file]
- MovingAverageAndLastCrossoverAlert.StdyCollct [Study Collection file]
*Last modified Wednesday, 22nd February, 2023.