Home >> (Table of Contents) Studies and Indicators >> Technical Studies Reference >> Point and Figure Chart
Technical Studies Reference
- Technical Studies Reference
- Common Study Inputs (Opens a new page)
- Using Studies (Opens a new page)
Point and Figure Chart
- Description
- Why Point & Figure Columns Do Not have the Same High/Low As The Underlying Bars
- Graph Draw Type and Scaling Point and Figure Chart
- Inputs
Description
The Point & Figure Chart study is a study which is added through Analysis >> Studies.
The Point & Figure Chart study has been replaced with the Intraday Chart Bar Period >> Bar Period Type >> Point and Figure Bar setting in Chart >> Chart Settings. For documentation, refer to Time Period Per Bar/ Amount of Data Per Bar. It is recommended to use this new setting.
However, the description here for Point and Figure bars in regards to how they are constructed, applies to both the Point and Figure Chart study and also to the Chart >> Chart Settings >> Intraday Chart Bar Period >> Bar Period Type >> Point and Figure Bar setting.
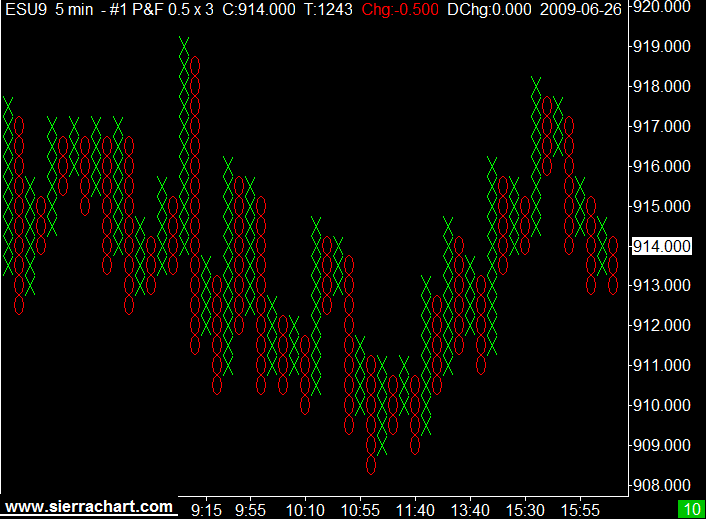
Point and Figure charts consists of columns of X's or O's. A X column is created when the price of the symbol is going up. An O column is created when the price of the symbol is going down. One X or O is drawn for each price move of the specified Box Size Input. Until the price movement, meets or exceeds the Box Size, no new box will be drawn.
The Box Size is specified as a number of ticks where the Tick Size is controlled through Chart >> Chart Settings >> Tick Size.
For example, if the Box Size is specified as 2 ticks and the Tick Size is .25, then the actual box size will be .50. In this particular example, for each price movement of .50 up or down of the underlying data the Point and Figure bars are based on, a new X or O will be drawn.
The underlying data in the case of the Point and Figure Chart study will be the chart bars as they are configured through the Chart >> Chart Settings. In the case of the Intraday Chart Bar Period >> Bar Period Type >> Point and Figure Bar setting in Chart Settings which also creates Point and Figure bars, the underlying data is what is used in the Intraday chart data file. Usually this will be 1 second for 1 tick data.
If the price of the symbol reverses direction by the number of boxes specified by the Reversal Size Input setting or more, then a new column is created in the opposite direction. If the prior column consisted of X's, then the next column will be O's, or O's if the prior column is X's. The Reversal Size in no way controls the minimum number of boxes per chart column. The number of boxes per chart column just simply depends upon whether a reversal has occurred based on the price action of the symbol. So there can be just one box.
The chart Tick Size can be changed to whatever that you require and this will affect the Box Size . However, this does not change the values of the underlying data in the chart. Those will remain the same. And as explained below all comparisons are based upon the Price Display Format setting on the chart.
All comparisons between the price values of the underlying data, the values of existing Point and Figure bars, the Box Size and the Reversal Size are compared according to the Price Display Format of the chart.
The Point and Figure Chart study graph columns are built from the underlying chart bars in the chart. If the underlying chart bars are 1 minute, then the Point and Figure columns will be based upon 1 minute bar data.
If the underlying chart bars are Daily bars, then the columns will be based upon Daily bar data. If the underlying chart bars are less than a minute or based upon a Number of Trades per bar, then the Point and Figure columns will be based upon that data.
The time period of the underlying data is set by selecting Chart >> Chart Settings on the menu. Refer to Time Period Per Bar/ Amount of Data Per Bar.
Point and Figure charts are based on the High and Low of the underlying bars in the chart. If the Open is greater than the Close of an underlying bar, likely meaning the High was made first, then the High is processed before the Low.
If the Open is less than the Close of an underlying bar, likely meaning the Low was made first, then the Low is processed before the High.
For example, if the Point and Figure column currently being built is up and the underlying data bar is determined to be a rising bar, meaning the Low was made first, then Sierra Chart checks to see if the Low causes a reversal. If it did, a reversal will be made.
Sierra Chart will then look at the High to see if a new box or boxes can be added if no reversal was made from the Low.
Or if a reversal was made from the Low, Sierra Chart will look at the High to see if a reversal needs to be made from the new down column.
When you are using the Point and Figure study on an Intraday chart, for the greatest accuracy and stability you may want to use underlying chart bars which are of a very short duration such as 10 seconds. This will give you the highest accuracy and stability.
If you are using 1 minute underlying bars or a greater time period per bar, then as the last underlying bar is changing in its structure, then you may notice a Point and Figure column disappear and reappear until such time that the underlying bar is completed. To eliminate this disappearing and reappearing effect, set the Ignore Last Bar until Completed study Input to Yes.
For a X or Up column: The Low is at the bottom of the column and the Close and High are the top of the column.
For an O or Down column: The High is at the top of the column and the Close and Low are the bottom of the column.
Volume for a Point and Figure column is the actual trading volume for the column.
There are 2 Graph Draw Types for this study. One will display Point and Figure columns with a normal Open High Low Close (OHLC) bar style and the other uses a X-O column style. Refer to Graph Draw Type and Scaling Point and Figure Chart.
If you are displaying the columns as OHLC bars instead of the X-O style, then you may notice that close price of the last bar goes beyond the High or Low. This Point and Figure Chart image explains this.
Subgraph Color Settings: This information applies when the Graph Draw Type is set to use the OHLC bar style. The Open color sets the Open/Close dashes for Up Bars. The High Color sets the High/Low color for Up Bars. The Low color sets the Open/Close dashes for Down Bars. The Last Color sets the High/Low color for Down Bars.
Why Point & Figure Columns Do Not have the Same High/Low As The Underlying Bars
As with most derivitave type charts, Point & Figure charts do not give you a true representation of the actual underlying prices.
A Point & Figure column High in the case of a down Point & Figure column is always one box size below the prior High. The market may not have traded at that price.
A Point & Figure column Low in the case of an up Point & Figure column is always one box size above the prior Low. The market may not have traded at that price.
The Last price of a Point & Figure column/bar is either going to be at the High or Low depending upon whether the column is an Up or Down column respectively.
Graph Draw Type and Scaling Point and Figure Chart
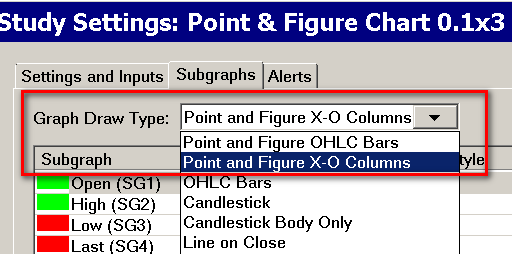
Point and Figure columns can be displayed either as X's or O's or as Open, High, Low, Close (OHLC) bars through the Subgraphs tab of the Study Settings window for the study. For instructions to open the Subgraphs tab, refer to Subgraphs Tab.
Set the Graph Draw Type setting to Point and Figure X-O Columns or Point and Figure OHLC Bars. OHLC bars is the preferred setting to eliminate scaling problems. Refer to the image below.
When displaying the Point and Figure columns as OHLC bars instead of X's or O's, then if prices are rising, then the close mark will be at the top of the bar. If prices are falling, then the close mark is at the bottom of the bar.
On the last bar, the Close/Last trade price is at the current closing price. The Open mark is at the price where the reversal occurred. Reversals are determined from the High or Low of the underlying bars in the chart.
You can use the Chart Values and Chart Calculator Tools on the bars to check values and take measurements.
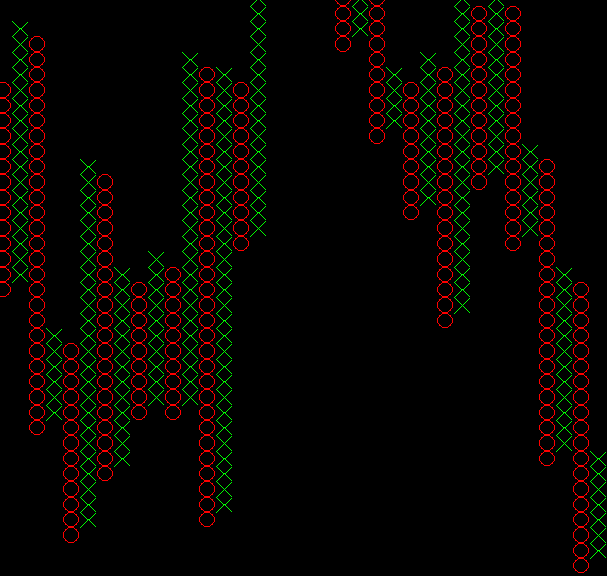
When the Subgraphs >> Graph Draw Type setting is set to Point and Figure X-O Columns, then the X's and O's may not look completely square because the chart bars are scaled to fit the width of the chart window and the range of prices on the vertical price scale. Also the Box Size Input affects the height of the X's and O's.
In order to get the X's and O's to be square or nearly square, requires that the Bar Spacing be increased or decreased in the chart and the vertical range of prices be changed by using Interactive Scale Range.
You should really consider whether using X's and O's are practical. We recommend using OHLC bars instead.
Inputs
- Box Size (in ticks): The Box Size is the Point and Figure Chart Box Size and is the most important study Input to set. It specifies the number of ticks according to the chart Tick Size that each X or O box will be.
The Tick Size is the minimum price increment for the symbol of the chart. It is essential that the Chart >> Chart Settings >> Tick Size setting is set correctly for the chart for the Box Size Input setting to be accurate.
If the Tick Size is 0.25 for the chart and you have set this Input to 4, then the actual value will be 1.0. - Reversal Size: This is the number of boxes that prices need to reverse by, in order to start a new column.
- Allow One Box Reversals: If this Input is set to Yes, then one box reversals are supported.
- New Bar at Start of Day: If this Input is set to Yes, then a new Point and Figure column is started at the begining of a new trading day. This is determined from the Session Times settings in Chart >> Chart Settings.
- Ignore Last Bar Until Completed: If this Input is set to Yes, then the last bar in the underlying chart is ignored until it completes. It is considered complete when there is a new bar added to the chart.
- Use Percentage of Last Price for Box Size:
When this input is set to Yes, then the Point and Figure Box Size is automatically determined and is a percentage of the last price in the chart. The percentage is set with the Box Size Percentage (%) Input. This calculation is only performed when the study is fully recalculated. This happens when the study is added to the chart, Chart >> Recalculate is selected, when changes are made to the Study Settings or when the Chartbook it is contained in is opened.
When this input is set to Yes, then the Box Size input is ignored. - Box Size Percentage (%): When Use Percentage of Last Price for Box Size is set to Yes, then this Input controls the percentage that the Point and Figure Box Size will be of the last price in the chart.
- Calculate Only Using Close Prices: When this Input is set to Yes , then the High and Low of the underlying chart bars is not used in the calculations and only the closing price of the chart bars is.
*Last modified Friday, 19th January, 2024.