Home >> (Table of Contents) Studies and Indicators >> Technical Studies Reference >> Color Bar Based on Alert Condition
Technical Studies Reference
- Technical Studies Reference
- Common Study Inputs (Opens a new page)
- Using Studies (Opens a new page)
Color Bar Based on Alert Condition
- Description
- Drawing Arrows/Text or Other Styles at the High or Low of Bars
- Coloring Subgraphs of Other Studies
- Hiding Studies
- Preventing Alert Sounds and Alert Log Messages
- Using the Sum of Alerts Subgraph
- Creating Extension Lines for Another Study
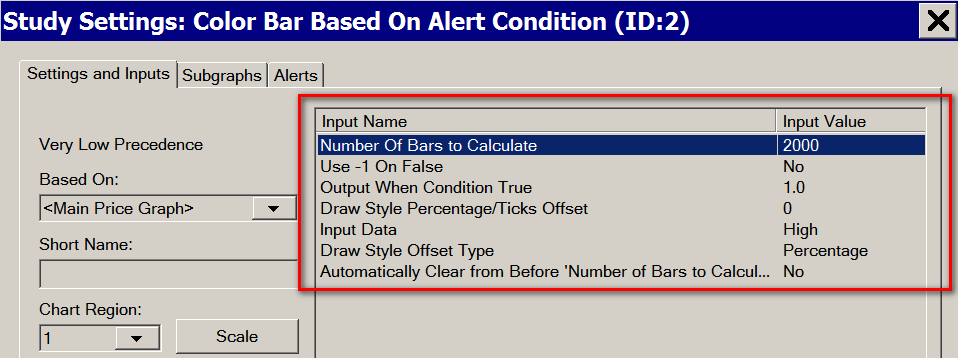
- Inputs
- Use Vertical Line Instead of Coloring Background
- Number of Bars to Calculate
- Use -1 on False
- Output When Condition Is True
- Input Data
- Draw Style Percentage/Ticks Offset
- Draw Style Offset Type
- Automatically Clear from Before 'Number of Bars to Calculate'
- Draw Extension Lines at Color Bar Value
- Extension Lines Range
- Draw Zeros
Description
The information in this section applies to both the Color Bar Based on Alert Condition and Color Background Based on Alert Condition studies.
In almost all cases you will want to use the Color Bar Based on Alert Condition study since its Subgraphs >> Draw Style can also be set to Background and accomplish the same thing as the Color Background Based on Alert Condition study.
These are very powerful studies that color the bars, Study Subgraph lines, or the chart background according to whether or not the specified Simple Alert Condition Formula is TRUE for the corresponding bar.
Up/Down Arrows can also be drawn as an alternative. For complete information on how to define and set a Simple Alert Condition formula to be used with this study, refer to the Study Alerts and Scanning page.
There are many Formula Examples on that page including examples which use this study.
The Simple Alert options for an Alert Condition formula: Reset Alert Condition on New Bar, Alert Only Once per Bar, do not apply with this study.
The option Evaluate on Bar Close does apply to these studies. In the case of the Color Bar Based on Alert Condition and Color Background Based on Alert Condition studies, Evaluate on Bar Close does not cause the prior bar to be colored when the Alert Condition formula is TRUE at a specific bar, rather it simply skips evaluating the formula on the very last bar in the chart. In other words, when Evaluate On Bar Close is enabled, what effectively does is evaluate the Alert Condition Formula across the bars in the chart other than the last bar. So when it is disabled, the evaluation also occurs on the last bar in the chart.
One good use of this study is to test a Simple Alert Condition formula you have been using on a study. In this way you can instantly and clearly see if your Alert Condition formula works as expected because the bars or background will be colored at the chart bars where it is TRUE.
Alert Condition formulas can sometimes be complicated to resolve problems with. It is recommended that you use a step-by-step process to create a formula whereby you start simple and then add to it. The very first formula you should use to simply see how this study and how formulas work is =1 or =TRUE. This will color the bars or background in the chart and then you can go from there to a more advanced formula.
Remember that if you want to make reference to other studies in your Alert Condition formula, that you must specify the study's ID before the study Subgraph you are referencing. Example: ID1.SG2
When the Color Bar Based on Alert Condition study is referencing one of the Time and Sales studies, since those studies use a separate bar for each trade or each bid/ask update, the persistence of the bar coloring is only going to be until the next trade or bid/ask update. So therefore the persistence will not be for the duration of the chart bar but a much shorter time usually.
Drawing Arrows/Text or Other Styles at the High or Low of Bars
It is possible to draw Arrows, Text or other Draw Styles at the High or Low of a chart bar instead of coloring the entire bar itself when using the Color bar Based on Alert Condition study. Follow the instructions below to do this.
It is necessary to follow through these instructions when using a Draw Style that draws at the level of the values of the study Subgraph of the Color Bar Based on Alert Condition study, instead of using a Color Bar Draw Style which will color a bar when the Subgraph value at a chart bar is any nonzero value like 1.0. Otherwise, you will get an incorrect display from the Color Bar Based on Alert Condition study.
- Add the Color Bar Based on Alert Condition study to the chart. Refer to the Adding/Modifying Studies for instructions. This functionality does not work with the Color Background Based on Alert Condition study.
- Open the Study Settings window for the study.
- Select the Alerts tab and set an Alert Condition Formula to do what you require.
- Select the Settings and Inputs tab.
- Set the Output When Condition Is True Input with the study to Use Input Data. This step and the next step, are necessary to control the value for the Draw Style to be drawn at. Other than using 1 which will not work.
Do not change the Based On setting. The Based On needs to be set to the Main Price Graph. - Set the Input Data Input to High or Low.
- Select the Subgraphs tab.
- Set the Draw Style for the Color Bar Subgraph with this study to the style that you want. You can use an Arrow style, or you can use a Text style or whatever you want.
- Select the Settings and Inputs tab.
- Optionally set the Draw Style Percentage/Ticks Offset Input to the +/- percentage or number of ticks offset that you want to offset the arrow or whatever Draw Style you have used, from the Input Data you have set. This is interpreted as a Percentage or number of ticks depending upon the setting of the Draw Style Offset Type Input. In the case of ticks, this is determined by the chart Tick Size.
- Press OK.
- Press OK.
Coloring Subgraphs of Other Studies
Using the Color Bar Based on Alert Condition study, you are able to color the Subgraphs of other studies on the chart based upon the specified Simple Alert Condition formula. Below are the general steps to accomplish this.
- Add the study you want a custom color to the chart. For instructions, refer to the Adding/Modifying Studies section.
- Add the Color Bar Based on Alert Condition study to the chart.
- Use the Down button on the Chart Studies window to move the Color Bar Based on Alert Condition study you have added to below the study that you want to custom color, in the Studies to Graph list.
- Set the Chart Region for Color Bar Based on Alert Condition study to the same Chart Region as the study you want to custom color.
- Set the Based On setting to the study you want to custom color.
- Set the Output When Condition Is True Input to Use Input Data.
- Set the Input Data Input to the Subgraph in the study you want to custom color.
- Select the Subgraphs tab.
- Set the Draw Style of the Color Bar Subgraph to be the same as the Subgraph of the other study you are coloring. In the case where you are coloring a study Line, it is recommended to use the Line-Skip Zeros Draw Style. Otherwise, the appearance of the line will not be correct.
- Set the Primary color to the color that you want to color the other study Subgraph. If you want to use different colors for different conditions, it is necessary to use multiple instances of the Color Bar Based on Alert Condition study, one for each color.
- Set the Width of the Color Bar Subgraph to be the same as the Subgraph of the other study you are coloring.
Hiding Studies
Other studies on the chart that you reference with the Color Bar Based on Alert Condition study may only be used for the purpose of coloring the main price graph bars when your Alert Condition Formula is true. You may not need to visually see the original source studies.
Therefore, you will want to hide those studies. To do this, go into the Study Settings window for each of those studies. On the Settings and Inputs tab, enable Hide Study option.
Preventing Alert Sounds and Alert Log Messages
If you do not want to have Alert Sounds played or Alert Log messages added when the Alert Condition Formula is TRUE at the last bar in the chart when using one of these Color Bar Based/Background on Alert Condition studies, then follow the instructions below.
- Open the Study Settings window for the Color Bar Based/Background on Alert Condition study. Refer to Adding/Modifying Chart Studies for instructions.
- Select the Alerts tab on the Study Settings window.
- Uncheck the Enabled option. Unchecking this option will not affect the coloring of chart bars but will prevent messages from being added to the Window >> Alerts Manager >> Alerts Log and prevent alert sounds from being played.
- Press OK.
- Press OK.
Using the Sum of Alerts Subgraph
The Sum of Alerts Subgraph that is part of this study, contains the total number of bars that are true for the study.
This Subgraph is intended to be used in other studies or Alert formulas where the total number of true values from the Color Bar Based on Alert Condition is desired.
This number will be affected by the Input for Number of Bars to Calculate.
To use this Subgraph in an Alert formula you would enter it as IDx.SG3 where x is the ID number of the Color Bar Based on Alert Condition study. Refer to Referencing Other Studies on the Chart within the Alerts documentation.
Creating Extension Lines for Another Study
The Color Bar Based on Alert Condition can be used to generate Extension Lines Until Future Intersection for other studies, where the lines will extend until they intersect with a future price bar. To setup the study to do this, set the following options in the Color Bar Based on Alert Condition study:
- Based On: This needs to be set to <Main Price Graph> in order to have the extension lines stop at future price bars. This can be set to another study if the extension lines are to stop when intersecting that study.
- Output When Condition True: Set this to be Study Subgraph Reference.
- Study Subgraph Reference Value When True: Set this to be the study and subgraph for which the extension lines are to be drawn (the source study and subgraph).
- Draw Extension Lines at Color Bar Value: Set this to Yes
- Extension Lines Range: Set this to Extend to Future Intersection. This can also be set to Extend to End of Chart, but if you want this option, it is better to use a different Draw Style for the source study itself rather than use this option.
- Alert Condition: Enter =1 for the alert condition to make the condition always true.
Inputs
Below are descriptions of the available Inputs for the Color Bar Based on Alert Condition and Color Background Based on Alert Condition studies.
Use Vertical Line Instead of Coloring Background
This input only applies to the Color Background Based on Alert Condition study.
When it is set to Yes, then an additional Subgraph is used and a vertical line with a width specified by the Subgraphs >> Background >> Width setting is drawn instead of coloring the background completely behind the chart bar.
Number of Bars to Calculate
This Input specifies how many bars in the chart, starting from the end of the chart, the study Simple Alert Condition formula should be evaluated with and colored if the formula is TRUE on that bar.
The reason for this Input is that if you have a lot of bars loaded in the chart, this study can take some time to evaluate the Simple Alert Condition formula on all those bars and it will slow Sierra Chart. So you want to keep this to a small number. Maybe not more than 5000. You will have to experiment and see what is best and what you need.
Also refer to the Automatically Clear from Before 'Number of Bars to Calculate Input.
Use -1 on False
This Input only applies to the Color Bar Based on Alert Condition study.
Normally the value for the Subgraph data elements is zero when the Alert Condition formula is FALSE for bars. When this Input is set to Yes, then the value is -1. This is for special use to perform coloring when using certain Draw Styles.
Output When Condition Is True
This Input only applies to the Color Bar Based on Alert Condition study.
When an Alert Condition formula is TRUE at a bar/column in the chart, the corresponding study Subgraph element of this study which is used to color a bar is set to 1.0. This causes the bar to be colored when using one of the Color Bar Draw Styles.
When you set this Input to Use Input Data, then the study Subgraph element for this study at the bar/column where the Alert Condition formula is TRUE, will be set to the value of the Input Data Input at that bar. It is necessary to use Use Input Data when you want to use a Draw Style other than the boolean Draw Styles such as Color Bar. The other styles require an actual chart value to vertically position them on the chart.
Setting this to Use Input Data, also allows you to color existing studies when your Alert Condition formula is TRUE. This requires that the Color Bar Based on Alert Condition study be Based On the study that you want to color.
Input Data
This Input only applies to the Color Bar Based on Alert Condition study.
When Output When Condition Is True: is set to Use Input Data, then this Input specifies the specific Main price graph Subgraph or study Subgraph to use. This will be the value that the Subgraph element of this study is set to at the corresponding bar/column in the chart.
Draw Style Percentage/Ticks Offset
This Input only applies to the Color Bar Based on Alert Condition study.
When the Output When Condition Is True Input is set to Use Input Data, then this Input specifies the percentage or number of ticks from the Input Data value that the outputted value will have.
Whether this is a percentage or number of ticks is dependent upon the Draw Style Offset Type Input setting.
This is useful to offset a particular Draw Style, usually from the bar high and low values. This value can to be positive or negative.
With Boolean draw styles like Color Bar, Point on High, Point on Low, this Input setting has no effect.
Draw Style Offset Type
This Input only applies to the Color Bar Based on Alert Condition study.
This controls whether the Draw Style Percentage/Ticks Offset is a Percentage or Number of Ticks according to the chart Tick Size.
Automatically Clear from Before 'Number of Bars to Calculate'
When this Input is set to Yes, then at any prior chart bars where the set Subgraph Draw Style has been displayed before the Number of Bars to Calculate Input, will be cleared from the chart as new bars are added.
When this Input is set to Yes, then set the Number of Bars to Calculate Input as required.
Draw Extension Lines at Color Bar Value
This Input only applies to the Color Bar Based on Alert Condition study.
When this Input is set to Yes, then a horizontal extension line will be drawn at each chart bar/column where the Color Bar value is nonzero. The length of the extension line is controlled through the Input Extension Lines Range.
The price level or value that the horizontal line is drawn at is the Color Bar value. When Output When Condition Is True is set to 1.0, the price level will be 1.0. This does not make sense. Therefore, when Draw Extension Lines at Color Bar Value is set to Yes, it only makes sense that Output When Condition Is True is set to Use Input Data.
In this case, the horizontal extension line is drawn at the value of the Input Data for the chart bar/column.
Extension Lines Range
This Input only applies to the Color Bar Based on Alert Condition study.
This Input controls the length of the extension lines that are drawn when the Input Draw Extension Lines at Color Bar Value is set to Yes. The options available are the following:
- Extend to Future Intersection: The extension lines will extend only until they encounter another bar at the same level. When the Color Bar Based on Alert Condition study is based on a another study, then the extension lines are extended relative to that study it is based on. So they are not going to extend based on the main price graph bars. The and if the study is based on does not have High and Low Subgraphs, then no extension will even be attempted.
- Extend to End of Chart: The extension lines will extend until the last bar in the chart.
Draw Zeros
This Input only applies to the Color Bar Based on Alert Condition study.
When the Output When Condition Is True Input is set to Use Input Data, then the Draw Zeros Input when set to Yes, will cause zero values to be drawn for the Color Bar Subgraph. Although this only makes sense if it is set to a Draw Style which does not color bars.
*Last modified Wednesday, 19th June, 2024.