Home >> (Table of Contents) Studies and Indicators >> Technical Studies Reference >> Color Bar HH LL
Technical Studies Reference
- Technical Studies Reference
- Common Study Inputs (Opens a new page)
- Using Studies (Opens a new page)
Color Bar HH/LL
Description
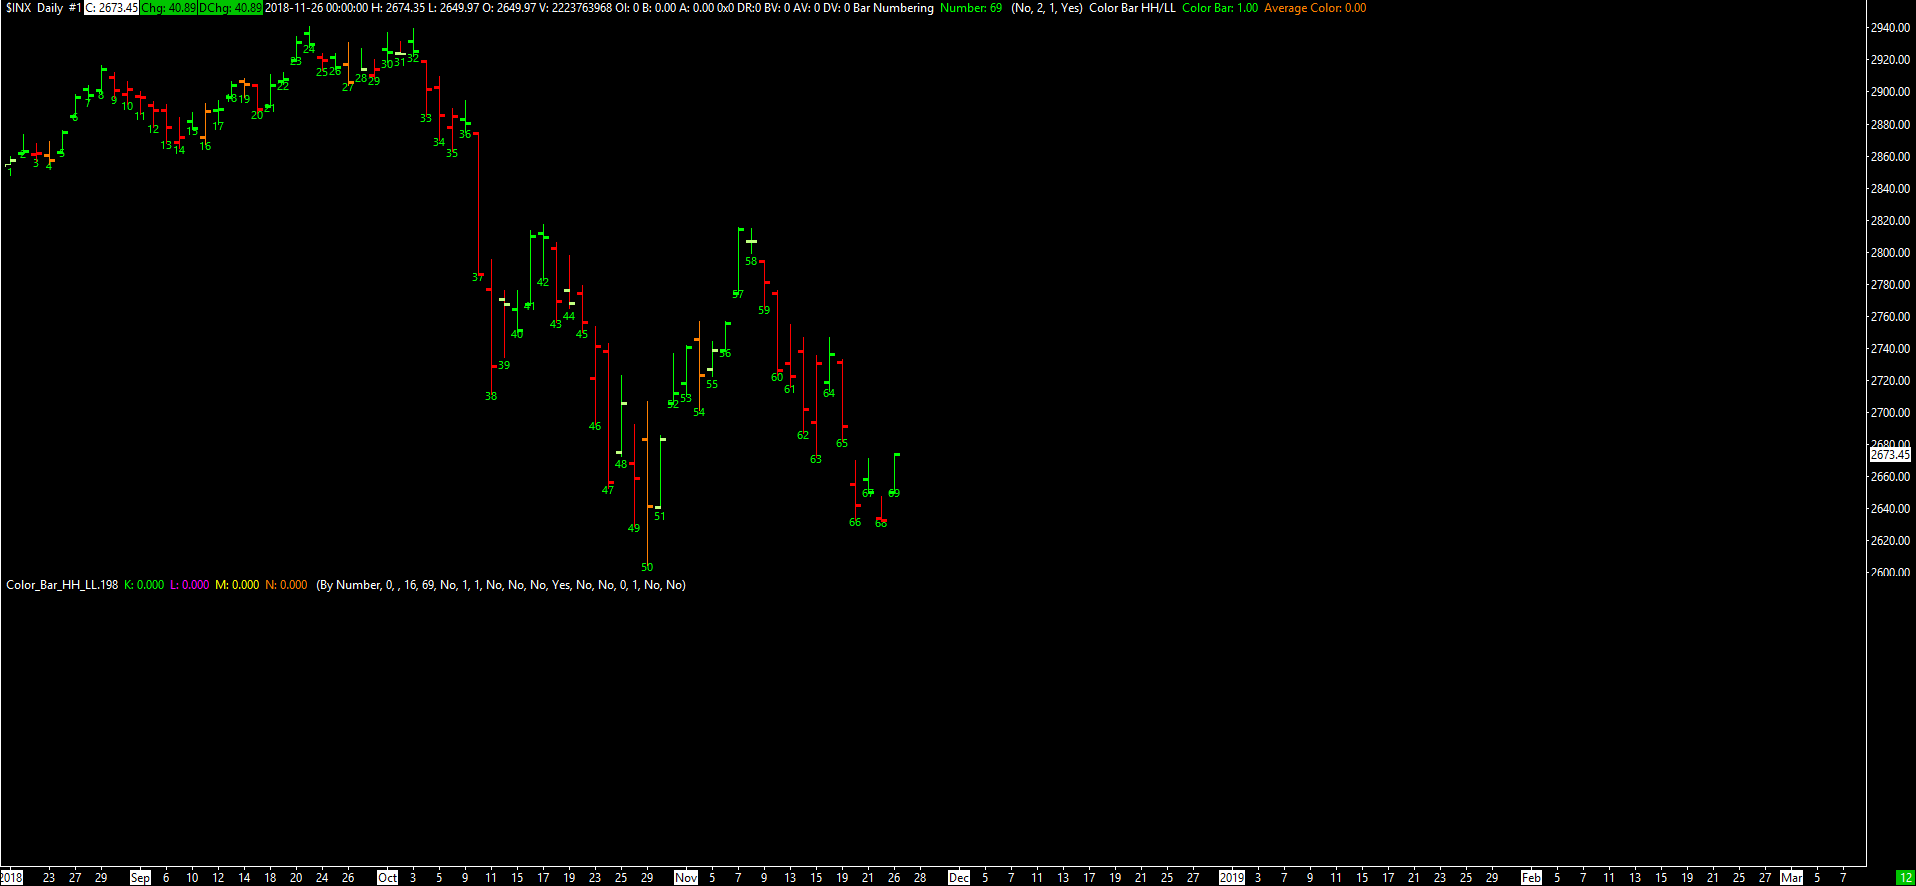
This study compares the High and Low Prices of the current chart bar to those of the previous chart bar.
Let \(O_t\), \(H_t\), \(L_t\), and \(C_t\) be the values of the Open, High, Low, and Close Prices, respectively, at Index \(t\).
This study colors the chart bar at Index \(t\) according to the following rules.
- If \(H_t = H_{t - 1}\) and \(L_t = L_{t - 1}\), then the study does not color the bar. Instead, the standard coloring is used (that is, green when \(C_t > O_t\) and red when \(C_t < O_t\)). The standard coloring is automatically used for \(t = 0\).
- If \(H_t > H_{t - 1}\) and \(L_t < L_{t - 1}\), then the entire main price graph bar is colored with the Average Color of the study (the lone color button of the Average Color Subgraph).
- If \(H_t > H_{t - 1}\) and \(L_t \geq L_{t - 1}\), then the entire main price graph bar is colored with the Primary Color of the study (the first color button of the Color Bar Subgraph).
- If \(H_t \leq H_{t - 1}\) and \(L_t < L_{t - 1}\), then the entire main price graph bar is colored with the Secondary Color of the study (the second color button of the Color Bar Subgraph).
For this study to work correctly, the Color Bar Subgraph Draw Style must be set to Color Bar.
The output value for the Color Bar Subgraph is \(1\) if \(H_t \neq H_{t - 1}\) or \(L_t \neq L_{t - 1}\) and \(0\) if \(H_t = H_{t - 1}\) and \(L_t = L_{t - 1}\). The output value for the Average Color Subgraph is \(0\) for all \(t\).
Inputs
This study has no Inputs.
Spreadsheet
The spreadsheet below contains the coloring rules for this study in Spreadsheet format. An image of the chart that was used for the spreadsheet test is included here. Save this Spreadsheet to the Data Files Folder.
Open it through File >> Open Spreadsheet.
*Last modified Friday, 24th January, 2025.