Home >> (Table of Contents) Studies and Indicators >> Technical Studies Reference >> Color Bar Based On Above Below Study
Technical Studies Reference
- Technical Studies Reference
- Common Study Inputs (Opens a new page)
- Using Studies (Opens a new page)
Color Bar Based On Above/Below Study
Description
This study compares the selected Input Data Input (Open, High, Low, Last...) of the main price graph to the study Subgraph selected with the Study Reference Input. The main price graph is used when the Based On setting is set to <Main Price Graph>.
Let \(X_t\) and \(S_t\) be the values of the Input Data and the Study Reference at Index \(t\), respectively, and let \(d\) be the value of the Study Reference Displacement Input. Let \(O_t\) and \(C_t\) be the values of the Open and Close Prices, respectively.
This study colors the chart bar at Index \(t\) according to the following rules.
- If \(X_t = S_{t - d}\), then the study does not color the bar. Instead, the standard coloring is used (that is, green when \(C_t > O_t\) and red when \(C_t < O_t\)). The standard coloring is also used whenever \(t - d < 0\).
- If \(X_t > S_{t - d}\), then the entire main price graph bar is colored with the Primary Color of the study (the first color button of the Color Bar Subgraph). If the Mode Input is set to Color Below, then this coloring is not used; the standard coloring is used instead.
- If \(X_t < S_{t - d}\), then the entire main price graph bar is colored with the Secondary Color of the study (the second color button of the Color Bar Subgraph). If the Mode Input is set to Color Above, then this coloring is not used; the standard coloring is used instead.
For this study to work correctly, the Color Bar Subgraph Draw Style must be set to Color Bar.
If the Output Input Data Values Instead of 1.0 Input is set to Yes, then the output value is \(1\) if \(X_t \neq S_{t - d}\) and \(0\) if \(X_t = S_{t - d}\). If this Input is set to No, then the output value is \(X_t\) if \(X_t \neq S_{t - d}\) and \(0\) if \(X_t = S_{t - d}\).
Inputs
- Input Data: The selected study Subgraph, set through the Study Reference Input is compared to this selected main price graph data.
- Study Reference: The Study Reference Input needs to be set to the specific study and the study Subgraph to compare with the Input Data.
- Mode: Set this to Color Above/Below to color bars where the Input Data is both above and below the selected study Subgraph. Set this to Color below to color bars where only the Below condition is met. Set this to Color above to color bars where only the Above condition is met.
- Output Input Data Values Instead of 1.0: Set this Input to Yes if you want to output the Input Data values. Set to No to output the value of 1.0. This Input does not have any effect if you use one of the Color Bar Draw Styles.
- Study Reference Displacement: Internally when the study is comparing the selected Subgraph of the study being referenced to the Input Data, it can look at displaced values of the Subgraph going forward or backward. Enter a positive value to displace it forward or a negative value to displace it backward.
Spreadsheet
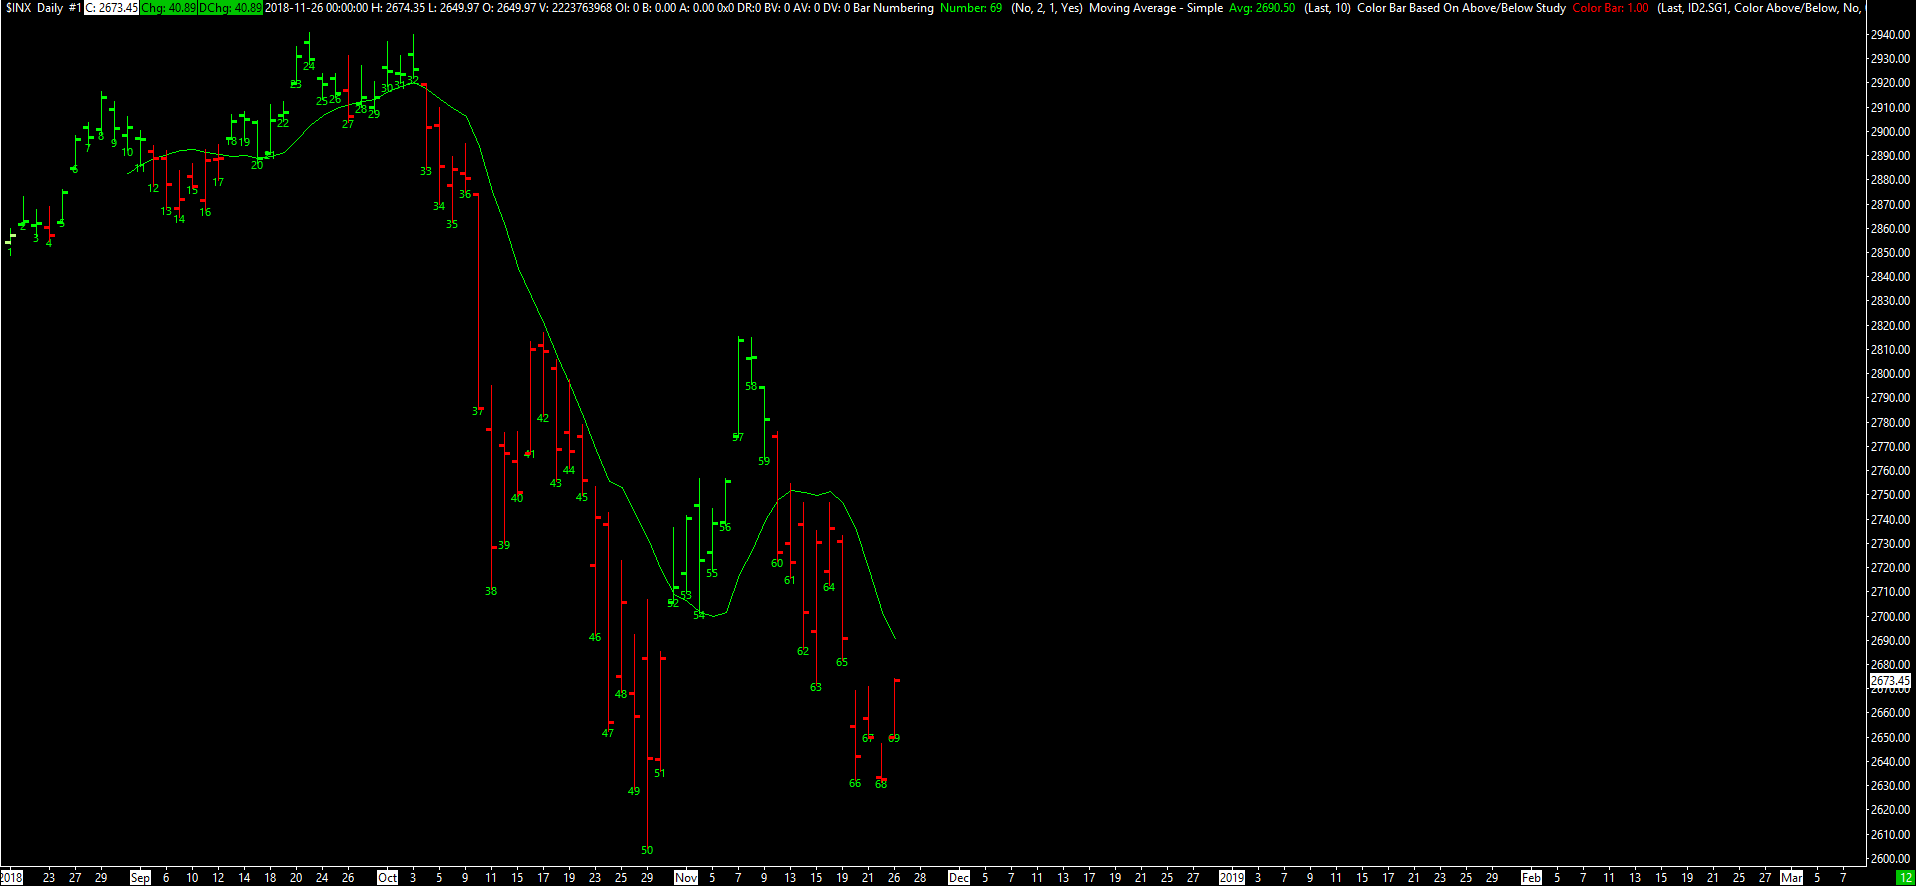
The spreadsheet below contains the coloring rules for this study in Spreadsheet format. A Simple Moving Average was used for the Study Reference. Cells C3 through C11 on the Test sheet are colored yellow because they were calculated using a spreadsheet function, and not by Sierra Chart. An image of the chart that was used for the spreadsheet test is included here. Save this Spreadsheet to the Data Files Folder.
Open it through File >> Open Spreadsheet.
Color_Bar_Based_On_Above_Below_Study.153.scss
*Last modified Friday, 24th January, 2025.