Help With Daily Profit/Loss Value
- Help With Daily Profit/Loss Value
- Inconsistent Daily Profit/Loss Between Charts of Same Symbol and Account
- Consistently Accurate Daily Profit/Loss Value
- Simplified Steps to Solve Incorrect Daily Profit/Loss
- Resetting Daily Profit/Loss
Help With Daily Profit/Loss Value
This help topic explains how the Daily Profit/Loss value you see on the Trade Window and other areas within the chart that show this value, is determined and how to ensure an accurate calculation of the Daily Profit/Loss. The information on this page applies to current versions of Sierra Chart.
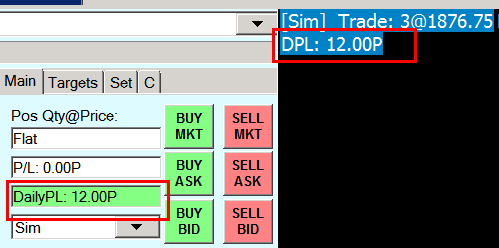
The Daily Profit/Loss can be optionally be displayed at the top left of a chart or Trade DOM. The Daily Profit/Loss is prefixed with DPL: / NPL:. Refer to the image below.
This documentation also applies to the Net Profit/Loss (NPL:/N:) when Global Settings >> Chart Trade Settings >> Include Open P/L in Chart/Trade DOM P/L Display is enabled. The Net Profit/Loss is Daily Profit/Loss plus Open Position Profit/Loss.
The Daily Profit/Loss is client-side calculated from order fills. There are things that can and do go wrong which can affect the calculation which Sierra Chart does not have control over. The main item that can go wrong is missing order fill records during the trading day.
The documentation on this page primarily applies to non-simulated trading but also applies to simulated trading. Since simulated trading functions in a very well controlled environment within Sierra Chart, generally there should not be inaccuracies with the Daily Profit/Loss, but there can be circumstances where there could be. This page goes into detail explaining how the Daily Profit/Loss is determined.
There can also be incorrect Symbol related settings which can affect the displayed Daily Profit/Loss value and can cause inconsistencies. For more information about these settings, refer to Profit/Loss Calculations and Symbol Settings.
It needs to be understood that Sierra Chart is an independent Trading and Charting program which is integrated with various Trading services. Sierra Chart also has its own Trade Simulation Mode.
You cannot compare the Daily Profit/Loss value that you see within Sierra Chart to a brokerage account statement. Or other trading programs connected to your trading account. Inevitably there are going to be calculation differences for various reasons which can result in a different value. This particular help topic guides you through how the calculations are arrived at within Sierra Chart and how to determine if there is an incorrect setting or a problem with the order fill data.
Additionally there can also be missing order fills which is a typical problem due to the limited order fill data on trading servers, which leads to an incorrect Daily Profit/Loss value. Some services like the Sierra Chart Order Routing Service, BitMex, and the Sierra Chart LMAX connection, maintain long-term order fill history and missing order fills will not be a problem with these services.
- It is important to understand exactly what the Daily Profit/Loss is and how it is calculated within Sierra Chart. The Daily Profit/Loss value includes the total Profit/Loss for Trades (consisting of an opening order fill and a closing order fill) that were opened either in the current or a prior day, and closed within the current trading day. So even if a position from a prior day is closed in the current day it will be added to the Daily Profit/Loss. This is the case effective with version 1815 and higher.
- The Daily Profit/Loss may not display in a Historical Daily or longer timeframe chart if the Date-Time of the last bar in the chart is a day ahead of the Date-Time of the Trades in the current trading day. Therefore, only use Intraday charts or a Trading DOM when relying on Daily Profit/Loss values within a chart or Trading DOM.
- Select Global Settings >> Chart Trade Settings. Uncheck the Include Open P/L in Chart/Trade DOM P/L Display (NPL) option if it is already enabled. Press OK. This will remove the Open Profit/Loss from being added to the Daily Profit/Loss, which will give you the Net Profit/Loss. This avoids confusion.
It is also important to understand that the Open Profit/Loss which is added to the Daily Profit/Loss is not based upon necessarily what you see for the Open Profit/Loss on the Trade Window because there are various calculation methods for the current Position Open Profit/Loss as displayed on the Trade Window. The particular Open Profit/Loss which is added to the Daily Profit/Loss is internally calculated in the charts Trades list using by default a FIFO calculation method which may be different than the separate Open Profit/Loss you see displayed directly on the Trade Window.
To use a LIFO calculation for the Open Profit/Loss which is added to the Daily Profit/Loss, enable the Use Last In First Out Fill Matching in the Chart Settings. - The start of the trading day for the Daily Profit/Loss is according to the Chart >> Chart Settings >> Trading >> Start Time for Trades List setting. When there is a new order fill compared to the prior order fill which crosses this time, then the Daily Profit/Loss resets back to 0.
Remember when opening the Chart >> Chart Settings window, you are opening the Chart Settings for the chart which is active. Each chart has its own settings window.
For more information, refer to Understanding Daily Trade Statistics Reset Time. - To control what order fills are used in the Daily Profit/Loss calculation it is important to accurately control what is the first order fill loaded into the chart. By default the first order fill loaded is going to be based upon the available order fills at or after the Date-Time of the first bar in the chart.
In the case of when using Trade Simulation Mode, all of the available order fills are loaded into the chart.
It is essential that the very first order fill that is loaded into the chart is the start of a new Trade Position. If it is not, this will throw the Daily Profit/Loss calculation off. For further information, refer to Understanding and Setting the Start Date-Time for a Trades List.
Sierra Chart has a Chart >> Chart Setting to automatically filter out fills since the starting Date-Time for order fills loaded in the chart, which does not establish a new position. This is Filter Initial Fills Which Are Part of Existing Position. This is on the Trading tab.
It is recommended that this option be enabled.
For complete details about this, refer to Consistently Accurate Daily Profit/Loss Value. - To load order fills for the current day only, enable Chart >> Chart Settings >> Trading >> Load Order Fills for Current Day Only.
However, you need to be conscientious of what is considered the start of the day and that is according to the Chart >> Chart Settings >> Trading >> Start Time for Trades List setting.
Load Order Fills for Current Day Only is only useful if there was no prior Trade Position in the prior trading day which is carried forward into the current trading day, according to the Start Time for Trades List setting. Otherwise, do not enable it. Using the Load Order Fills for Current Day Only option will affect the Position Quantity for simulated trading.
Remember when opening the Chart Settings window, you are opening the Chart Settings for the chart which is active. Each chart has its own Chart Settings window. - Alternatively set the Chart >> Chart Settings >> Trading >> Order Fills Start Date-Time. This is usually going to be the better option to use. Set this to the starting Date-Time when your Trade Position was flat for the Symbol and Trade Account of the chart or Trade DOM, just before you began trading for the current day. It is better to use this particular setting and periodically update it.
Make sure this is set far enough back in time to include the order fills for the last 24 hours so there is sufficient data for the Daily Profit/Loss calculation.
If you are not sure what to set it to, then if your Trade Position is currently flat, then set it to the current Date-Time according to the time zone of the chart. If you currently have a Trade Position, then wait until it is flat and then set it at that time to the current Date-Time.
It does not need to be updated every day. If it goes back several days that is fine. But it just needs to be set to a point in time where the Trade Position was flat and there must not be any missing order fills since that time. If there is even a single missing fill this will very likely lead to a problem with the Daily Profit/Loss calculation.
Remember when opening the Chart Settings window, you are opening the Chart Settings for the chart which is active. Each chart has its own settings. - After you have completed the settings above, you can can see the Date-Time of the actual first order fill loaded in the chart through the Trade >> Trade Activity Log >> Trade Stats for Charts tab. Look at the Order Fills Start Date-Time field along the row for the chart.
- It is essential that there are no missing order fills since that Date-Time. To see that you have the order fills, look for them in the Trade >> Trade Activity Log. Refer to Viewing Historical Trade Activity.
In the case of live trading to avoid missing order fills use the Teton Order Routing Service. - Additionally, to help ensure there are no missed order fills, trading must be done directly from Sierra Chart.
- To see that there are no missing order fills and you have the correct starting Date-Time preloading the order fills, go to the Trade >> Trade Activity Log >> Trade Stats for Charts tab. Locate the chart in the list of charts. Not every chart will be listed but if it is not listed, an equivalent chart will be listed.
Look at the Open Quantity field. If that is indeed your current Position Quantity for the Symbol and Trade Account of the chart, then you are good. For an explanation of how the Open Quantity field is calculated, refer to Chart Trade Stats Open Quantity Field Calculation - If the Open Quantity field is not correct on the Trade Stats for Charts tab, you need to make sure there are no missing order fills for the Symbol and Trade account of the chart and adjust the Order Fills Start Date-Time for the chart.
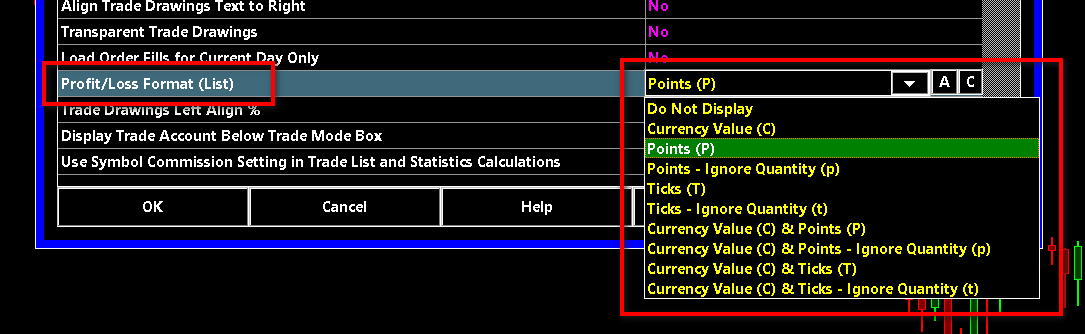
- Verify you have the correct Profit/Loss Format set in Chart >> Chart Settings >> Trading. Refer to Profit/Loss Format. The letter after the Daily Profit/Loss indicates the format being used. For example, if you want to see a Currency Value and you see the letter P suffix after the Profit/Loss value, then you are looking at Points and not a Currency Value.
- The standard method of matching order fills uses a First In First Out method. It is also supported through the Chart >> Chart Settings >> Trading >> Open Position Average Price setting to base the calculation on Last In First Out. It is recommended to use one of the First In First Out settings, but make sure you are using what you want.
- Select Chart >> Chart Settings >> Trading. Uncheck Use Symbol Commission Setting in Trade List and Statistics Calculations to remove the commission calculation from the Daily Profit/Loss value in the chart which avoids any unnecessary confusion when understanding the calculation result.
- To view what the Daily Profit/Loss was for a prior date, select Chart >> Chart Settings. Enable the Use Date Range option and then enter a From date which is at least one day prior to that date and enter a To date which is the date you want to look at the Daily Profit/Loss for.
- The Daily Profit/Loss value is calculated from the order fills available for the Symbol and Trade Account of the chart. To view these order fills, select Trade >> Trade Activity Log.
- Select the Trade Activity tab.
- On the Trade Activity Log, at the top left select Fills.
- Select the Symbol from the list of symbols. In the case of when you are using Sierra Chart Trade Simulation Mode, the symbol will be prefixed with [Sim].
- Select the Trade Account you want to see order fills for from the list of Trade Accounts. This needs to be the same Trade Account that the Trade Window for the chart is set to.
- In the Date Range to Display frame, set the starting From >> Date to the same date that you see in the Order Fills Start Date-Time field for the chart listed in Trade >> Trade Activity Log >> Trade Stats for Charts tab. However, if Chart >> Chart Settings >> Trading >> Start Time for Trades List is blank or set to 00:00, you will want to set this From >> Date to one day earlier than what you see for that field to ensure all of the order fills which are required are loaded.
Set the Time to the same time as Chart >> Chart Settings >> Trading >> Start Time for Trades List.
In a chart, the start of the trading day is according to Chart >> Chart Settings >> Trading >> Start Time for Trades List. In the Trade Activity Log, the start of the trading day for Daily calculations is according to the Date Range to Display >> From >> [time] setting. This is critical to understand. - Make sure To >> Today is checked.
- Uncheck the Use Commission setting to remove the commission calculation from the Daily Profit/Loss value.
- Press the Apply button.
- For further details, refer to Viewing Historical Trade Activity.
- Look at the fills in the Trade Activity tab and make sure they are all there for the current trading day.
- Make sure the Fill Price is correct for each fill.
- Make sure the Date-Time of the order fill is correct. If the Date-Time of the order fill is incorrect, then make sure your computer's clock is set accurately. For further details, refer to Incorrect Date and/or Time Display.
- If there are any missing or inaccurate fills, they can be inserted or edited using the Edit menu of the Trade Activity Log. Refer to the Menu Commands documentation.
The reason why missing order fills can exist is because most trading servers do not provide historical order fills for other than the current trading day and they are cleared at the end of the trading day. For more information, refer to Missing Order Fills from Trade Activity Log.
If you are using the Teton Order Routing Service or the Simulated Futures Trading Service you will not have missing order fills because they deliver long-term historical order fills (up to 1 year) with detailed information to generate consistently accurate and reliable trading statistics including the Daily Profit/Loss. - Select the Trade Statistics tab on the Trade Activity Log. In the Daily Trades column, the Closed Trades Profit/Loss field will show your Daily Profit/Loss value and should match what you see in the chart.
- Select the Trades tab on the Trade Activity Log.
- On the Trades tab, you can see how all of the order fills are grouped into individual Trades. One thing to be aware of is that it is possible that a closing fill within the current trading day, could have been matched up to an order fill in a prior trading day.
- For various technical reasons there is no guarantee as to the accuracy or completeness of the order fill data. Sierra Chart is not the provider of the backend trading system you are connected to and usually the backend trading system only maintains and historical order fill data for 1 day.
Therefore, there is always a possibility order fills can be missed in the case of non-simulated trading.
This section does not apply to the Teton Order Routing Service. - Finally, if support has referred you to this page, then as a matter of policy we do not provide any help beyond referring to this documentation with Daily Profit/Loss calculations. If you have a question about it and it does not look right, there is no further help we will provide.
Inconsistent Daily Profit/Loss Between Charts of Same Symbol and Account
When you see a different Daily Profit/Loss value between charts of the same symbol and the same Trade Account, then this means that the first order fill loaded into those charts is different compared to the other.
Select Chart >> Chart Settings.
Make sure the following two settings are set identically between the charts or Trading DOMs:
Consistently Accurate Daily Profit/Loss Value
The information below applies not only to the Daily Profit/Loss but to the Trade Statistics and Trades tabs within the Trade Activity Log, order fills displayed on the chart and the entry/exit connecting lines for those order fills.
When using Trade Simulation Mode, the Daily Profit/Loss value will consistently be accurate according to the relevant settings which are explained in the Help With Daily Profit/Loss Value section on this page. Although refer to Trade Simulation Position Quantity Calculation. Make sure you are running a current version of Sierra Chart.
When using the Sierra Chart Futures Order Routing Service or the Simulated Futures Trading Service, there will also be consistently accurate Daily Profit/Loss values and other Trade Statistics.
The reason that this can be achieved with Trade Simulation Mode or the specified Trading services above is that with each order fill, the Position Quantity that exists just after the fill is recorded with the fill and there is always a complete set of historical order fills available on the server, unlike with other external Trading services which only provide historical fills for the current day. Whereas Sierra Chart provided Trading services provide order fills for at least 1 year. A dramatic difference!
However, for non-simulated trading it is necessary that Chart >> Chart Settings >> Trading >> Filter Initial Fills Which Are Part of Existing Position is enabled. This means there is the automatic management of order fills loading where the first fill is aligned to the start of a Trade Position which ensures accurate Trade Statistics. For complete details, refer to Automatically Aligning First Loaded Order Fill to Beginning of Position.
There can be some rare exceptions where there could still be a problem which would require manual intervention by disabling Chart >> Chart Settings >> Trading >> Filter Initial Fills Which Are Part of Existing Position and setting the Order Fills Start Date-Time to the Date-Time of the fill, or just before, which is the start of a Trade Position.
However this would be a rare exception. In general, nearly all of the time there is not going to be a problem with the Daily Profit/Loss value like there will often be with other supported external Trading services.
Simplified Steps to Solve Incorrect Daily Profit/Loss
Follow the below simplified steps to ensure an accurate Daily Profit/Loss value in a chart, when it is not accurate.
The information in this section is also applicable to correcting problems with the display of order fills on a chart.
- Optional Step: Make sure there are no missing order fills for the Symbol and Trade Account of the chart for the current trading day or since the start of the current Trade Position you have. Check the Trade Activity Log for the order fills.
If there are any missing order fills, then refer to Automatically Inserting Missing Order Fills. - Go to the chart and set the Chart >> Chart Settings >> Trading >> Start Time for Trades List to a time that is according to what is considered the start of the day. For more information, refer to Understanding Daily Trade Statistics Reset Time.
If you are not sure how to set Start Time for Trades List, just leave it at 0 if you are starting trading sometime after midnight and finishing trading before the end of the trading day. If you are starting trading in the evening according to the exchange time zone, then you will need to set Start Time for Trades List differently.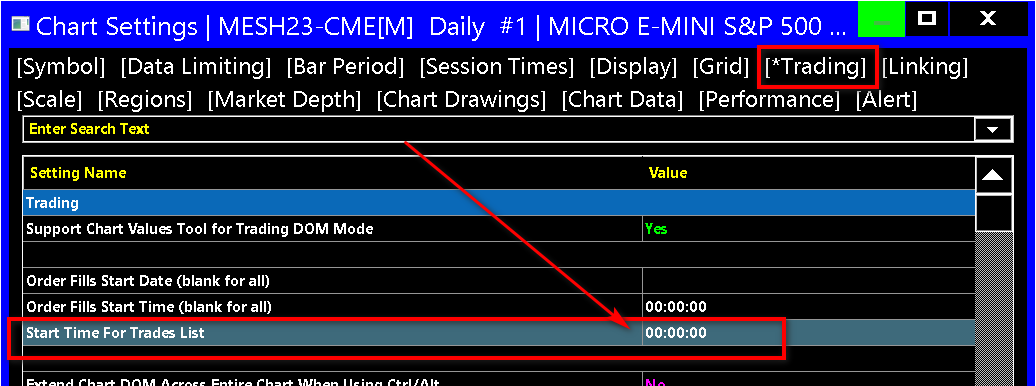
- Set the Order Fills Start Date-Time in Chart >> Chart Settings >> Trading for the chart to the Date-Time, in the time zone of the chart, of the first order fill which is part of the current trading day.
If you have no current Trade Position or there was no trading in the current trading day for the Symbol and Trade Account of the chart, then set these Date and Time settings to the current Date-Time.
Once properly set Order Fills Start Date-Time does not need to be subsequently changed, so long as there are no missing order fills. For more information, refer to Understanding and Setting the Start Date-Time for a Trades List.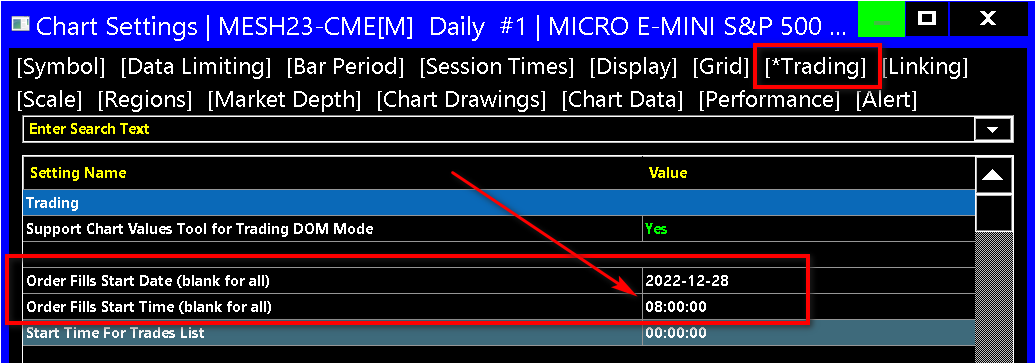
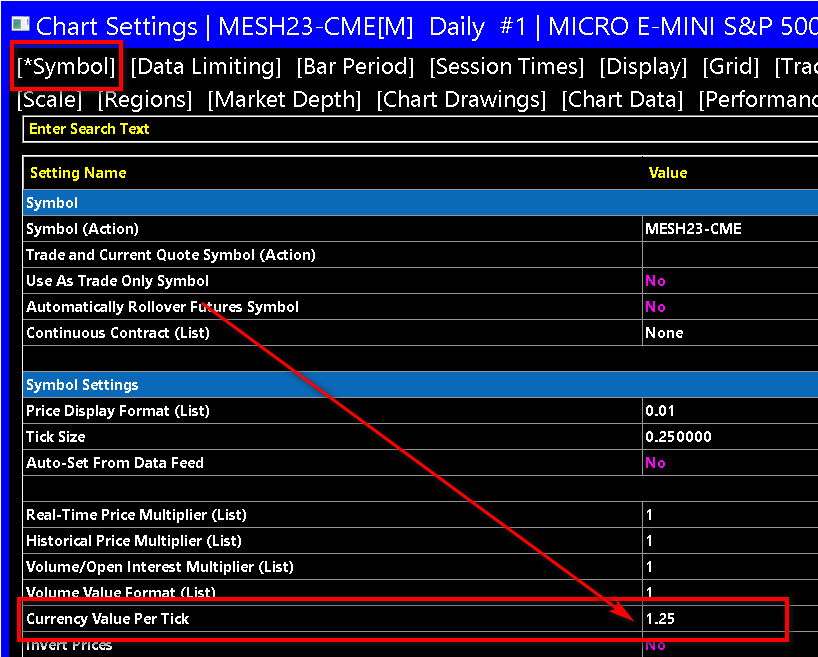
- Make sure the Currency Value per Tick setting in the Chart >> Chart Settings >> Symbol tab for the symbol being traded is set correctly.
- Make sure the Filter Initial Fills Which Are Part of Existing Position setting in Chart >> Chart Settings >> Trading for the chart is enabled (Yes). However, if Order Fills Start Date-Time is set correctly, it is recommended that the Filter Initial Fills Which Are Part of Existing Position setting be set to No.
- Optional Step: If you are trading futures and using a Trading service other than the Teton Order Routing Service, like CQG or whatever, it is recommended that if you are trading the CME Group, to use the Teton Order Routing Service. In this way you will have a complete set of order fills with no missing order fills, which contain the Position Quantity with each fill. All of this ensures consistently accurate Daily Profit/Loss calculations.
Resetting Daily Profit/Loss
To reset the Daily Profit/Loss for a particular chart or Trading DOM and also all of the Trade Statistics, select Chart >> Chart Settings.
Select the Trading tab.
Set the Order Fills Start Date-Time to the current Date and Time. Typically you would do this when the position is flat for the Symbol and Trade Account of the chart.
*Last modified Thursday, 13th February, 2025.