Controlling Visibility of Chart Drawings on Different Chart Bar Time Frames
Introduction
Newer versions of Sierra Chart support controlling the visibility of Chart Drawings based upon the chart bar timeframe.
By default a Chart Drawing is displayed and visible on all chart bar timeframes.
Sierra Chart supports multiple types of chart bar time frames. For example, Daily bars, 1 Minute bars and any fixed timeframe bar, and Number of Trades, Volume, Range, Reversal, Renko, Delta Volume, Price Change, Point and Figure Bars.
Instructions
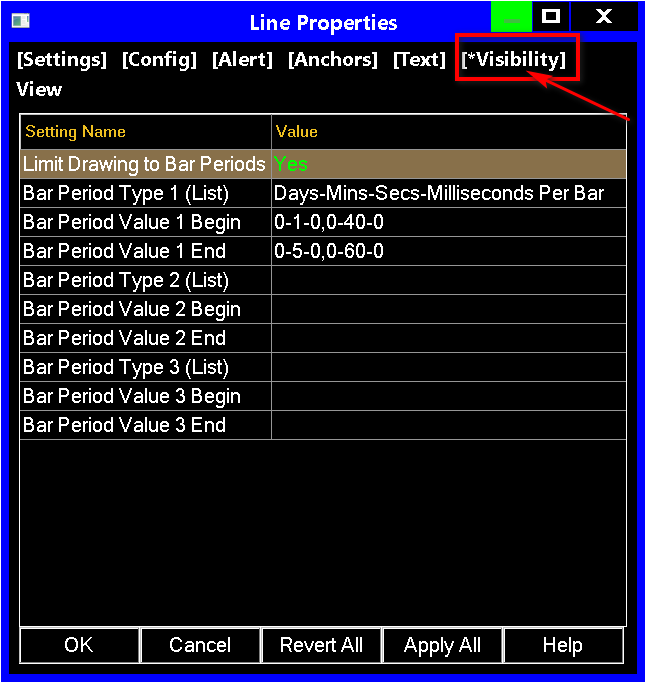
The interface for controlling the visibility of a Chart Drawing is through Drawing Tool Configuration or Chart Drawing Properties window. These Settings Windows have a Visibility tab for configuring the relevant settings.
The Visibility tab allows you to specify up to three different Chart Bar Period Types. For example, based upon a fixed time frame (Days-Minutes-Seconds), or a variable time frame like Number of Trades.
The settings for each Bar Period Type support the beginning and ending values for a range of Periods for the specified Bar Period Type.
For example, if you want a Line drawing to be visible on bar time frames from 1 Minute through 5 Minutes, then set the following settings:
Set Bar Period Type # to Days-Minutes-Seconds-Milliseconds.
Set Bar Period Type # Begin to 0-1-0.
Set Bar Period Value # End to 0-5-0.
Multiple sets of ranges can be specified, within the Bar Period Value # Begin and Bar Period Value #1 End settings. For example, if you want to specify a Line drawing to be visible on 1 Minute bars through 10 Minute bars and also visible on 60 minute bars through 120 minute bars, then set the following settings:
Set Bar Period Type # Begin to 0-1-0, 0-60-0.
Set Bar Period Value # End to 0-10-0, 0-120-0.
Settings
- Limit Drawing to Bar Periods: Set this to Yes to use the following settings to limit the visibility of a Chart Drawing to the specified bar timeframe ranges.
When this is set to No, the Chart Drawing will be visible on all chart bar timeframes without restriction. - Bar Period Type 1: The Chart Bar Period Type for which the next two settings are for. For the different types of settings, refer to Bar Period Type.
- Bar Period Value 1 Begin: The beginning Value of the range of values for the selected Bar Period Type 1 for which the Chart Drawing will be displayed on. The exact value to enter here depends upon the Bar Period Type. For more information, refer to Bar Period Type.
There can be multiple values separated with a comma character (,). For each begin Value separated by a comma, it corresponds to the Value in the Bar Period Value 1 End setting in the same location. For example, if Bar Period Value 1 Begin is 5,50,100 and Bar Period Value 1 End is 10,75,150, then this means that the ranges are 5 to 10, 50 to 75, and 100 to 150. - Bar Period Value 1 End: The ending Value of the range of values for the selected Bar Period Type 1 for which the Chart Drawing will be displayed on. This value is also included. For details for what is specified here, refer to Bar Period Value 1 Begin.
- Bar Period Type 2: Same as Bar Period Type 1, except used for the second Bar Period Type. This is an optional setting. It remains unused if Bar Period Value 2 Begin/End are blank.
- Bar Period Value 2 Begin: Same as Bar Period Value 1 Begin, except used for the second Bar Period Type begin values.
- Bar Period Value 2 End: Same as Bar Period Value 1 End, except used for the second Bar Period Type end values.
- Bar Period Type 3: Same as Bar Period Type 1, except used for the third Bar Period Type. This is an optional setting. It remains unused if Bar Period Value 3 Begin/End are blank.
- Bar Period Value 3 Begin: Same as Bar Period Value 1 Begin, except used for the third Bar Period Type begin values.
- Bar Period Value 3 End: Same as Bar Period Value 1 End, except used for the third Bar Period Type end values.
*Last modified Sunday, 02nd March, 2025.