Home >> (Table of Contents) Studies and Indicators >> Technical Studies Reference >> Depth Of Market Data
Technical Studies Reference
- Technical Studies Reference
- Common Study Inputs (Opens a new page)
- Using Studies (Opens a new page)
Depth of Market Data
Description
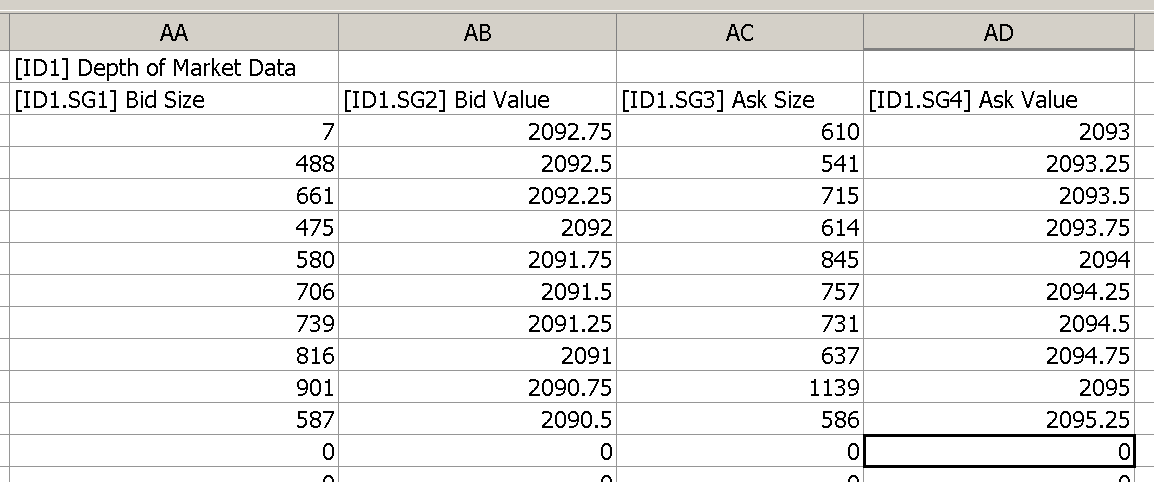
This study will display the current Depth of Market Data. It is intended to be used with the Spreadsheet Study.
When using this study, also add the Spreadsheet Study to the chart. The Spreadsheet System for Trading study and the Spreadsheet System/Alert study can also be used as well.
The depth of market data will be visible at column AA or after on the Spreadsheet depending upon what other studies are on the chart and the number of Formula Columns.
Since the study graph itself is probably not very informative to be viewed directly on a chart, you will probably want to hide it. To do this, enable the Hide Study setting in the Study Settings window for this study.
The values of this study can be accessed through Alert Condition Formulas of Simple Alerts. Refer to Referencing Other Studies on the Chart.
This study also supports outputting to a Spreadsheet the following data: Bid Stack/Pull Value and Ask Stack/Pull Value. To see this information on a Spreadsheet add the Spreadsheet Study as explained above to the chart and set the Input for Do Not Output Subgraphs Set To Ignore to No. It is also necessary to have the Ask/Bid Pulling/Stacking Columns displayed in a DOM for the same symbol as the symbol of the chart that this study is applied to.
Inputs
This study has inputs.
*Last modified Wednesday, 08th October, 2025.