Home >> (Table of Contents) Help/Frequently Asked Questions >> Help topic 50: How to Eliminate Repeating Bars With Volume Bar Based Charts
How to Eliminate Repeating Bars With Volume Bar Based Charts

If the bars in an Intraday chart are based upon a specific Volume setting, then there are two possible issues you may encounter due to the data. They are both explained below.
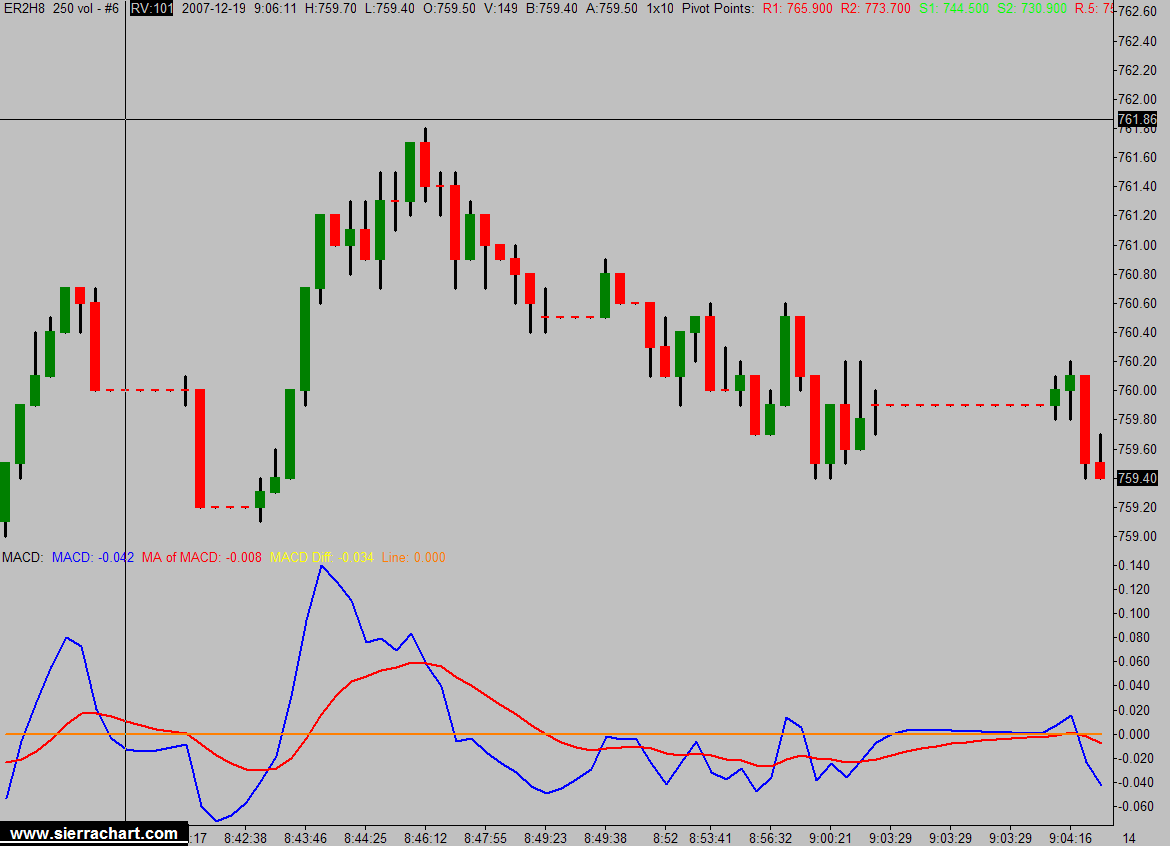
- If you see one or more bars that are just a flat line, then you probably have trades with a very large volume. An example of repeating flatline bars is shown on this page. This occurs because trades can be split to distribute the volume among bars in order to create bars which exactly match your Volume per Bar specification. To disable this effect select Chart >> Chart Settings >> Chart Data and uncheck the Split Data Records option.
- Another issue is where you see repeating non-flatline bars in sequence. This occurs because the Intraday data records for a symbol are not a single trade (1 tick).
For example, if the historical data downloaded from the Data/Trade service you are using is in 1 Minute units, then this would cause the volume bars in your chart in certain locations to be the same and would repeat due to record splitting as explained above.
The primary way to solve this issue adjust your settings as explained in the first section of help topic 47. You can also disable the Split Data Records option as explained above.
*Last modified Wednesday, 05th July, 2023.
