Home >> (Table of Contents) Help/Frequently Asked Questions >> Help topic 18: Unable to Change Bar Period for Charts
Unable to Change the Bar Time Period for Charts
- Chart Being Referenced by Another Chart Preventing Bar Time Period Change
- Using TPO Profile Chart Preventing Bar Time Period Change
- Tool Drawing Mode Preventing Bar Time Period Change
This page documents the different reasons why it is not possible to change the chart bars time period or timeframe, the Days to Load or Date Range settings, or the Session Times in a chart and provides solutions.
Chart Being Referenced by Another Chart Preventing Bar Time Period Change
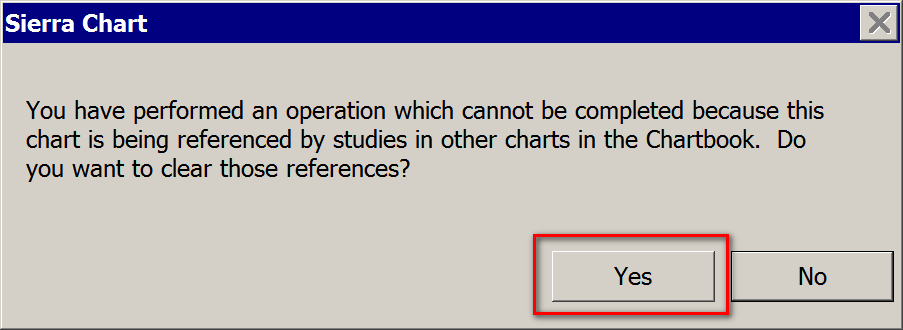
When you try to change the bar time period or timeframe of the bars, the Chart Data Type, the Days to Load or Date Range settings, or the Session Times in a chart and you receive a prompt like in the image below or the changed settings like the bar time period revert back to the previous setting, then one reason this will occur is when the chart is being referenced by a study like the Difference, Ratio, or Overlay (Bar/Single Line) study from another chart or some other study which references another chart which will cause the bar time period, Chart Data Type, the Days to Load or Date Range settings, and the Session Times in a chart, to be synchronized between the two charts.
The following are the general steps to resolve this kind of issue:
- Make sure you are running a current version of Sierra Chart. Refer to Fast Update to update. In newer versions of Sierra Chart, you will receive a prompt like the one above which works to resolve the problem.
- If you receive a prompt about a chart being referenced by another chart when you try to change the bar time period or timeframe of the bars in the chart, then if you want to maintain that reference to the chart, stop at this step.
What you can do is open up another chart which is not being referenced by another study. Do this through File >> Find Symbol. At this point you can stop here if this solves the problem. - If you receive a prompt about a chart being referenced by another chart when you try to change the bar time period or timeframe of the bars in the chart, then press Yes to clear the reference if you do not want it or do not understand the purpose of it. At this point you can stop here if this solves the problem.
- Go to the chart that you are unable to change the bar time period for and select Chart >> Chart Settings. On the title bar of the Chart Settings window if you see RefBy: # (refer to the image below), then this indicates that the chart is being referenced by a study on another chart. If you do not see this, then the reference does not exist and what is described in this section here is not the problem. Make a note of that Chart Numbers referencing the chart, if any.
- Press Cancel to close the Chart Settings window.
- Go to each chart specified by the Chart Numbers displayed after RefBy: # on the Chart >> Chart Settings window. You can access these charts through the CW menu. The CW menu lists the Chart Numbers of each chart within the active open Chartbook.
- Go through the studies on each chart by selecting Analysis >> Studies >> [select study] >> Settings and look for study Inputs which contain the name Chart Number.
- You will need to modify those Inputs to reference a different Chart Number if they are making a reference to the chart you are trying to change the chart bar time period of.
Using TPO Profile Chart Preventing Bar Time Period Change
When using the TPO Profile Chart study on an Intraday chart, the time period of the underlying bars in the chart will be set to 1 Minute. If you try to set them to another time period, then they will revert back to 1 Minute.
In the case of using the TPO Profile Chart study on a Historical Daily chart, the bar time period will be 1 Day and cannot be changed either.
Tool Drawing Mode Preventing Bar Time Period Change
When you try to change the bar time period for a chart through the keyboard and it does change, then this is most likely because the Erase Drawing Mode, Move Drawing or a similar type of Chart Drawing tool is active on the Tools menu.
Select a different tool on the Tools menu, like Tools >> Pointer.
*Last modified Wednesday, 22nd February, 2023.


