Sierra Chart - Image Gallery
This is the public chart image gallery. To share a chart image, select Edit >> Screen Images >> Upload Chart on the Sierra Chart menu to upload a chart. Select Help >> Account Management. Click on Manage Images. Locate the chart image among the images you have uploaded. Add a note to it if you wish. And click on Share Image in the Public Image Gallery. That's it!
Available Pages
View Image | View Image with the note
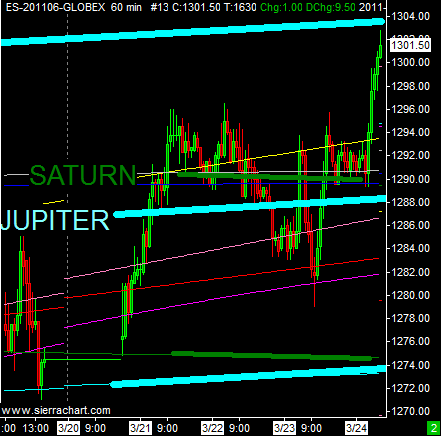
Image Uploaded on 2011-03-24 using SC version 685 Note: Planetary Lines with Astro Trading kit for Sierra Chart Add On |
View Image | View Image with the note
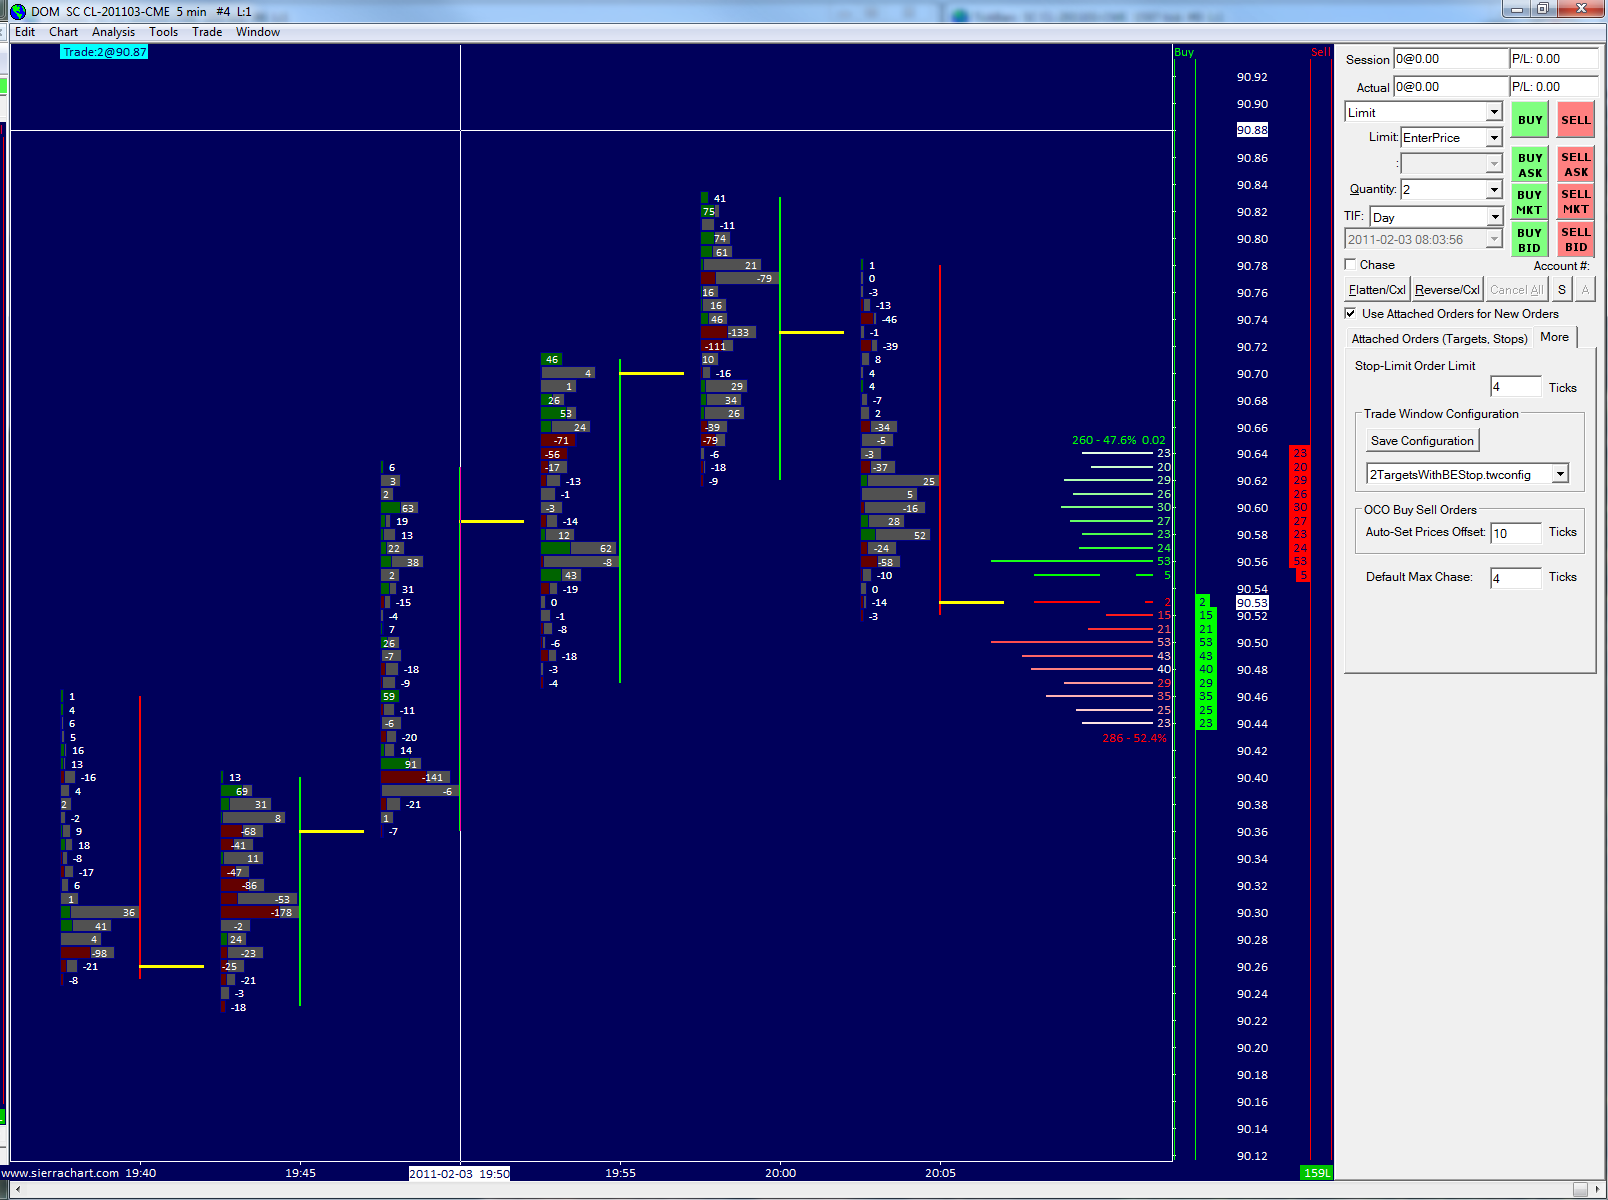
Image Uploaded on 2011-02-03 using SC version 674 by chrislb Note: Simple 5min bar chart with VbP set to 5min too. Volume Display set to Ask-Bid Volume (Delta) and bar width to 50% period length. |
View Image | View Image with the note
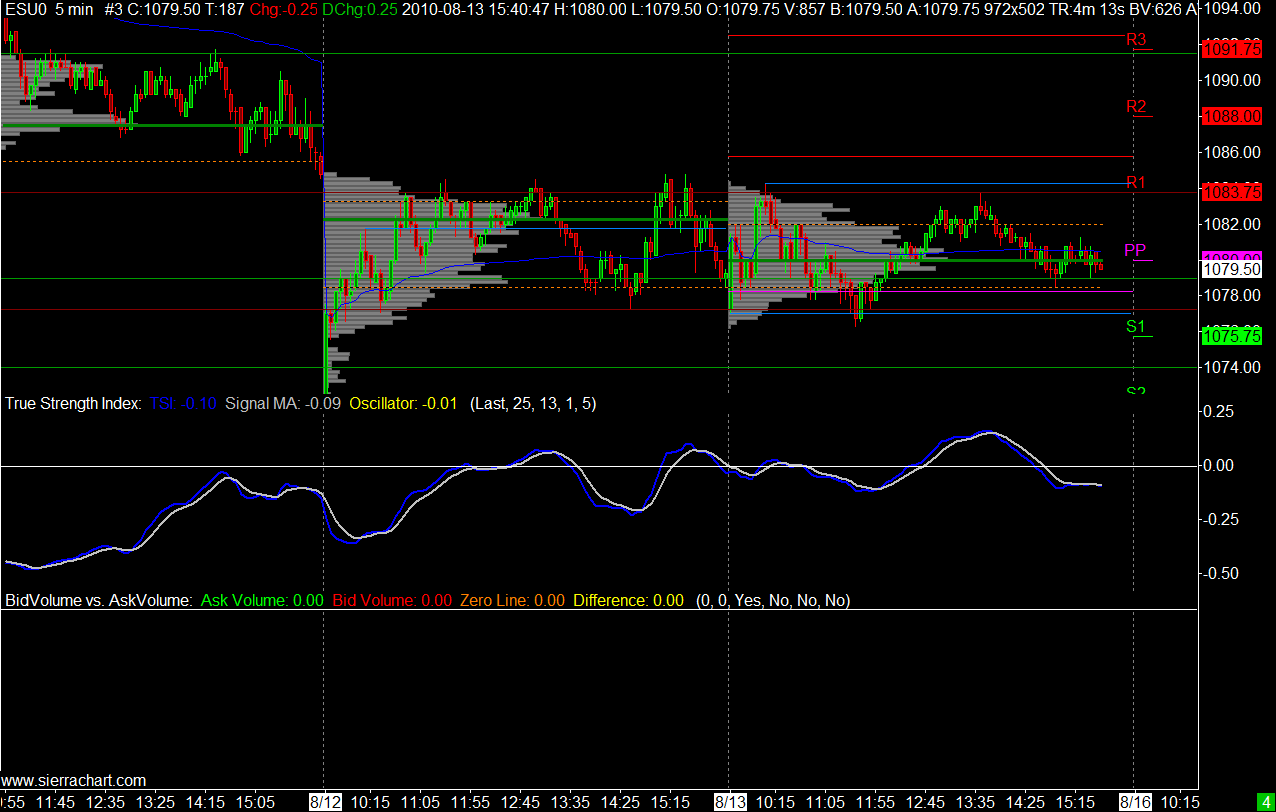
Image Uploaded on 2010-08-13 using SC version 622 by ES8_12-8_13 |
View Image | View Image with the note
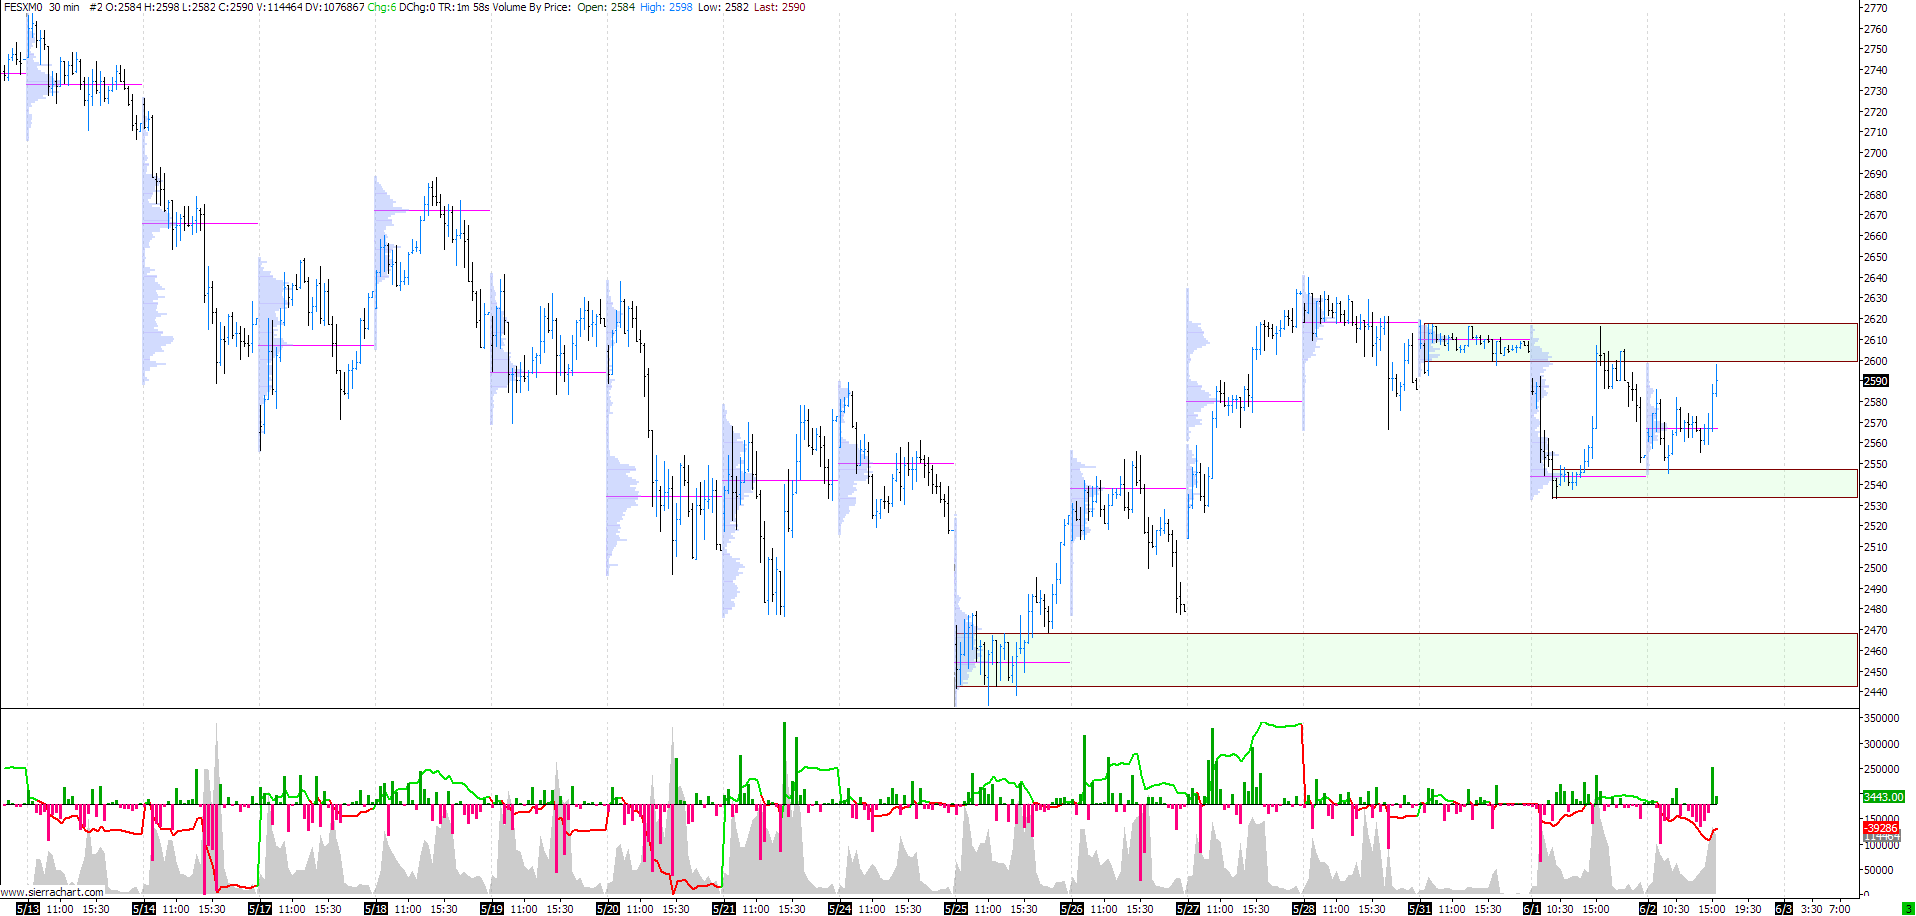
Image Uploaded on 2010-06-02 using SC version 600 by Pete |
View Image | View Image with the note
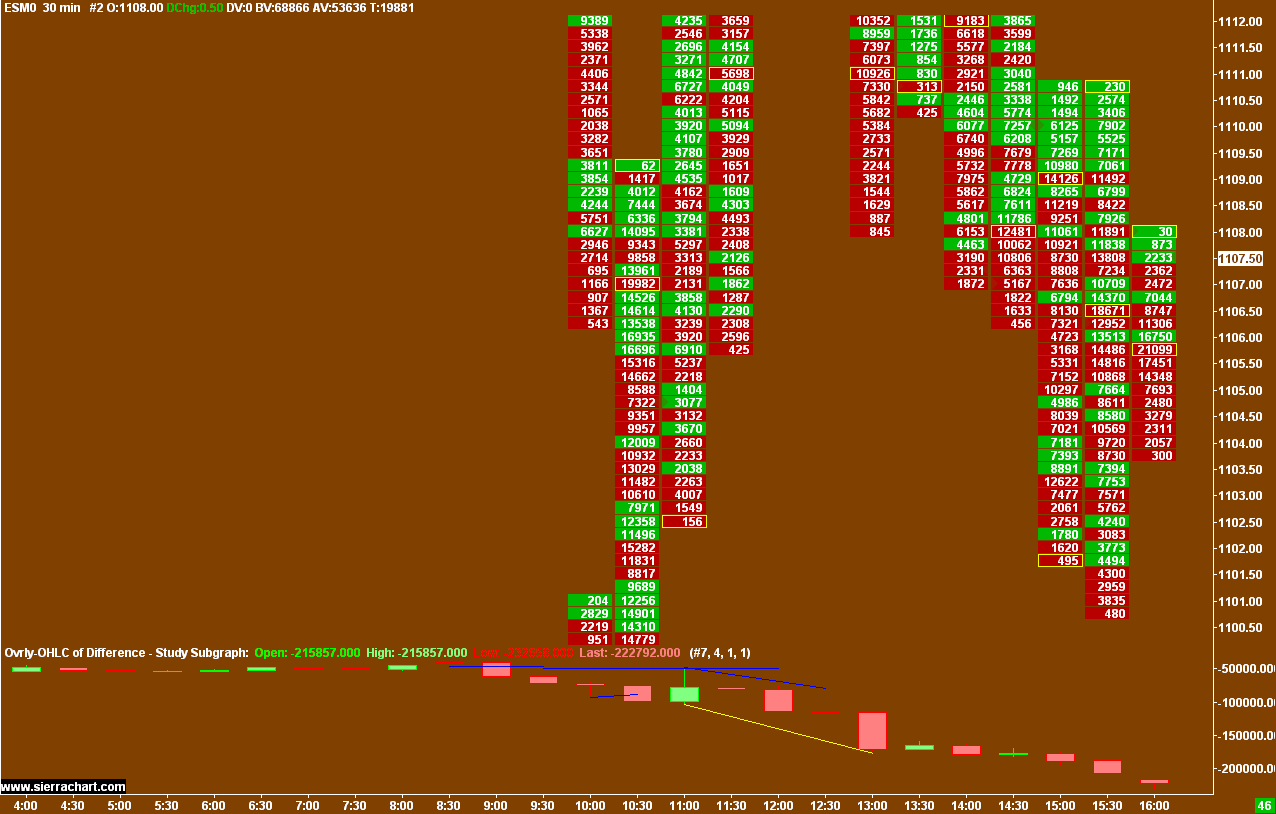
Image Uploaded on 2010-05-08 using SC version 600 by WarriorTrader Note: 30 min number bars with Cumulative Delta candlestick |
View Image | View Image with the note
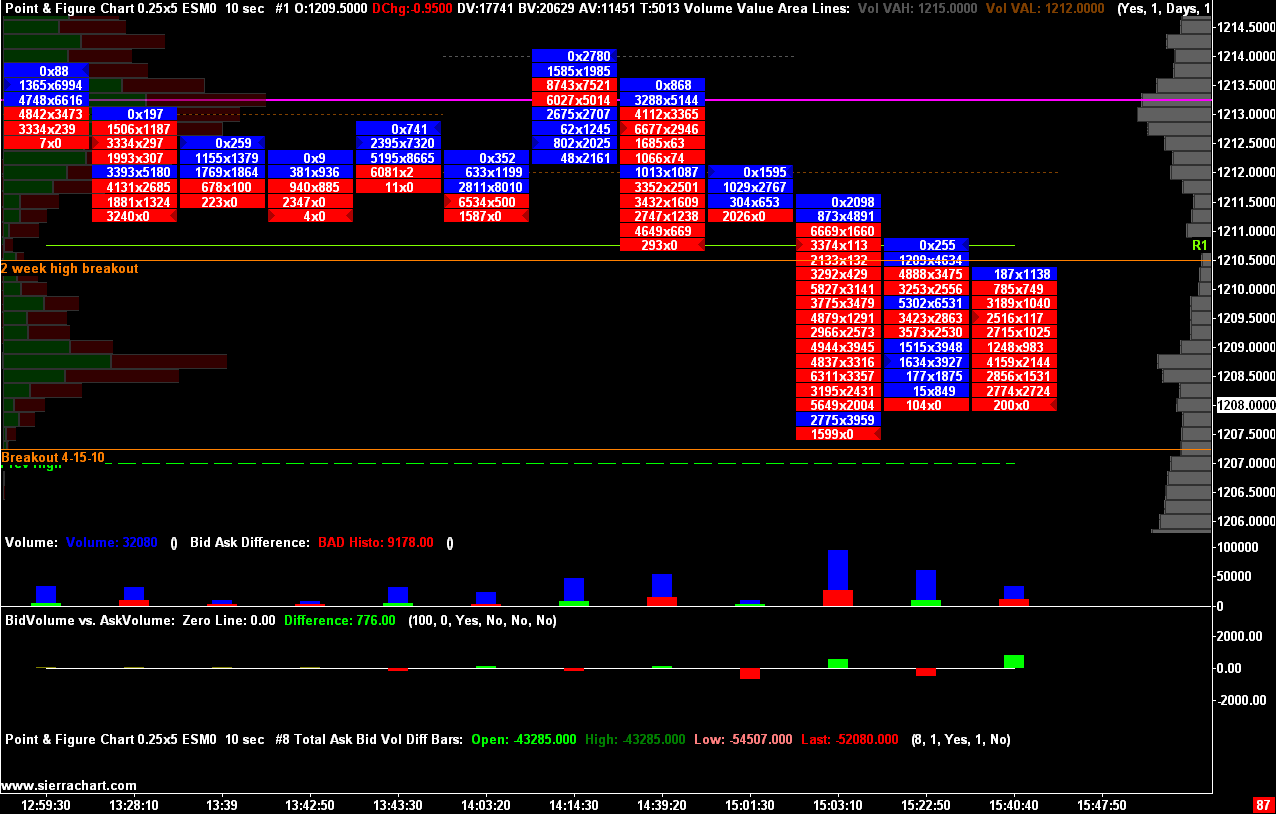
Image Uploaded on 2010-04-26 using SC version 593 by WarriorTrader Note: Point & Figure number bars, volume, bid/ask delta, bid/ask delta with 100 lot filter, two volume by price studies |
View Image | View Image with the note
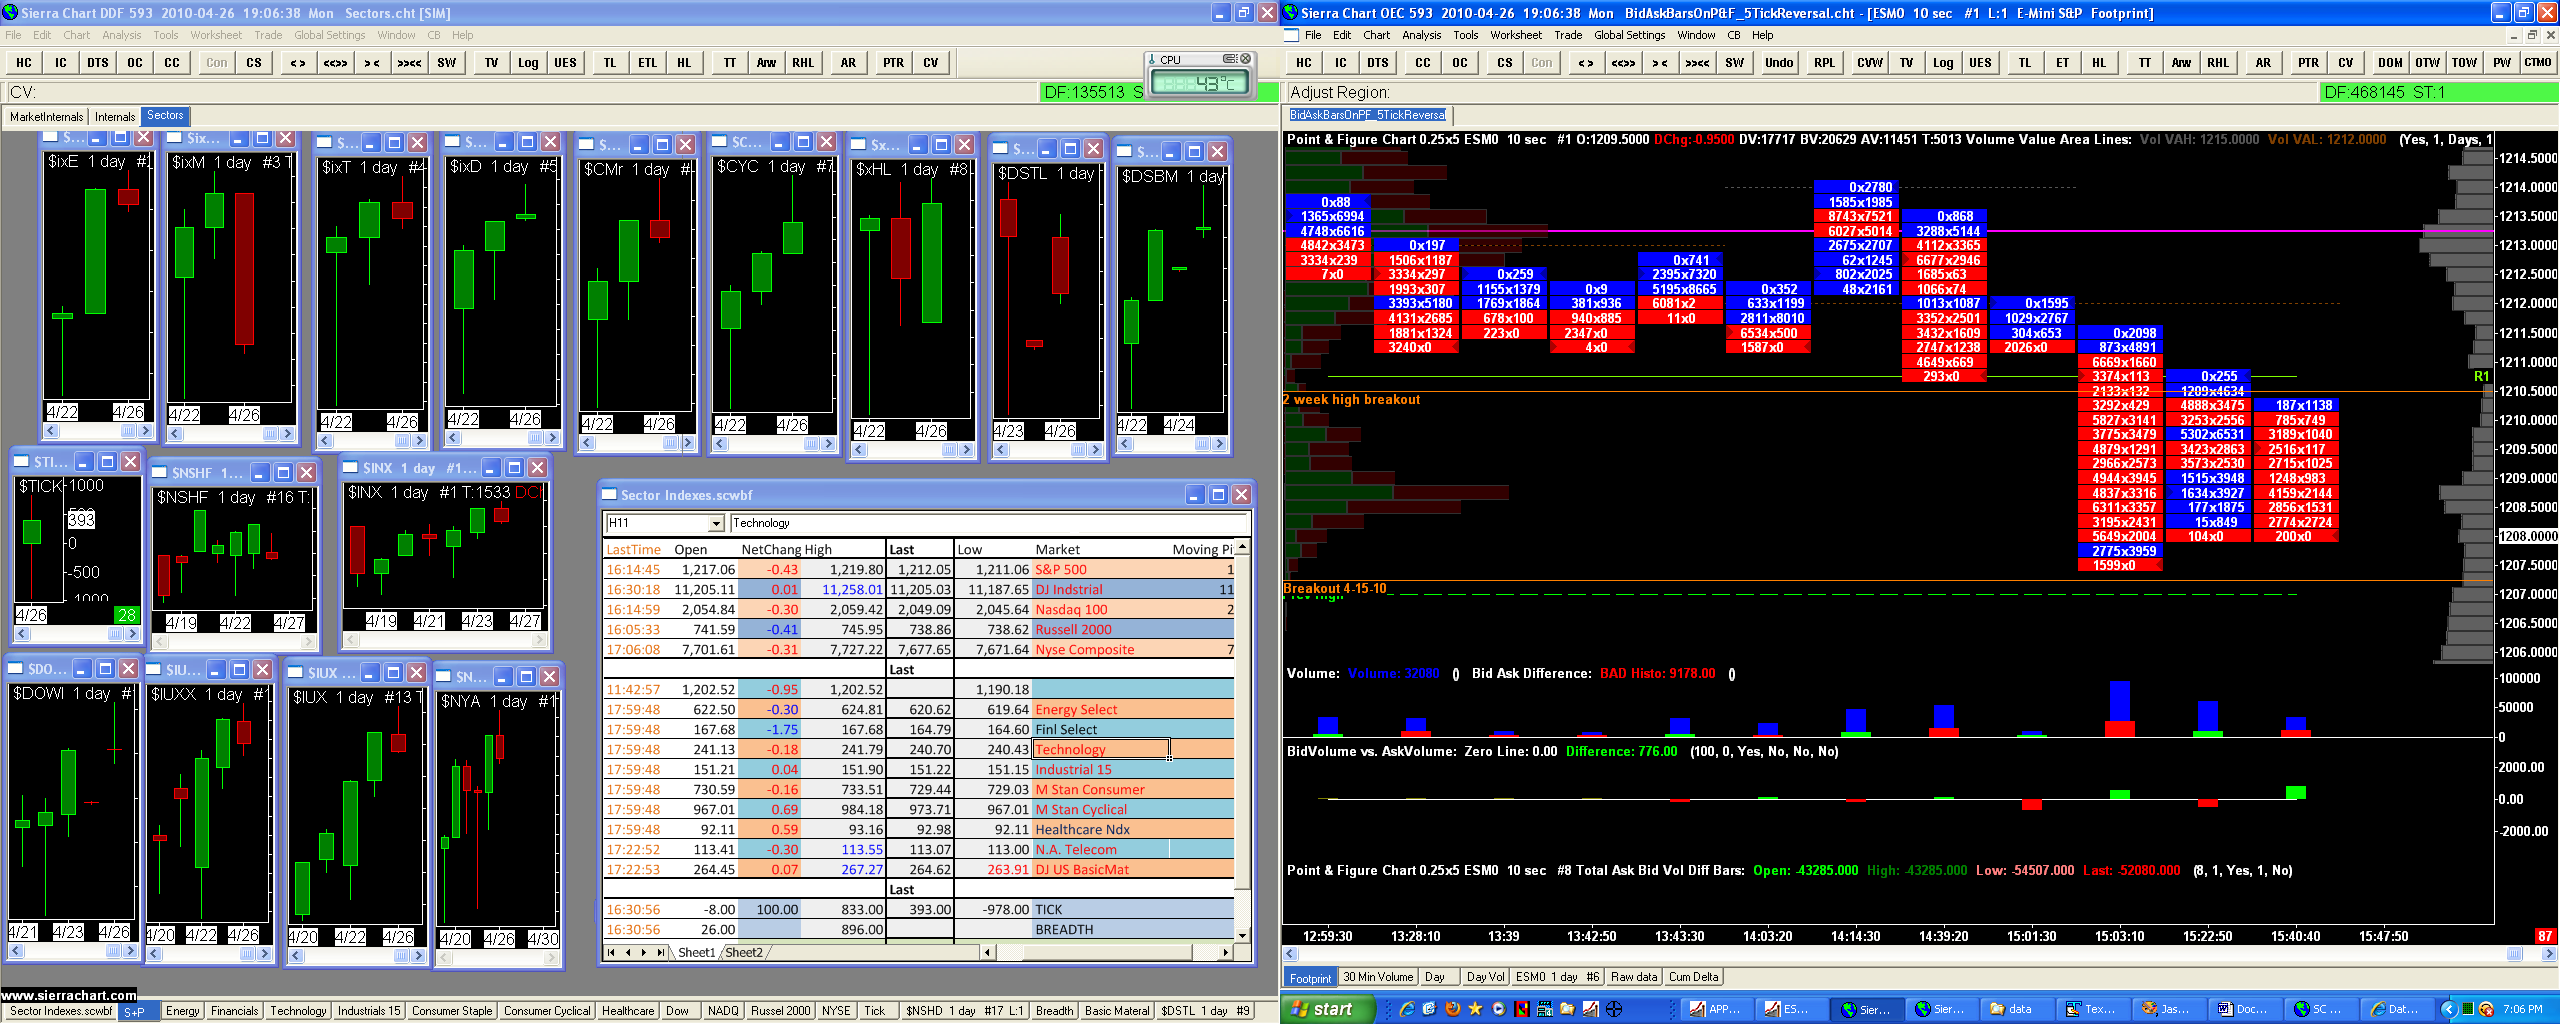
Image Uploaded on 2010-04-26 using SC version 593 by WarriorTrader Note: Day candle sticks of stock sectors. |
View Image | View Image with the note
Image Uploaded on 2010-02-02 using SC version 568 |
View Image | View Image with the note
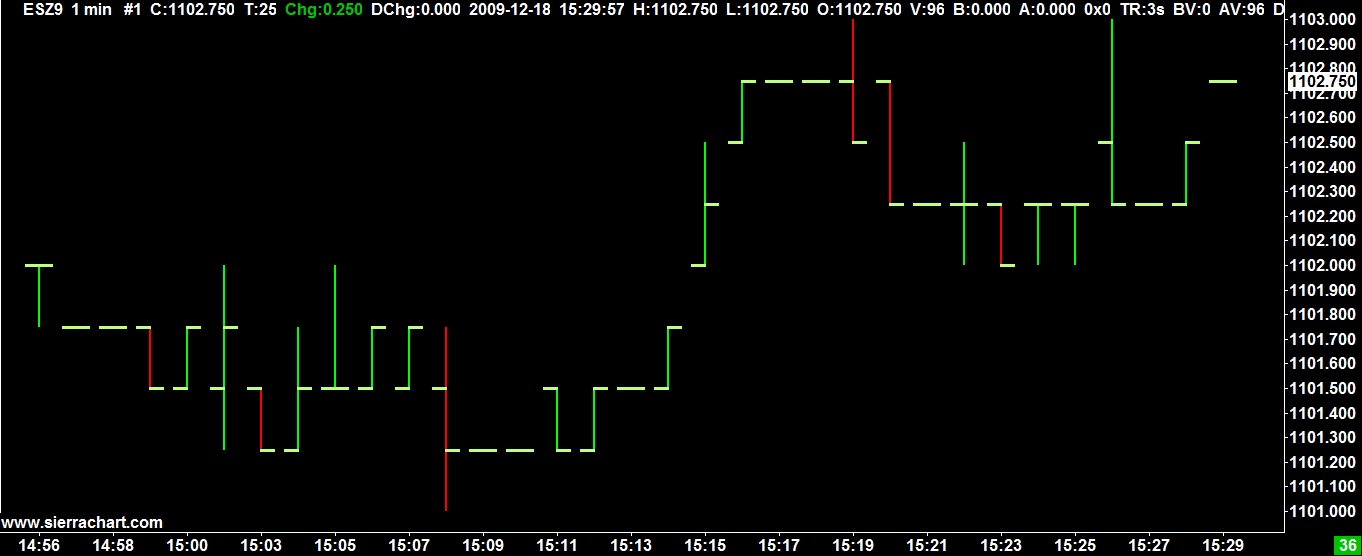
Image Uploaded on 2009-12-27 using SC version 551 |
*Last modified Wednesday, 22nd February, 2023.