Sierra Chart - Image Gallery
This is the public chart image gallery. To share a chart image, select Edit >> Screen Images >> Upload Chart on the Sierra Chart menu to upload a chart. Select Help >> Account Management. Click on Manage Images. Locate the chart image among the images you have uploaded. Add a note to it if you wish. And click on Share Image in the Public Image Gallery. That's it!
Available Pages
View Image | View Image with the note
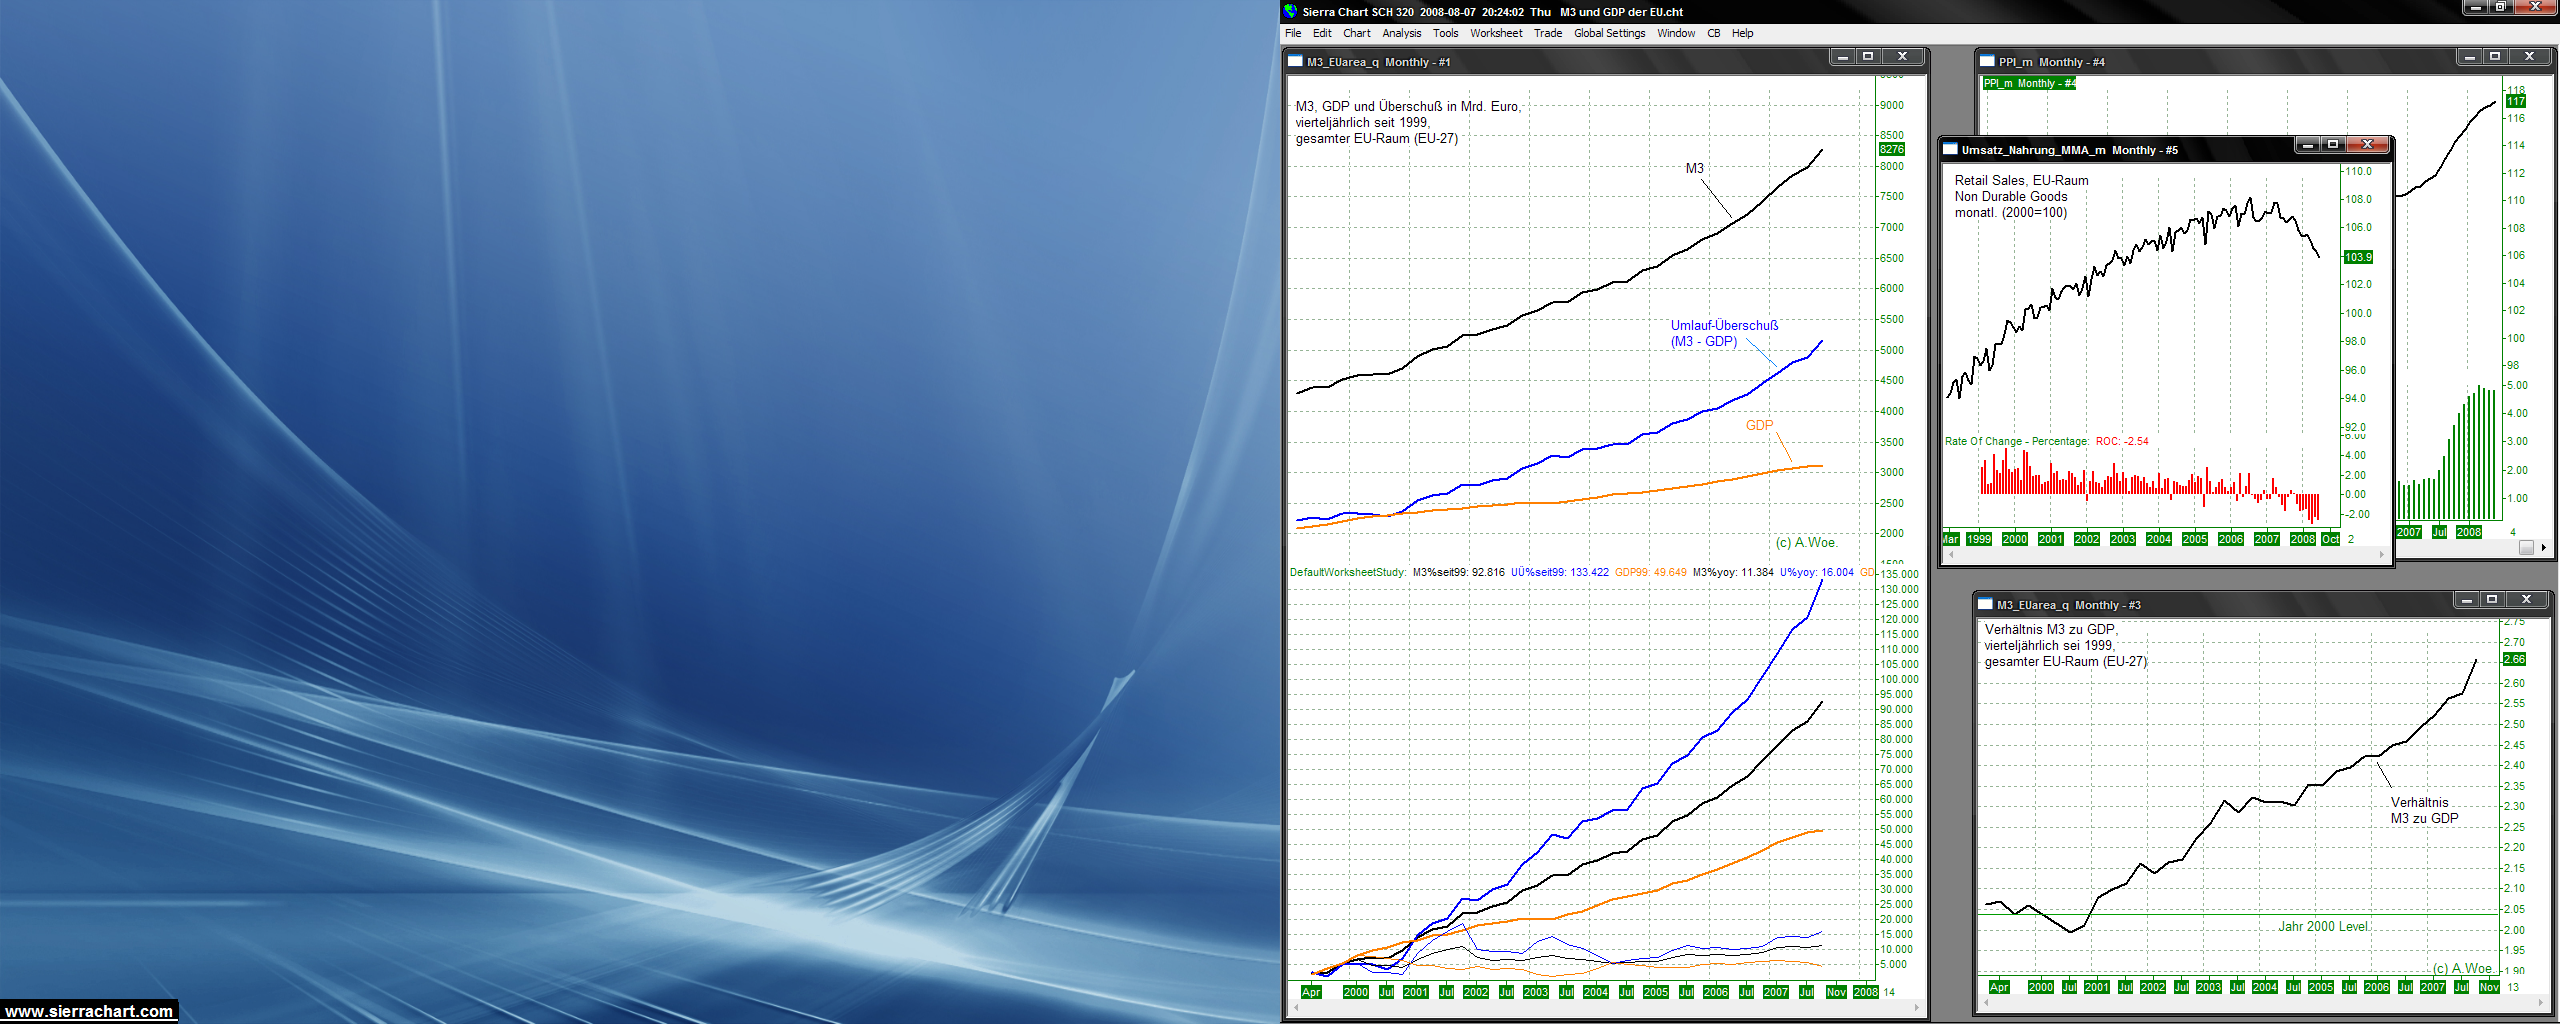
Image Uploaded on 2008-08-07 using SC version 320 by fxwolf |
View Image | View Image with the note
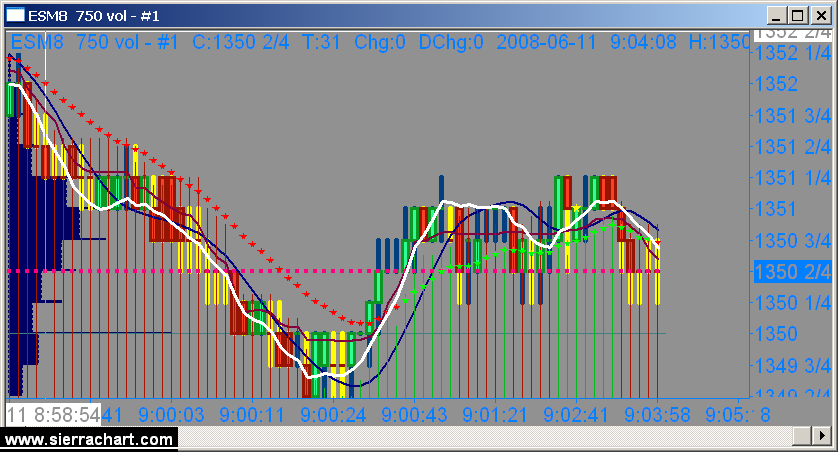
Image Uploaded on 2008-06-11 using SC version 293 |
View Image | View Image with the note
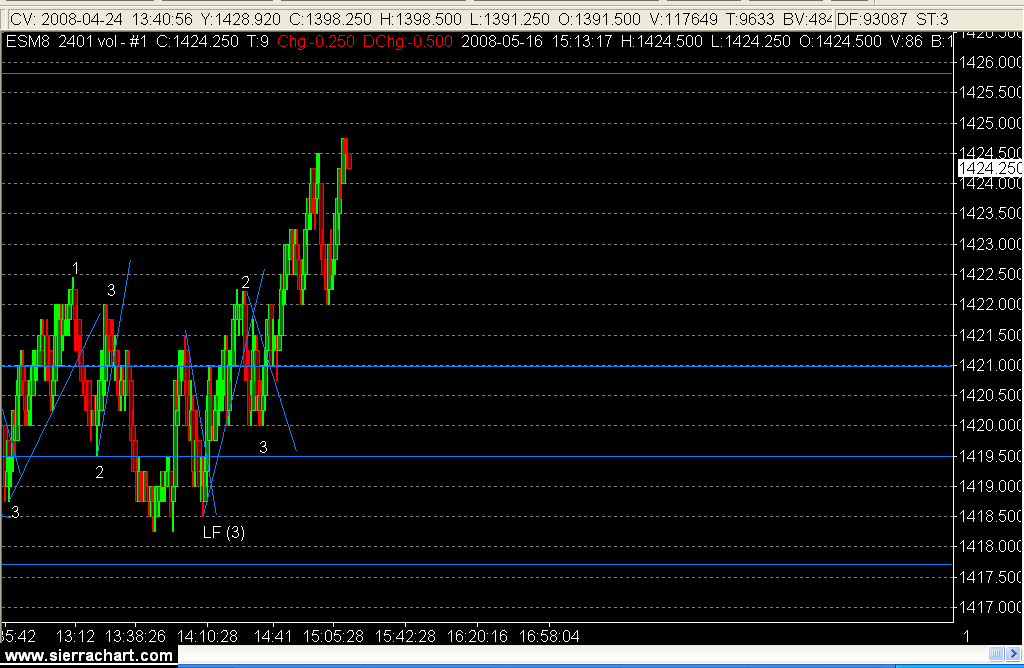
Image Uploaded on 2008-05-16 using SC version 272 |
View Image | View Image with the note
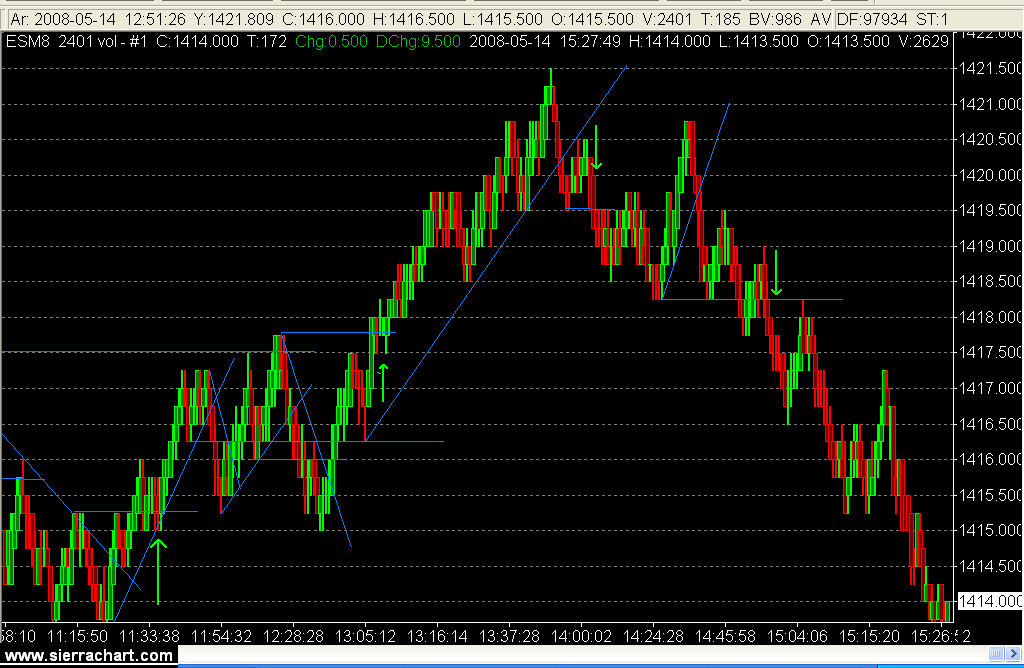
Image Uploaded on 2008-05-14 using SC version 272 |
View Image | View Image with the note
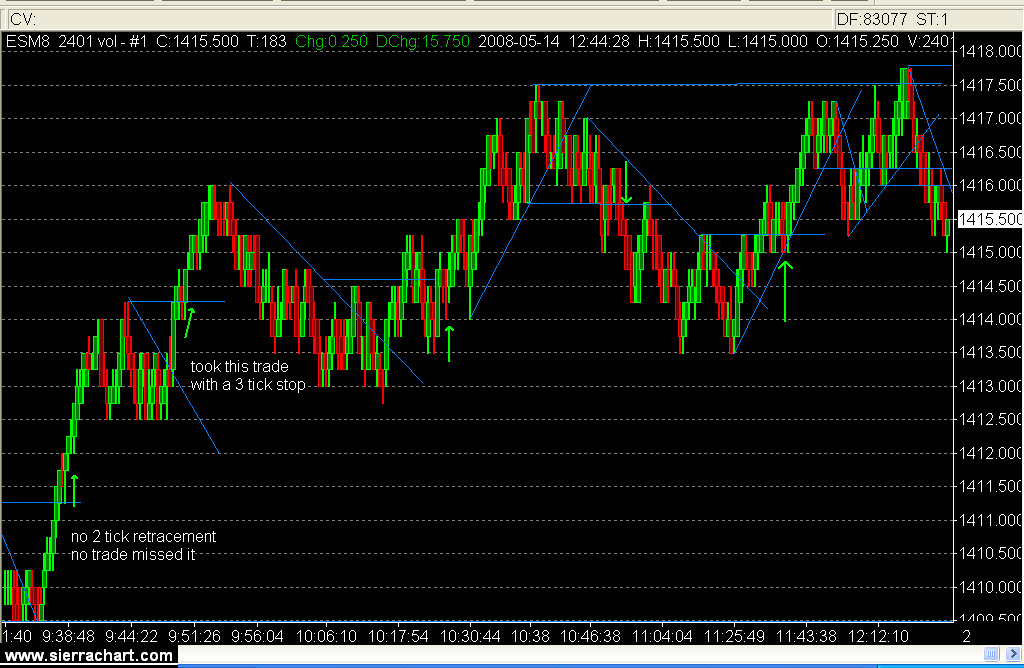
Image Uploaded on 2008-05-14 using SC version 272 |
View Image | View Image with the note
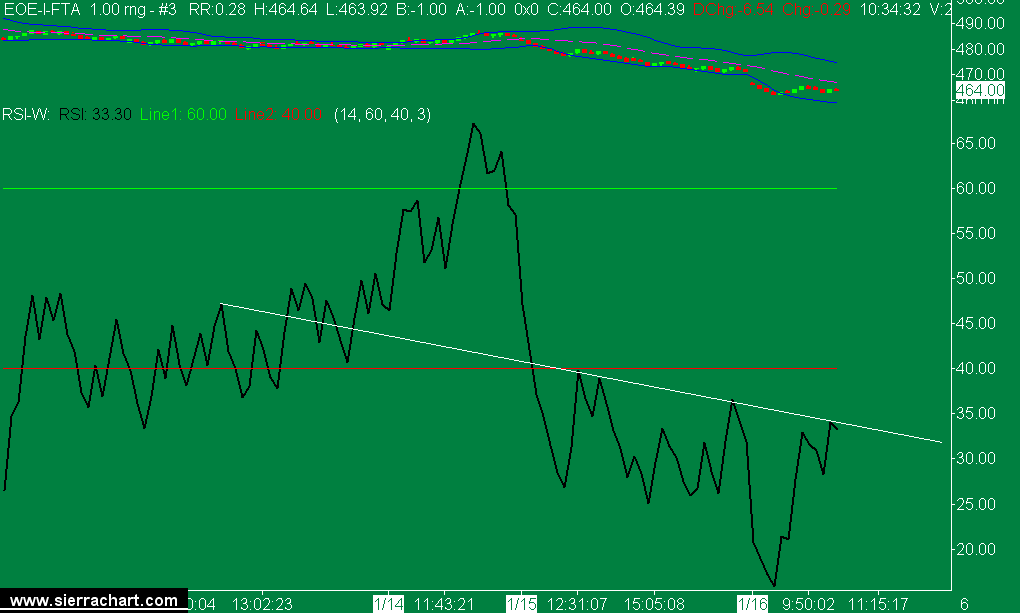
Image Uploaded on 2008-01-16 by Obiwan |
*Last modified Wednesday, 22nd February, 2023.