Sierra Chart Market Statistics
- Introduction
- Using Market Statistics Data Feed
- Symbols
- Calculations and Algorithms
- Forex Indexes Calculation
- Market Statistics Historical Daily Charts
- Overlaying a Chart on Another Chart as a Study
- Creating Additional Market Statistics
- Obtaining Data Further Back in Time for Some Market Statistics Symbols
- Market Statistics Calculations Compared to Other Data Services
- Mathematically Calculating Up Issues and Down Issues in TICK Statistic
Introduction
With Sierra Chart Service Packages, a complete real-time and historical market statistics data feed for the US stock market. The US Dollar index is also provided.
This real-time data feed works along with most of the Data and Trading services Sierra Chart supports. There is no need to select a different Data service to use this market statistics data feed.
All of the market statistics are calculated 24 hours a day if market data is available.
The update frequency is 250 milliseconds for all Sierra Chart market statistics assuming there is trading activity in the underlying symbols. Otherwise, there is no data transmitted. Within each 250 millisecond timeframe, the high and low extremes within that timeframe are also transmitted. Therefore, there can be more than 4 updates per second.
The market statistics data feed is a Sierra Chart calculated data feed using a NYSE and NASDAQ real-time stock data feed. The market statistics data feed is distributed from Sierra Chart servers.
The time unit of the historical Intraday data provided by the market statistics data feed is 1 second. This contains all of the updates within the single second.
Using Market Statistics Data Feed
All of the Sierra Chart market statistics data feed symbols are listed in File >> Find Symbol when using any of the supported Trading services.
If you want to use this data feed independently of the supported Trading services, then set Global Settings >> Data/Trade Service Settings >> Service to SC Data - All Services.
This service will provide access to all of the Market Statistics data feed symbols.
Select File >> Find Symbol >> Market Stats to see the market statistics symbols.
If you do not see Market Stats section listed, then you will need to Update the Symbol Settings.
In the Find Symbol window, the US Dollar index and other currency indexes are listed under the FX Indexes category in Find Symbol.
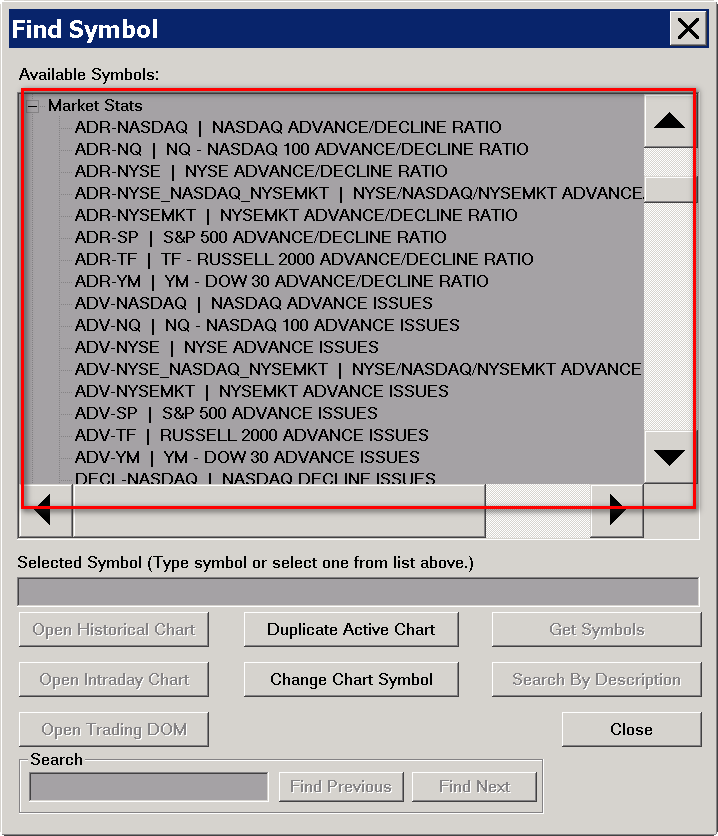
Select a market statistics symbol and press the Open Historical Chart or Open Intraday Chart button.
Symbols
An example of a market statistics symbol is TICK-NYSE. The general format is [statistics prefix]-[exchange/index].
All of the market statistics symbols can be looked up through File >> Find Symbol >> Market Stats.
The following table lists all of the market statistics symbol prefixes and their meaning. There is a separate symbol for each of these prefixes for each supported exchange or index.
| TICK | The number of stocks that traded at a higher price compared to their previous trade, minus the number of stocks that traded at a lower price compared to their previous trade. For example, if TICK reads +500, then there are 500 more stocks trading higher compared with stocks trading lower. The opposite is true if it is -500. TICK-NYSE is equivalent to the old $TICK symbol. |
| TRIN | This is the Trading Index. This calculation is the number of stocks that are up compared to the previous trading day close, divided by the number of stocks that are down compared to the previous trading day close. This ratio is then divided by the volume of stocks that are up compared to the previous trading day close, divided by the volume of stocks that are down compared to the previous trading day close. Formula: TRIN = (ADV / DECL) / (UVOL / DVOL). TRIN-NYSE is equivalent to the old $TRIN symbol. |
| ADV | The number of stocks that have traded during the current trading day and are up in price compared to their previous trading day close. Each stock only counts a value of one towards the statistic. |
| DECL | The number of stocks that have traded during the current trading day and are down in price compared to their previous trading day close. Each stock only counts a value of one towards the statistic. |
| UNCH | The number of stocks that have traded during the current trading day and are unchanged in price compared to their previous trading day close. Each stock only counts a value of one towards the statistic. |
| ADR | The advance decline ratio (ADV / DECL). |
| TISS | The number of stocks that have traded during the current trading day. Each stock only counts a value of one towards this statistic. |
| NISS | The difference between ADV and DECL. This is the symbol to use to get the Advance-Decline line. However, to get the true Advance-Decline line, you need to add the Advance Decline Line study to a chart of this symbol. Refer to Adding/Modifying Chart Studies for instructions. |
| ISS | The number of stocks that have traded in the second for which this is reported for. Each stock only counts a value of one towards this statistic. |
| UVOL | The total volume of the stocks for the particular exchange or index the symbol is for that have traded in the current trading day and are up in price compared to their previous trading day close.
2015-11-27: At the 9:30:00 US Eastern time open of the NYSE and NASDAQ, this volume calculation is reset back to 0. 2017-05-31: This symbol is only calculated during the day trading session. Reported in thousands. |
| DVOL | The total volume of the stocks for the particular exchange or index the symbol is for that have traded in the current trading day and are down in price compared to their previous trading day close.
2015-11-27: At the 9:30:00 US Eastern time open of the NYSE and NASDAQ, this volume calculation is reset back to 0. 2017-05-31: This symbol is only calculated during the day trading session. Reported in thousands. |
| TVOL | The total volume of stocks for the particular exchange or index the symbol is for that have traded in the current trading day . 2015-11-27: At the 9:30:00 US Eastern time open of the NYSE and NASDAQ, this volume calculation is reset back to 0. 2017-05-31: This symbol is only calculated during the day trading session. Reported in thousands. |
| NVOL | NVOL is the difference between UVOL and DVOL. |
| UVOL24H | The total volume of the stocks for the particular exchange or index the symbol is for that have traded in the current trading day and are up in price compared to their previous trading day close.
This symbol is calculated during the entire 24 hour period which includes the premarket and post market trading. Reported in thousands. |
| DVOL24H | The total volume of the stocks for the particular exchange or index the symbol is for that have traded in the current trading day and are down in price compared to their previous trading day close.
This symbol is calculated during the entire 24 hour period which includes the premarket and post market trading. Reported in thousands. |
| TVOL24H | The total volume of stocks for the particular exchange or index the symbol is for that have traded in the current trading day.
This symbol is calculated during the entire 24 hour period which includes the premarket and post market trading. Reported in thousands. |
| NVOL24H | NVOL24H is the difference between UVOL24H and DVOL24H. |
| UTCK | The number of trades of the stocks that have traded in the current trading day and are up in price compared to their previous trading day close. Quoted in 1000s. |
| DTCK | The number of trades of the stocks that have traded in the current trading day and are down in price compared to their previous trading day close. Quoted in 1000s. |
| TTCK | The total number of trades of stocks that have traded in the current trading day for the particular exchange or index the symbol is for. Quoted in 1000s. |
| NTCK | NTCK is the difference between UTCK and DTCK. Quoted in 1000s. |
| DTIS | The number of stocks that traded at a lower price compared to the previous price or compared to the prior close at the first trade of the day. This is used in the TICK calculation. |
| UTIS | The number of stocks that traded at a higher price compared to the previous price or compared to the prior close at the first trade of the day. This is used in the TICK calculation. |
| PVOL | The total volume for a one second period for the stocks that have traded during that second. The actual volume that you will see for a chart bar will be equal to the volume over the timeframe of the chart bar. So when using the Volume study on a 10 minute per bar chart, the Volume will be for that 10 minutes when using this symbol. The chart bars themselves represent the Open, High, Low, and Close of all of the 1 second total volume intervals regardless of the time length of the bar. For example, the high of a bar would be the maximum volume encountered during a one second period, during the timeframe of the chart bar. |
| UDVR | This is the ratio of UVOL24H to DVOL24H (UVOL24H / DVOL24H) |
The following table lists all of the exchanges and indexes that market statistics are available for and provides descriptions for them.
| NASDAQ | Based on the stocks traded on the NASDAQ exchange. |
| NQ | Based on the stocks traded in the NASDAQ 100 index. |
| NYSE | Based on the stocks traded on the New York Stock Exchange. |
| SP | Based on the stocks traded in the S&P 500 index. |
| YM | Based on the stocks traded in the Dow Jones 30 Industrials index. |
| TF | Based on the stocks traded in the Russell 2000 index. |
| NYSEMKT | Based on the stocks traded in the NYSE Market exchange. Formally AMEX. |
| NYSE_NASDAQ_NYSEMKT | Based on the stocks traded in the NYSE, NASDAQ and NYSE Market (AMEX) exchanges. |
The following table lists all of the foreign exchange indexes (FX Indexes).
| USDX | US Dollar Index - calculated using the standard ICE algorithm. |
| EUR-X | Euro FX Index |
| GBP-X | British Pound FX Index |
| AUD-X | Australian Dollar FX Index |
| NZD-X | New Zealand Dollar FX Index |
| CAD-X | Canadian Dollar FX Index |
| CHF-X | Swiss Franc FX Index |
| JPY-X | Japanese Yen FX Index |
| USD-X | US Dollar FX Index |
The Open, High, Low, Close Historical Daily chart values for the FX Index symbols are based upon the time range from 00:00:00 to 23:59:59 UTC time.
There is no data earlier than 2014-03 for these symbols.
Calculations and Algorithms
This section contains additional information about the calculations and algorithms used for market statistics.
- The data for all market statistics symbols are calculated and provided using Sierra Chart software and systems using a full tick by tick data feed of the NASDAQ and NYSE exchanges. This includes stocks and ETFs. Although many ETFs trade on NYSE Market and not on the NYSE. Basically all reported and tradable symbols/issues. This documentation makes reference to "stocks" which can include ETFs.
- All stock based statistics are based on the trading day, which includes the pre and post market trading sessions unless otherwise noted. The statistics are reset at midnight US Eastern time. This is after the post market session and before the pre market session. They run continuously through the entire trading day.
- The market statistics symbols for US exchanges and indexes will definitely be active from 09:30 to 16:00 US Eastern time on weekdays. There is also activity during the pre-and post market hours.
- To calculate the stock based statistics, all trades and volume updates are examined for the NYSE and NASDAQ exchanges. Each trade is used to determine the status of the stock, which is then applied to the proper statistic based on which exchange or index the stock is a member of.
- A particular stock is not included any the market statistics calculations until it has traded for the current day.
- All stocks start in a neutral state and initially are not included any of the market statistics calculations. When there is the first trade of the day for a particular stock, it is compared against the prior days settlement price. If it is unchanged, then it would still not contribute to market statistics that require an up or down consideration of a particular stock. Otherwise, for volume and number of trades market statistics, the stock will be counted as soon as it trades for the day.
- There is not a sampling of the stock exchange data. There is an update of market statistics at every single trade that is received from the full tick by tick feed for the exchanges being monitored. If there has been no change in direction (up, down, unchanged) for the last trade for a particular symbol, then the prior direction is used for that symbol in the market statistics where applicable.
- Volumes and Number of Trades are shown in thousands of shares / trades.
- The TICK- symbols are the total number of stocks trading at a higher price than their prior trade (up tick) minus the total number of stocks trading at a lower price than their prior trade (down tick). If a stock has not traded yet, it is not included in the count.
An up tick is a trade that trades at higher price than the prior trade. A down tick is a trade that trades at a lower price than the prior trade.
When a trade executes at the same price, the prior tick direction is maintained.
For the first trade of the day for a stock, the price is compared against the prior closing price for that particular stock.
In the case where a stock changes direction from an up tick to a down tick or the other direction, this causes a change of 2 in the TICK- symbol. For example, if a stock goes from an up tick to a down tick, the TICK- will change by -2.
The TICK- symbols are updated at every single trade for the particular stocks being monitored and they are transmitted up to four times a second. The extreme values during each quarter second are also maintained and transmitted.
The TICK- calculations are reset at midnight US Eastern time and effectively start at the pre-open.
To know the number of stocks involved in the calculation for a particular TICK- symbol at any moment in time, refer to a chart for TISS-[exchange or index] for the same exchange or index. - As a stock trades, each trade is compared to the previous trade for that stock. The result is an up tick, down tick, or no change. In the case of the TICK- market statistics, they are then updated based on the prior tick state and the current tick state. For example, if a stock changes from down tick to up tick, both the down ticking total and the up ticking total need to be updated resulting in the net ticks moving +2. In the case of trading at the same price, the tick direction is maintained in the same state, and so there is no change to the tick counts used for the final TICK output.
- The TRIN is the standard calulation: TRIN = (ADV / DECL) / (UVOL / DVOL). Refer to the Symbols section for a description of ADV, DECL, UVOL, DVOL.
- Market Statistics Bid Volume: All market statistics maintain Bid Volume for Intraday data. Every 1 unit of Bid Volume indicates that the market statistic had a lower value than the previous value or had the same value as the previous value and the value previous to that was considered a lower value. When market statistics data is stored tick by tick, Bid Volume or Ask Volume will be 1 for the Intraday Tick data record. When looking at the Bid Volume in a chart, a value of 107 for a 1 minute Intraday bar indicates that the market statistic had 107 lower values for that bar.
- Market Statistics Ask Volume: All market statistics maintain Ask Volume for Intraday data. Every 1 unit of Ask Volume indicates that the market statistic had a higher value than the previous value or had the same value as the previous value and the value previous to that was considered a higher value. When market statistics data is stored tick by tick, Bid Volume or Ask Volume will be 1 for the Intraday Tick data record. When looking at the Ask Volume in a chart, a value of 107 for a 1 minute Intraday bar indicates that the market statistic had 107 lower values for that bar.
- Market Statistics Total Volume: All market statistics maintain Total Volume for Intraday data. This represents the number of price updates for a particular market statistics symbol.
- The Market Statistics UVOL24H, DVOL24H, TVOL24H, UVOL, DVOL, TVOL symbols, consider the all of the trading activity from all of the symbols included in a particular exchange or index, that are intended to update the Daily Volume value. These are reported in thousands. These values can be very high. You can see the real trading volumes on the NYSE US Equity Volumes page.
Forex Indexes Calculation
This section documents the formula used for the Forex Indexes EUR-X, GBP-X, AUD-X, NZD-X, CAD-X, CHF-X, JPY-X, USD-X.
FOREX quotes for commonly traded currency pairs are widely reported. For instance, a quote of EUR.CHF = 1.4929 indicates that 1 Euro is exchanged for 1.4929 Swiss francs. The first currency in the quote symbol is called the base currency, and the second is called the quote currency.
We wish to have an index for each currency that makes no explicit reference to other commonly traded currencies, but is instead averaged over them. In order to write down compact mathematical expressions for these indices, it will be inconvenient to use the FOREX currency abbreviations. Therefore, we will use the following instead.
- C1 = EUR
- C2 = GBP
- C3 = AUD
- C4 = NZD
- C5 = USD
- C6 = CAD
- C7 = CHF
- C8 = JPY
In this nomenclature, C1.C7=EUR.CHF. Note that reversing the order of the currencies in this expression yields the reciprocal of the previous quote. For example, C7.C1=1/C1.C7.
In the expressions for the indices, we will also want to cite a reference value of the quote. This will be the value of the quote on 2008-12-31, and it will be denoted by C1.C7(Ref). Refer to the table below for these values.
We are now ready to write down an expression for the indices of the currencies. For currency Cj, its index will be denoted Cj-X. So for example, C1-X or EUR-X is the index for Euros.
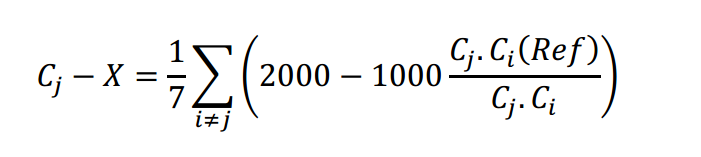
Both the quote Cj.Ci and the index Cj-X are calculated about once per second. We are summing over all i not equal to j to avoid including terms in which a currency is compared with itself. We divide by 7 because we are averaging the expression in the summand for currency j over the other seven currencies.
Values at 2008-12-31:
- EURJPY = 126.68
- EURCHF = 1.4929
- EURCAD = 1.6992
- EURUSD = 1.3939
- EURNZD = 2.3872
- EURAUD = 1.9744
- EURGBP = 0.9584
- GBPJPY = 132.16
- GBPCHF = 1.5579
- GBPCAD = 1.7726
- GBPUSD = 1.4543
- GBPNZD = 2.4905
- GBPAUD = 2.0594
- AUDJPY = 64.16
- AUDCHF = 0.7565
- AUDCAD = 0.8606
- AUDUSD = 0.7061
- AUDNZD = 1.2090
- NZDJPY = 53.06
- NZDCHF = 0.6256
- NZDCAD = 0.7117
- NZDUSD = 0.5838
- USDJPY = 90.88
- USDCHF = 1.0713
- USDCAD = 1.2188
- CADJPY = 74.55
- CADCHF = 0.8789
- CHFJPY = 84.82
Market Statistics Historical Daily Charts
Normally the type of charts you should use with Sierra Chart Market Statistics are Intraday charts since the historical data for these market statistics is stored in an Intraday format.
Historical Daily data is generated from the Intraday data. So when you open a Historical Daily data chart, the chart data is built from the Intraday data on the server. These charts only are built from the Intraday data for the time span from 09:30:00 US Eastern time until 16:00:00 US Eastern time.
So there can be differences to the Intraday chart data because of this.
Overlaying a Chart on Another Chart as a Study
To include a market statistic symbol in the study region of another chart, then this can be done by using the Add Additional Symbol study.
For example, you you can include the TICK-NYSE symbol below another chart.
Follow the information on the Add Additional Symbol study to do this.
For general information to work with studies, refer to the Adding Studies section.
On the Settings and Inputs tab of the Study Settings window for the Overlay study, set the Chart Region setting to 2 or whatever region you would like to display the market statistics chart in, on the destination chart.
Creating Additional Market Statistics
It is possible to use the existing Market Statistics and combine them to create a new statistic that may be of interest.
The following instructions give an example of using the NASDAQ Advancers (ADV-NASDAQ) along with the NASDAQ Decliners (DECL-NASDAQ) to generate the ratio of Advancers/(Advancers + Decliners).
- Find the symbol ADV-NASDAQ and open this symbol into a new Intraday Chart.
- Go to Analysis >> Studies and add the Add Additional Symbol study to the Studies to Graph. For more information refer to the Adding/Modifying Chart Studies.
- Select Add Additional Symbol in the Studies to Graph area, and select the Settings button to open the Settings window for this study.
- Select the Symbol Input setting and either Find the Symbol or enter the symbol DECL-NASDAQ. Change other settings as desired, and then select OK to close the Settings window for the Add Additional Symbol study.
- Add the Study Subgraphs Add study to the Studies to Graph, select the study in the Studies to Graph area of the window and then select the Settings button to bring up the Settings window for that study.
- Set Input Study 1 to Main Price Graph and Last and set Input Study 2 to Symbol: DECL-NASDAQ and Last. Set the other Inputs as desired. Select OK to close the Settings window for this study and have the study added to the chart.
- Add the Study Subgraphs Divide/Ratio study to the Studies to Graph, select the study in the Studies to Graph area of the window and then select the Settings button to bring up the Settings window for that study.
- Set Input Study 1 to Main Price Graph and Last and set Input Study 2 to Study Subgraphs Add and Add. Set the other Inputs as desired. Select OK to close the Settings window for this study and have the study added to the chart. This study displays the new Market Statistic for Advancers/(Advancers + Decliners) for the NASDAQ.
- Select OK on the Chart Studies window.
If desired, the Add Additional Symbol and the Study Subgraphs Add studies can be set to Hide to not have them displayed.
Obtaining Data Further Back in Time for Some Market Statistics Symbols
The Symbols documented on this page have data which go back to approximately the beginning of 2014 except for the following which have more history:
From 2009-08-28 for NISS-NYSE. From 2008-08-07 for TICK-NYSE.
To access all of the available historical data for any of the market statistics symbols, follow the Downloading / Viewing More Historical Intraday Data.
Market Statistics symbols are also provided with the Sierra Chart Historical Data Service which uses data from the Barchart Data service. These are completely separate market statistics symbols.
Follow the instructions on the Sierra Chart Historical Data Service page to use that service.
You can open Historical Daily or Intraday charts for any of the Sierra Chart Historical Data Service Market Statistics symbols using that service.
The historical Intraday data is in 1 minute units with that service.
Market Statistics Calculations Compared to Other Data Services
Sometimes we receive comments that the Sierra Chart market statistics in particular the TICK-NYSE differs at times compared to TICK NYSE data provided by other market data services.
You will see that the Sierra Chart TICK market statistics have the same shapes/patterns as compared to other data services. The actual values do tend to vary slightly, especially at extremes, but that is the case if you compare any of the different vendor TICK values. What we have found is comparing to a known good data feed, which ours is as well, you will find that the Sierra Chart TICK market statistics have lower and higher extremes.
In this section here, we will explain that the market statistics results provided by the Sierra Chart data feed are very accurate and precise.
TICK Calculation is Not Weighted Based on Market Capitalization of Containing Stocks
Since the TICK calculation is not weighted, large-capitalization stocks will affect the TICK calculation to the same extent compared to smaller capitalization stocks.
We have seen some traders run a simple summation of the TICK-NYSE using an Intraday bar interval, and compare that to the S&P 500 cash index Daily chart to find a correlation. This is a flawed and unreliable method of analysis for several reasons. One reason is that in the case of the S&P 500 index, the S&P 500 is a weighted index of 500 large capitalization stocks on both the NYSE and NASDAQ. The TICK-NYSE is all of the stocks on the NYSE and there is no weighting.
The TICK market statistic is also a short-term market direction indicator. For example, if a stock is down for the day, it is still possible for that same stock throughout the day to have many upticks but still be down on the day compared to its previous closing price. There is not always a definitive and reliable correlation that can be made between the TICK market statistic and a weighted cash index. Often there will be a correlation but this is not always the case.
Another reason why this is an unreliable comparison is explained in the Explanation of TICK Positive or Negative Bias and How to Correct.
Sometimes we hear from users that the S&P 500 is way up/down, but the Sierra Chart TICK calculation, which is accurate, does not reflect this. Once again, this is a completely flawed method of analysis. The S&P 500 index can be up or down significantly in price, but this is due to the degree of price change of the stocks contained within it, the fact that it is a weighted index based on market capitalization, and it contains stocks from two different exchanges.
It is not possible to always make a direct correlation to the TICK-NYSE which does not use any weighting based upon market capitalization, and it includes all symbols on a single exchange. If you believe this correlation is valid, then instead look at the TICK-SP, which tracks the number of stocks that have traded at a higher price compared to their prior price minus the number of stocks trading at a lower price compared to their prior price, in the S&P 500. What you will find is that the reading given at the time you see the S&P 500 significantly up or down, is not an extreme reading and will appear to be inconsistent with the movement of the S&P 500 cash index. This definitively shows that making this kind of correlation is inherently flawed.
In summary, the TICK is a short-term calculation indicating the number of stocks that have traded at a higher price compared to their prior price minus the number of stocks trading at a lower price compared to their prior price. Whereas a weighted cash market index like the S&P 500, is indicating for a group of large capitalization stocks their last trade prices compared to their final trade prices the day before, using a weighted formula based upon market capitalization.
There is not always a direct correlation between the two.
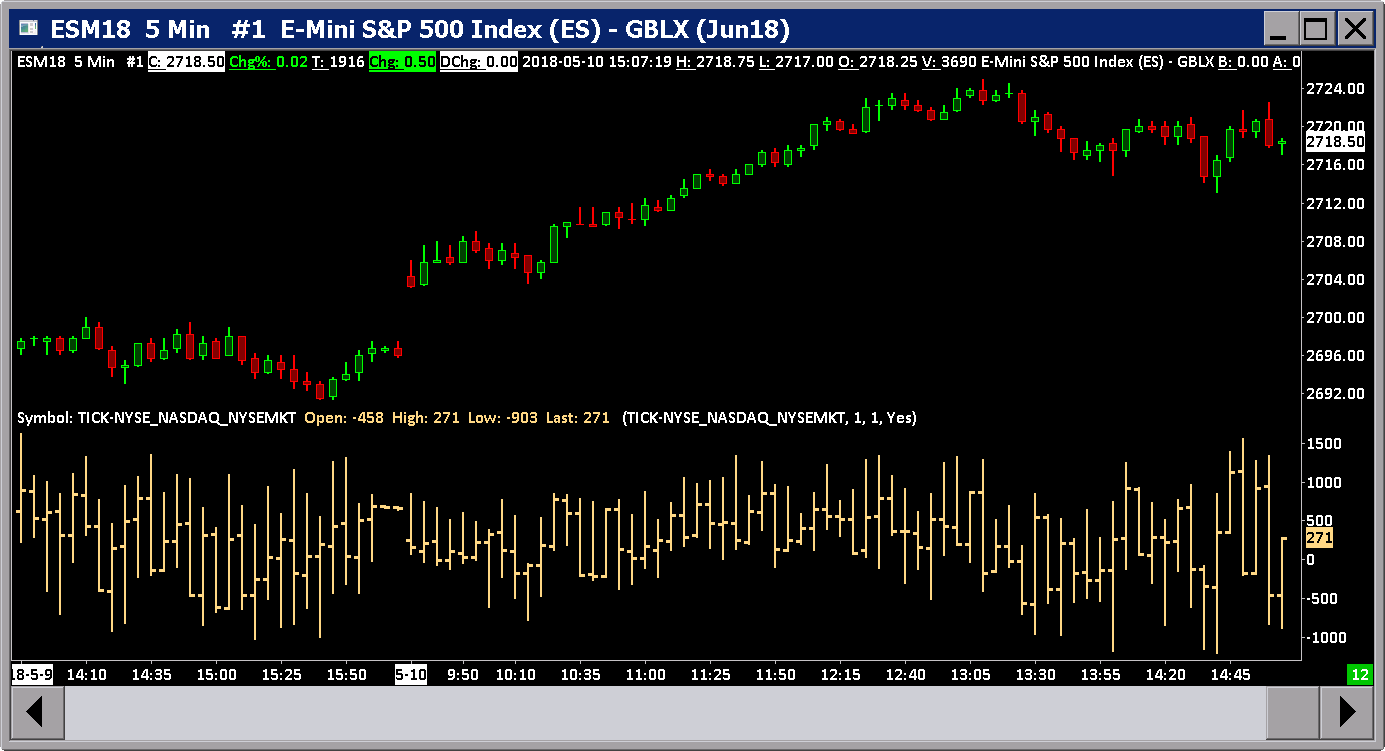
TICK for S&P 500 Stocks Matches DTN IQ Feed
When calculating the TICK market statistic for the S&P 500 stocks using the DTN IQ Feed data feed and comparing that to the DTN IQ Feed calculated TICK, we see that there is a very close match as the below image shows.
You will notice that in the first chart at the top of this image, the timestamps differ from the other two charts below because the top chart is using delayed data. The timestamps differ by 15 minutes but that is beside the point with the comparison being made.
Interestingly you will see that the Sierra Chart calculated TICK from IQ Feed data has higher extremes which indicates more accurate reporting of these extremes. This tends to indicate that IQ Feed is using a sampling method whereas the Sierra Chart market statistics calculation involves every single trade from the S&P 500 stocks.
We also see a very close match to the Sierra Chart calculated TICK market statistic for the S&P 500 stocks using the Barchart data feed compared to the IQ Feed calculated TICK for the S&P 500.
Aside from the differences with the extremes, the small occasional variations in appearance most likely are due to time stamping differences with the final TICK output.
Therefore, the Sierra Chart TICK market statistic calculation has proven to be accurate and follows a standard calculation model. The TICK market statistics calculation method is very simple and there never has been a problem with it other than some rare instances of a problem with the underlying data feed.
Therefore, differences with the TICK-NYSE must be primarily due to small differences or variation in the particular stocks being tracked on the NYSE and to some extent time stamping differences. Sierra Chart uses a reliable list of symbols which lists the stocks on the NYSE to do the calculation. The source data comes from Barchart. As of this writing, approximately 3200 stocks are used in the calculation each day and this also matches the number of stocks that DTN IQ Feed shows are traded on the NYSE every day.
Explanation of TICK Positive or Negative Bias and How to Correct
This is an image of the S&P 500 cash index Daily chart with 3 overlay studies below it.
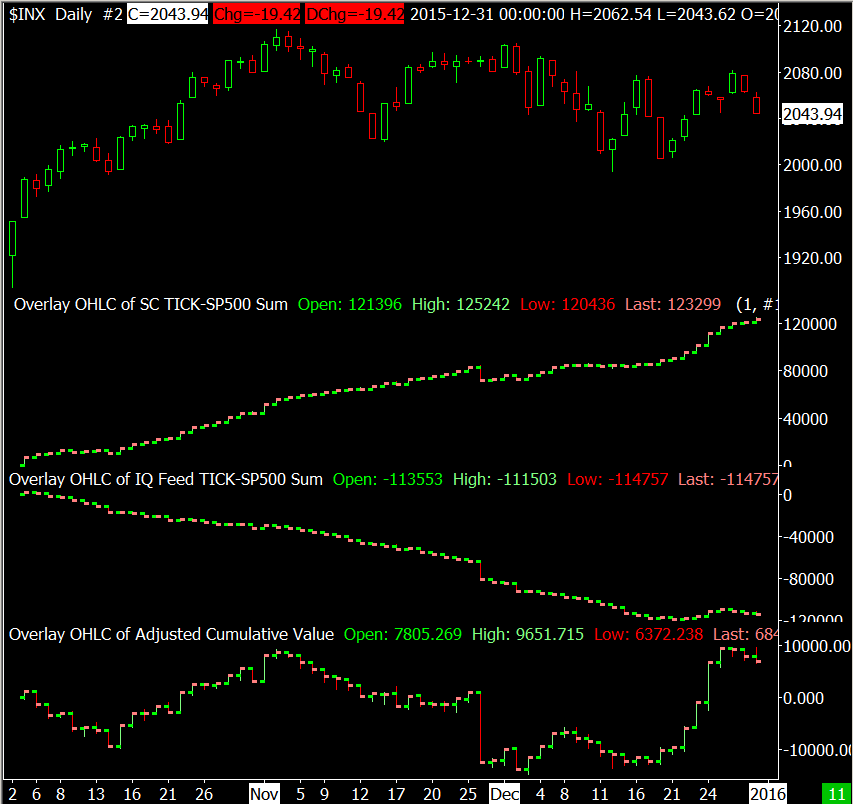
The first overlay is a cumulative summation of the average price of each 1 Minute chart bar of the TICK market statistic for the S&P 500 stocks calculated by Sierra Chart. This is overlaid as OHLC bars on to the S&P 500 cash index Daily chart. Notice how it slopes up.
The second overlay is a cumulative summation of the average price of each chart bar of the DTN IQ Feed calculated TICK market statistic for the S&P 500 stocks. This is overlaid as OHLC bars on to the S&P 500 cash index Daily chart. Notice how it slopes down. It goes in a completely opposite direction.
The third overlay at the bottom is the Cumulative Adjusted Value study on the chart of the TICK market statistic for the S&P 500 stocks calculated by Sierra Chart (symbol TICK-SP). This is overlaid as OHLC bars. You can now see some correlation at times to the underlying S&P 500 cash index.
As explained in the TICK for S&P 500 Stocks Matches DTN IQ Feed section we can see that there is a very close match between the Sierra Chart calculated TICK market statistic for the S&P 500 stocks compared to the IQ Feed TICK for the S&P 500.
We also want to point out, that the Barchart Data Service $TICK symbol data also has a positive bias when performing a cumulative summation of it over an extended period of time.
So why therefore is there a 100% difference of slope between the Sierra Chart calculated TICK and the DTN calculated TICK for the S&P 500 stocks?
Once again, the TICK is not a weighted calculation. Small-cap stocks will have just as much of an effect on the calculation as large-cap stocks. Although this is not relevant to the discrepancy and neither the nearly continuous positive or negative slope makes sense.
All of the reasons why one TICK is sloping up and the other is sloping down, are not exactly known. However, in the case of the IQ Feed calculated TICK for the S&P 500, at times where the market is closed the TICK value repeats itself and if it is a negative number (which it is in our test case), that then causes a downward slope of the cumulative summation calculation over that period of time. This is one of the reasons which has been observed.
However, one thing that can conclusively be said, is that this method of analyzing the TICK market statistic by running a simple summation of the values is inherently flawed and produces completely unreliable results and should never be relied upon.
What is the solution to the problem that we see? Clearly there is a solution with the third overlay in the image above. In this Cumulative Line for the Adjusted NYSE TICK article, it discusses a calculation that can be used on the TICK market statistic symbol to obtain a relative reading from the TICK. The result of this is the third overlay at the bottom of the chart above and you can see that it is more closely correlated to the actual underlying S&P 500 cash index Daily chart.
Recent Analysis
Based upon a couple of recent user comments on the Sierra Chart TICK-NYSE calculation being less than accurate, we are going to once again review this for the date 2017-01-04.
We are going to explain here once again, after analysis that the TICK-NYSE market statistic is completely correct and reasonable.
There are going to be several points of analysis.
Also we want to point out that it is incorrect to compare the degree of movement in the S&P 500 cash index and try to correlate that to the TICK-NYSE. For complete details about this, refer to TICK Calculation is Not Weighted Based on Market Capitalization of Containing Stocks.
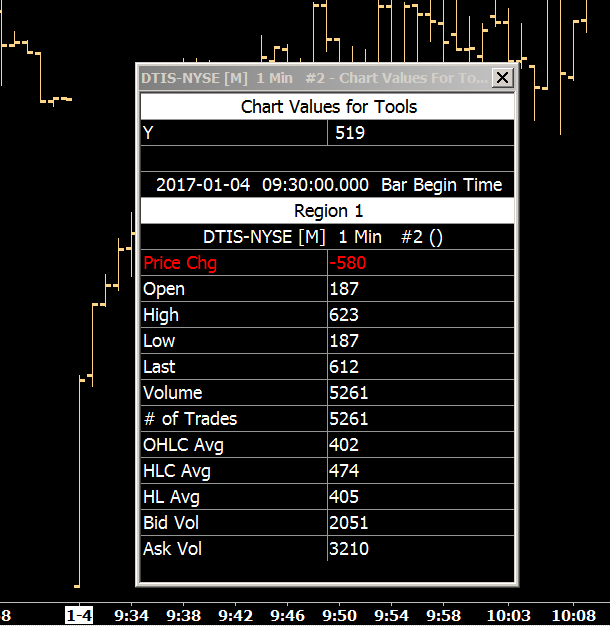
- We can see in the chart images below, that the number of issues/stocks the Sierra Chart stock data feed is reporting at the 9:30 AM open is 465. With IQ Feed it is 2283. This is an indication of the number of stocks that have been trading premarket. For an exchange that has about 3100 stocks on it, the 465 looks more reasonable than the 2283. We do not know the reason for the difference but once again we think with the Sierra Chart data feed which is provided by Barchart, that it is indicating a more reasonable value.
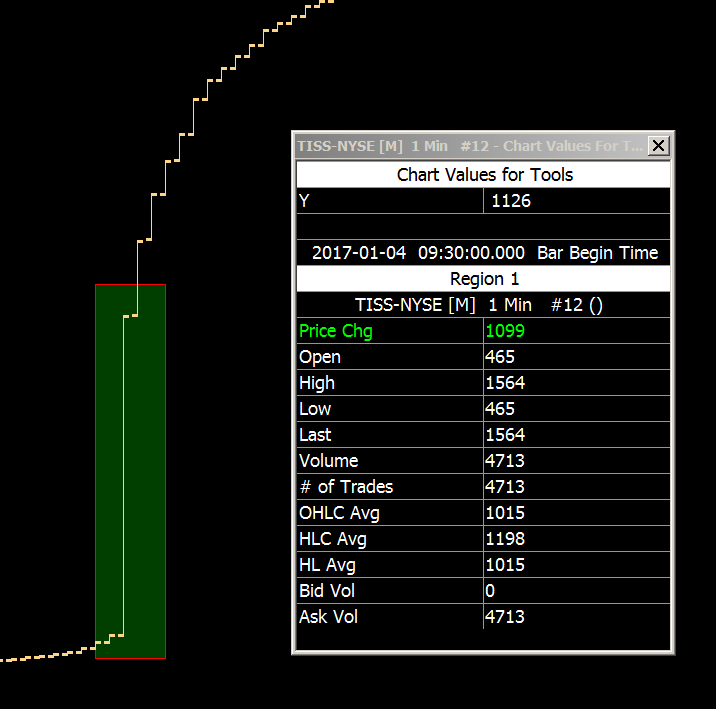
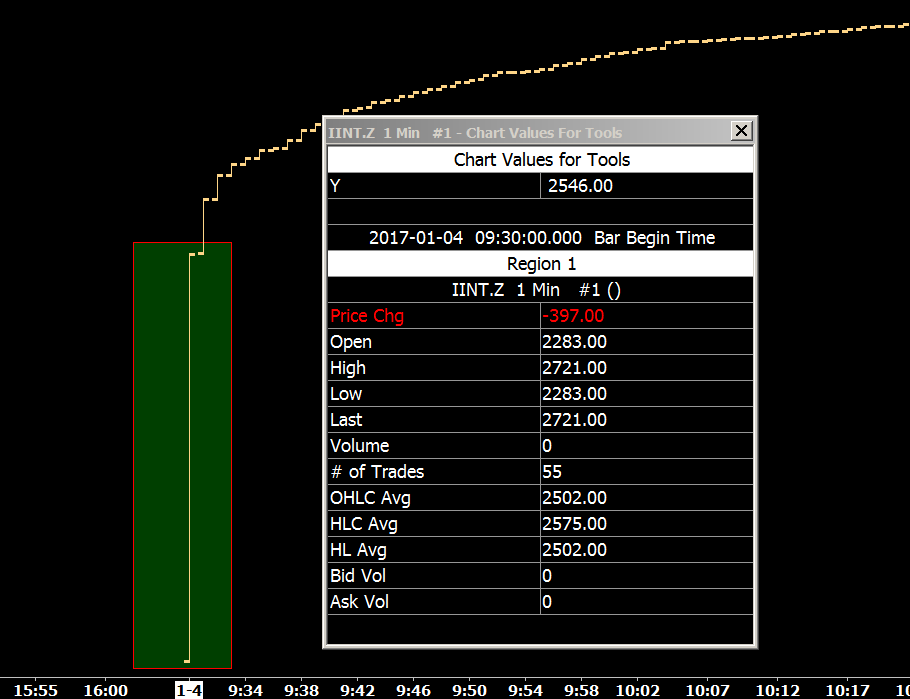
At the end of the day IQ Feed is reporting 3134 stocks trading and the SC Data Feed is reporting 3109. Essentially the same which indicates Sierra Chart is tracking the correct number of stocks on the NYSE. - We can see from the above chart images that the number of issues/stocks trading on the NYSE at 9:30:59 with SC Data feed is 1564 on 2017-01-04. IQ Feed is reporting 2721. This is a significant difference and once again we do not know the reason for this difference but it seems as though the 1564 would be more reasonable for an exchange that has 3100 stocks.
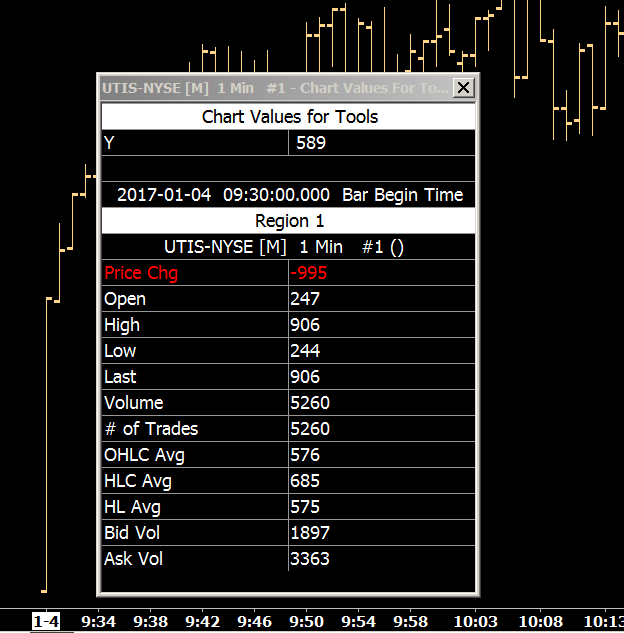
- We can see from the chart images below that the number of issues/stocks trading up at 09:30:59 on the NYSE is 906. The number of issues/stocks trading down is 612. Resulting in an TICK-NYSE reading of: 294 which is exactly what was reported by the symbol at the time.
- Finally we are going to compare the S&P 500 cash index to TICK-SP. We will estimate the TICK-NYSE reading from the TICK-SP to indicate that the Sierra Chart TICK-NYSE is giving a reliable reading. In the below screenshots we show the S&P 500 TICK from SC Data and from IQ Feed. IQ feed has two different symbols for this.
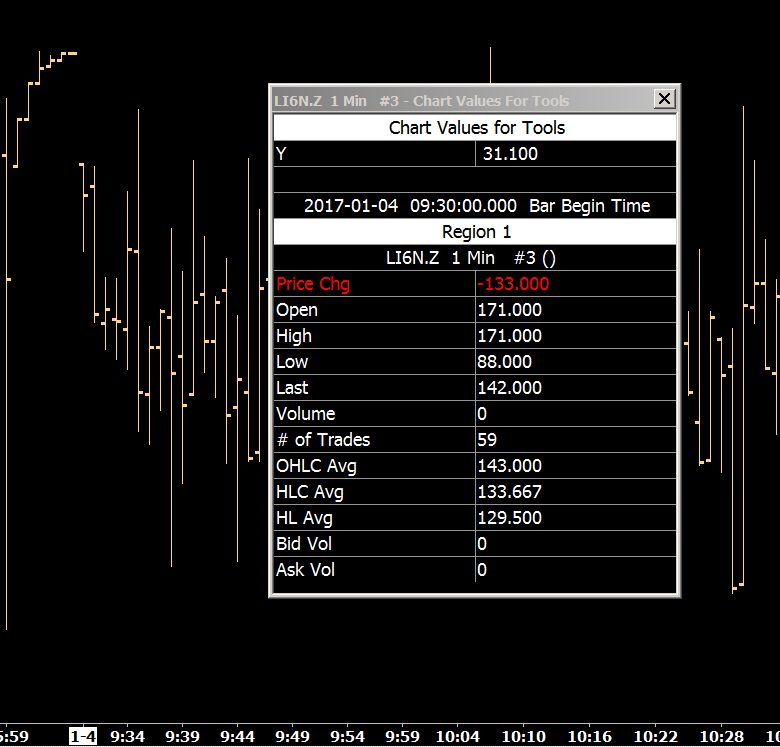
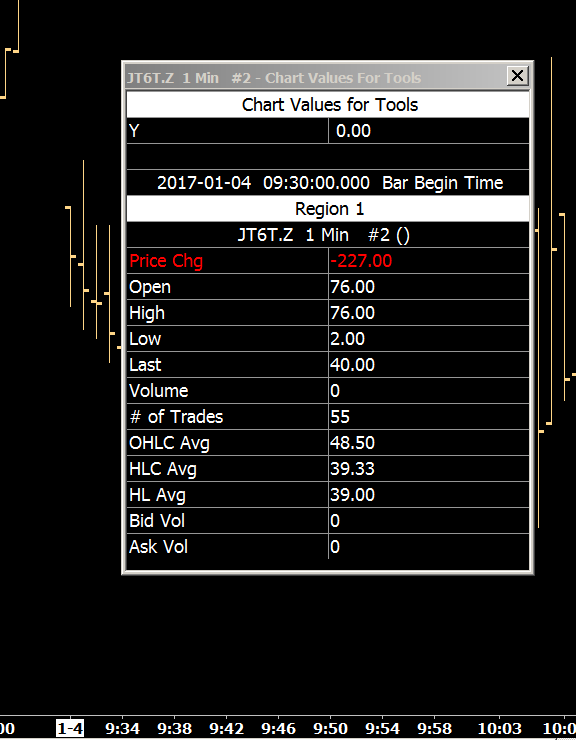
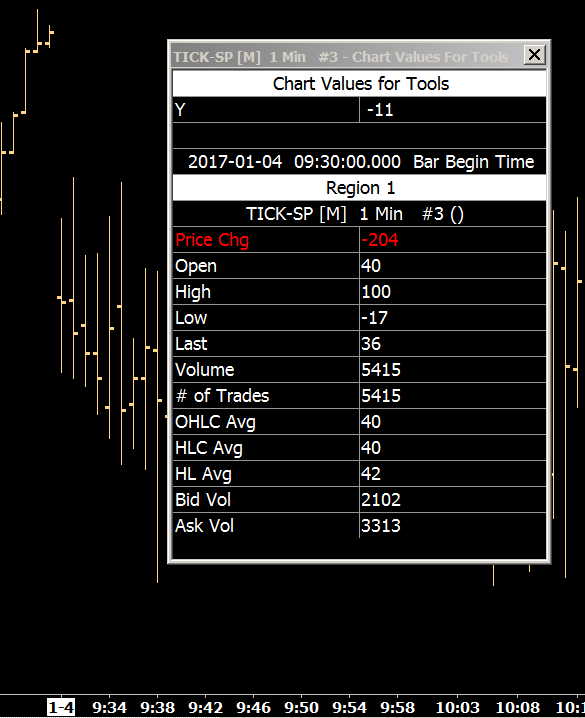
There is variation among these. And also note that the IQ Feed S&P 500 TICK which is based on trades on the exchange only (symbol: LI6N.Z) is actually higher among all of them. And we think this is really where the core problem is. You can see that the reading is higher when trade data is actually excluded from secondary exchanges. Our understanding is that the underlying Sierra Chart data feed does include secondary exchanges.
Based upon the above values we can see there is an average upper value for the S&P 500 TICK of 116 at the 9:30 US Eastern time minute. Calculation: 116 = (171 + 76 + 100) / 3.
The range for the TICK-NYSE is approximately +1100 to -1100. A 2200 point range. The range for the TICK-SP is approximately +400 to -400. A 800 point range. The value of 116 is 65% of the S&P 500 TICK range. Applying the same percentage to the TICK-NYSE gives us an estimated reading of 330 which is very close to the 324 TICK-NYSE value that Sierra Chart was indicating at this time. This validates that the TICK-NYSE reading was correct.
There definitely is nothing wrong with the underlying Barchart NYSE and NASDAQ data feed being used for the TICK and other market statistics calculations.
We know this for various reasons. The data is not delayed from observations we have done on various symbols at the NYSE open. And no user of the same real-time US equities data feed has said the data is delayed.
When examining the number of trades and volume from Intraday tick data for major symbols such at the ETF SPY and other major stocks, and comparing them to IQ Feed, there are no significant differences (within approximately .0009%).
We also know based on the TISS-NYSE which had a value of 3109 at the close of 2017-01-04 with SC Data and comparing to the equivalent IQ Feed symbol at the same time which had a value of 3134 that there is only a .8% difference in the number of issues/stocks being tracked. We are using a list of symbols provided by Barchart to determine what are the NYSE symbols. So once again we know the number of symbols being tracked is accurate.
We have also asked Barchart about their data feed in relation to the TICK differences, and they said: "As any trades made on NYSE listed securities we will report, and we are certainly not dropped packets which would be another explanation." , "Our US Equities data is from the original exchanges, and includes all trades and bid and ask messages.". They also said this about the other TICK calculations from the other providers: "My guess would be that the difference is others calculate these on only NYSE Arca trades and not across the exchange.".
Therefore, there is nothing at all wrong with the underlying Barchart data feed being used for the TICK calculations.
Differences with TICK between different providers primarily is going to be attributable to differences in the underlying data feed. What the specific reasons are for these differences, we do not know but we also know there is nothing wrong with the underlying Sierra Chart data feed. These differences definitely do not amount to meaning there is a problem with the Sierra Chart TICK calculation. But instead there is simply a difference and if anything the Sierra Chart TICK calculation is more reasonable than others.
So we can conclude the TICK calculations Sierra Chart is providing are 100 percent accurate based upon the underlying data and we know the underlying data is good. Therefore, concluding there is something wrong with the TICK is actually faulty reasoning and instead you should question what you are seeing from other providers based upon the fact that we are working with a known good data feed.
If you are not happy with the TICK-NYSE that we offer, then do not use it but understand what we are providing is accurate and your conclusion that there is something wrong with it is not based upon sound reasoning and is not supported by fact.
And after this analysis again, we can only conclude that what you are seeing from other providers is actually questionable and likely unreasonable and not accurate. They certainly can be misleading when comparing to the S&P 500 cash index. The TICK calculation provided by Sierra Chart is a much more reasonable and stable representation of unweighted trade activity on the market.
For additional information, refer to this Support Board posting.
Opening TICK Values
Sometimes we hear the comment, that the market has opened way up or down, and the TICK calculation does not reflect that. Once again, this is a flawed method of analysis.
Trading activity from an exchange, is a single stream of data. At the 9:30 AM US Eastern time NYSE open, the very first TICK value will either be +1 or -1, for the first stock traded. And then from there, it will increase or decrease as the data is received from subsequent trading activity since the very first trade.
Now what actually happens in the case of the Sierra Chart calculated TICK for the NYSE and other exchanges and indexes is that the calculation begins at the open of the premarket which is 4 AM US Eastern time.
So at the 9:30 AM open, the TICK will reflect the number of stocks trading up minus the number of stocks trading down at that point. However, since most stocks have not yet traded before 9:30 AM, you are not going to see an extreme up or down value at the 9:30 AM open. If you see this extreme with other provided TICK calculations, then right away you need to recognize that those values are indeed very likely erroneous and demonstrate very substandard and incompetent market statistics by these other providers. This is a basic fact.
Market Statistics Calculation Change April 2019
Effective April 25, 2019 a change was made with market statistics calculations where when the best bid/ask prices, both are beyond the last trade price, then the changes with those bid/ask prices are counted as trades with no volume which then contributes towards the calculations like the TICK and the other market statistics symbols. This applies to the symbols for all of the different exchanges and indexes market statistics are calculated for.
The way this works is that if the best Bid price is above the last trade price, and it has increased compared to the prior Bid price, then it is counted as an uptick. If the best Ask price is below the last trade price and it has decreased compared to the prior Ask price, then it is counted as a downtick. This counting of upticks and downticks continues until such time that the Bid and Ask are no longer fully above or below the last trade price.
This allows the number of stocks at the open which participate in the TICK and other calculations to be higher and causes greater extremes in the TICK calculation.
We have been monitoring this change and we believe that is a good change since some users point out that the market statistics calculations that Sierra Chart offers sometimes are different than other services, in particular around the daily open of the stock exchange.
Although we have consistently shown, that the calculations we have been providing are correct. We have written about this extensively.
So in effect, the reason for the change is to make the market statistics more predictive because we are including actual order activity which will eventually result in trades. And to reduce the number of questions we receive about the market statistics which actually has been the case.
Conclusion
Based upon all of the above information, what can be concluded? The Sierra Chart provided TICK market statistics calculations are accurate and reliable.
You will see differences among all of the different vendors TICK market statistics calculations.
Do the differences make one better than the other, perhaps with someone's particular view that might be the case but as we have shown it does not mean that the Sierra Chart calculated TICK is inaccurate.
Being that the TICK is not a weighted calculation, due to the nature of the calculation and due to some inevitable variations with the underlying stock data it is calculated from, this only reveals the inconsistent nature of the TICK calculation among data services when comparing it to the underlying stock indexes.
If you are not satisfied with the Sierra Chart calculated TICK market statistics, then perhaps it is more a nature of the TICK calculation in general which you should examine as a method of your analysis and the reliance that you currently have on it.
Mathematically Calculating Up Issues and Down Issues in TICK Statistic
While there are symbols which provide the number of stocks which have traded up and have traded down on the NYSE which are used in the TICK-NYSE calculation, it is possible to mathematically determine these values.
We know the current number of stocks which have traded for the day from the TISS-NYSE symbol. And we also know the current value of TICK-NYSE .
Let the number of stocks that have traded up be \(u\), and let the number of stocks that have traded down be \(d\). If we know the sum \(S\) and difference \(D\) of these numbers, then we can compute them by solving the following system of equations.
\(u + d = S\)\(u - d = D\)
When solved, this system yields the formulas \(u = \frac{1}{2}(S + D)\) and \(d = \frac{1}{2}(S - D)\).
*Last modified Wednesday, 10th May, 2023.