Home >> (Table of Contents) Help/Frequently Asked Questions >> Help topic 67: Hiding Study and Main Price Graph Names and Values from the Values Windows and Region Data Line
Hiding Study and Main Price Graph Names and Values from the Values Windows and Region Data Line
- Hiding Region Data Lines
- Hiding Main Price Graph Values from the Values Windows
- Reordering and Hiding Chart Header Fields in the First Region Data Line
- Hiding Study Names and Values from the Values Windows and Region Data Line
In this help topic, Values Windows refers to the following:
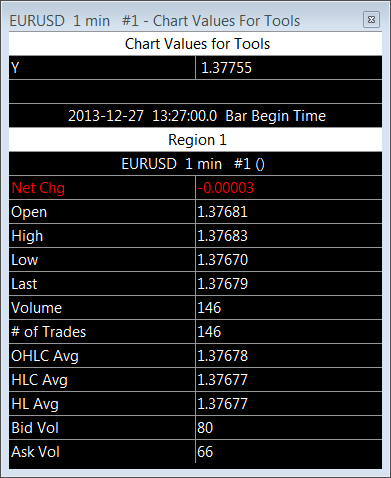
- Chart Values Window (Window >> Chart Values Window). Refer to Image 4.
- Tool Values Window (Window >> Tool Values Window).
- Compact Tool Values Window (Window >> Show Compact Tool Values Window).
This help topic explains how to hide chart and study values from being displayed. By doing the opposite of the instructions, you can make the values visible if they were previously hidden.
Hiding Region Data Lines
It is possible to hide any of the Region Data Lines in a chart. There are a total of 8 of them depending upon the number of Chart Regions being used.
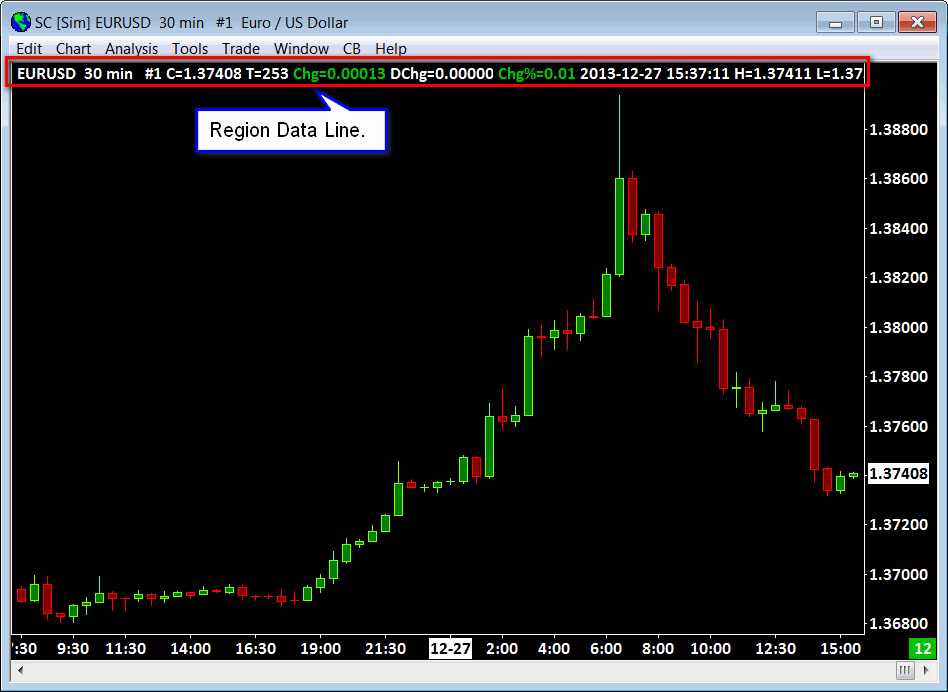
For an example of a Region Data Line, refer to Image 1.
Select Chart >> Chart Settings. In the Region Data Lines >> Region Number list box, select the chart region that you want to change and select the state for it in the State list box.
You can choose between Visible, Hidden and Overlapped.
Each region on the chart has a number, #1 is the top most region and #8 is the bottom most region. Refer to Images 2.
Hiding Main Price Graph Values from the Values Windows
To hide Main Price Graph values from the Values Windows, including the Compact Tool Values Window, select Chart >> Chart Settings >> Display.
If you want to hide all of the values, remove the checkmark from Display Main Price Graph Values in Values Windows option.
Or you can selectively choose which values to hide or display by pressing the Settings button to the right of that option and unchecking the values you do not want to see. Refer to Images 2.
Reordering and Hiding Chart Header Fields in the First Region Data Line
The non-study data fields in the first Region Data Line (refer to Image 1) contain the various fields which are called the Chart Header Fields. These fields can be reordered, hidden and displayed. Select Global Settings >> Customize Chart Header to change these fields.
Hiding Study Names and Values from the Values Windows and Region Data Line
In the Study Settings >> Subgraphs tab for a study, there are various controls available for hiding the study Name, Inputs, and Subgraph Names and Values.
Refer to Adding/Modifying Chart Studies for instructions to open the Study Settings window for a study.
Refer to Image 3 to visually see these settings and their location.
For complete descriptions for each of the settings for hiding study Names and Values from the Values Windows and Region Data Line, refer to the Study Settings window documentation.
Image 1
Images 2
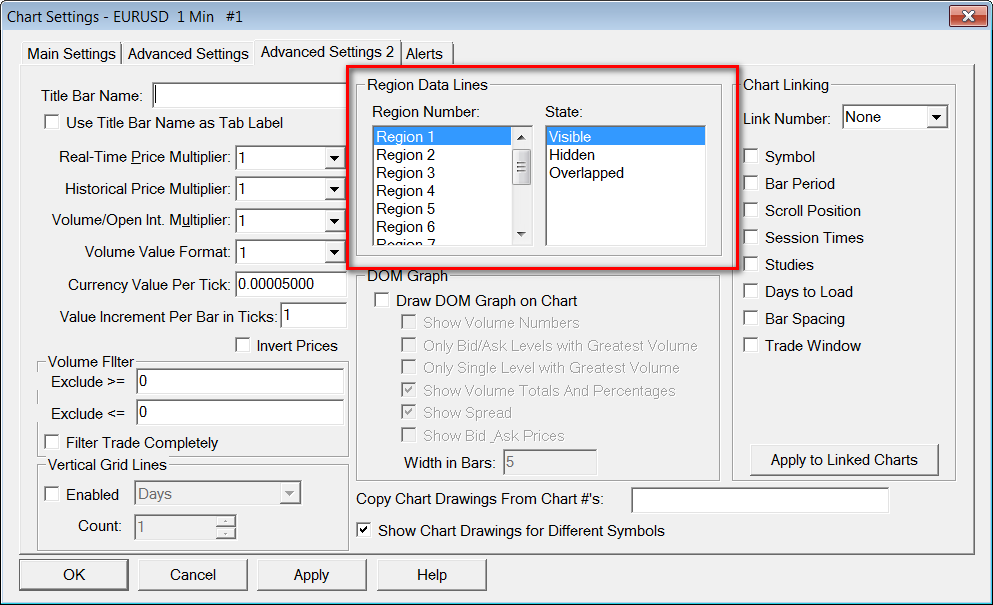
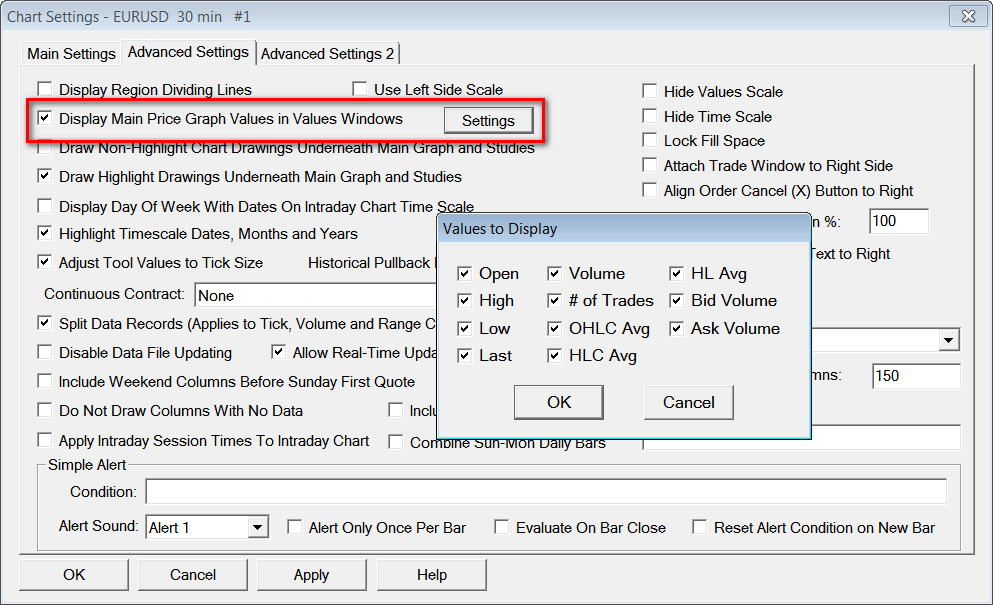
Image 3
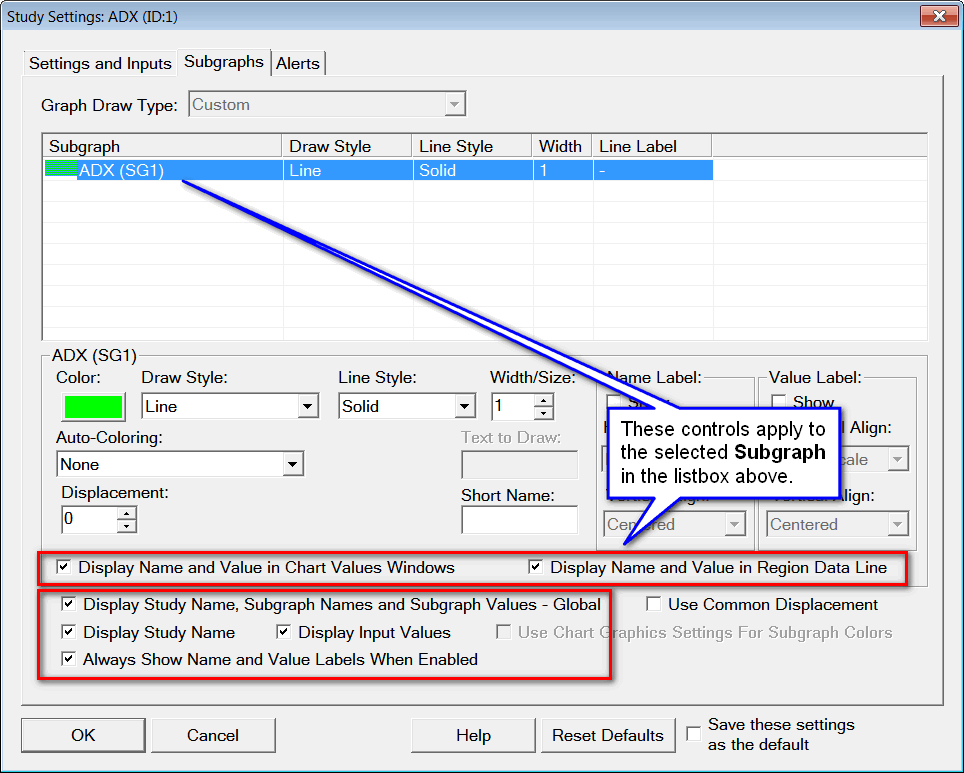
Image 4
*Last modified Tuesday, 29th November, 2022.