Graph Draw Types
- Introduction
- Available Graph Draw Types
- Open High Low Close (OHLC) Bars
- CandleStick Bars
- Candlestick Body Only Bars
- Candlestick Bars Hollow
- Line on Close
- Mountain
- HLC Bars
- HL Bars
- Line On Open
- Line On HL Avg
- Stair Step on Close
- Bid Ask Volume Bars
- Price Volume Bars
- Candle Price Volume Bars
- Candle Price Volume Bars Hollow
- Renko Brick
- Renko Brick With Wicks
- Blank
Introduction
Graph Draw Types set the type of graph to be displayed using the bar data which includes Open, High, Low and Close data.
There several ways to set the Graph Draw Type:
- To set the Graph Draw Type for the main price graph of the chart, select Chart >> Chart Settings >> Bar Period.
- In the Graph Draw Type box, select the Graph Draw Type that you require.
- The alternative way to quickly set the Graph Draw Type for the main price graph of the chart, is to select Chart >> Graph Draw Types and choose the Graph Draw Type that you require in the list on the menu.
- To set the Graph Draw Type for a study that supports the Graph Draw Type setting, open the Study Settings window.
- Select the Subgraphs tab of the Study Settings window.
- Change the Graph Draw Type to what you require. Refer to Adding/Modifying Studies for instructions.
In the case of when using one of the Graph Draw Types for a study, refer to Color Settings for Graph Draw Types for information about the color settings.
Available Graph Draw Types
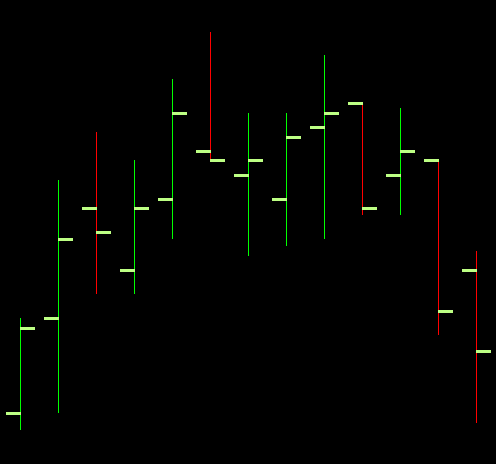
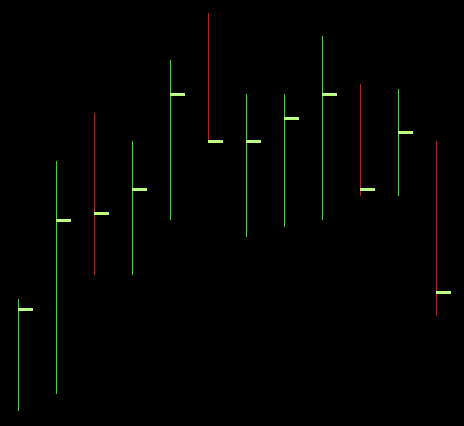
Open High Low Close (OHLC) Bars
The vertical line of the bar indicates the High and Low for the period of the bar. The mark on the left is the Open. The mark on the right is the Close or last.
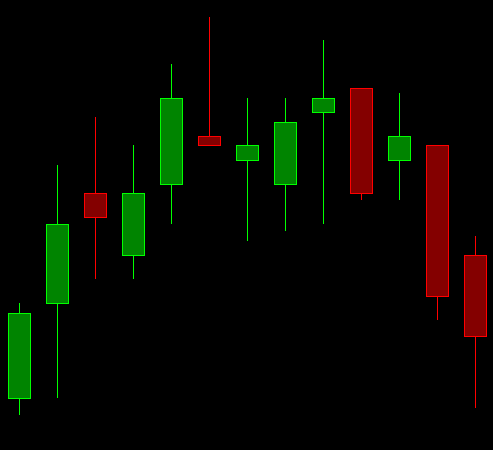
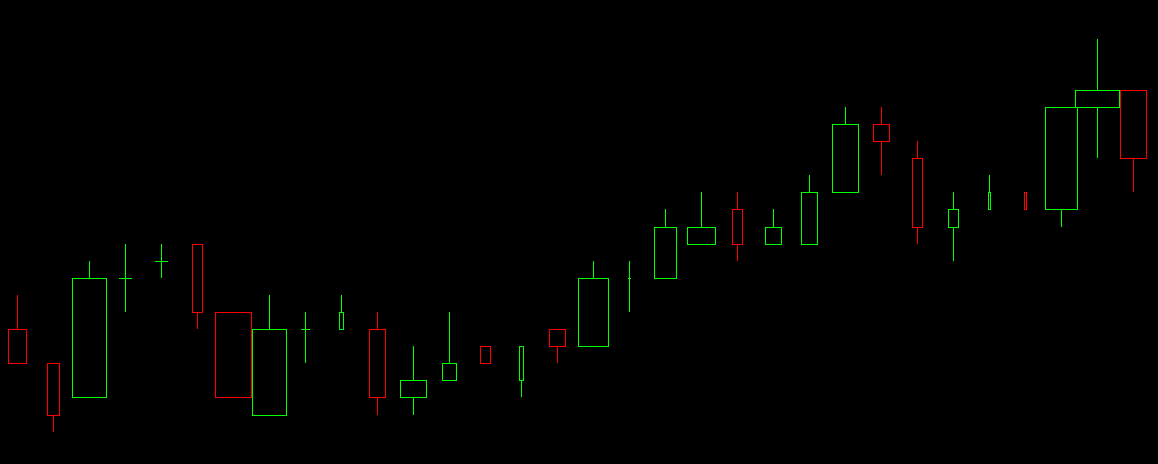
CandleStick Bars
The vertical line in this type of bar indicates the High and Low for the period of the bar. The box/body over the line goes from the Open to the Close for the period of the bar.
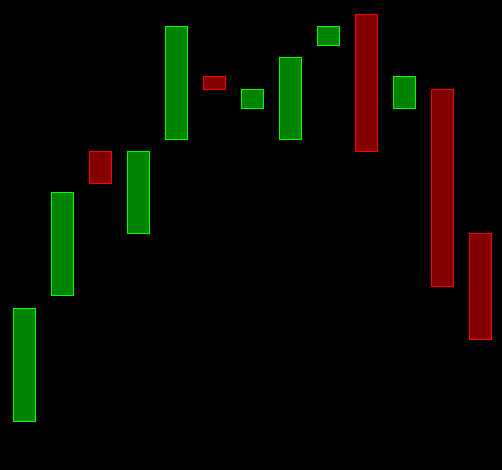
Candlestick Body Only Bars
This is similar to the Candlestick Bars, except that only the box/body, that goes from the Open to the Close for the period of the bar, is displayed.
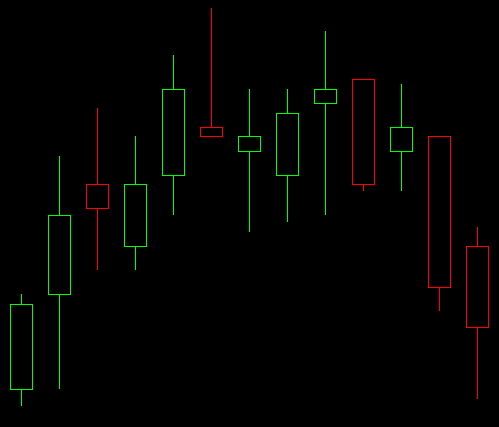
Candlestick Bars Hollow
This is the same as the Candlestick Bars except that the box/body is not colored in (the center of the body is hollow).
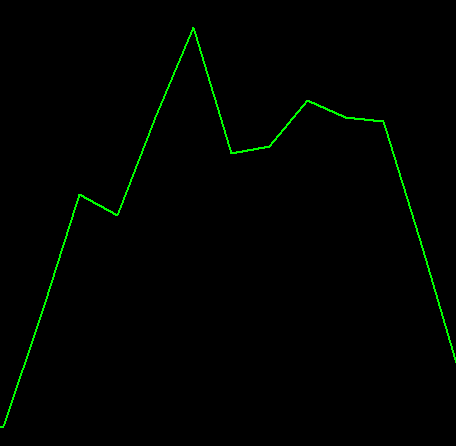
Line on Close
A line drawn at the level of the closing price for the period of a chart column to the closing price of next period.

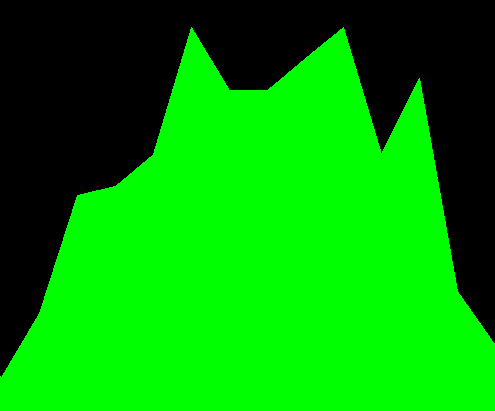
Mountain
The Mountain Graph Draw Type draws a Mountain graph using the period Close values.
The color for the Mountain Graph Draw Type can be set through the Graphics Settings window.
The specific color setting is Line on Close / Line On Open / Mountain and is listed in the Colors and Widths list.
HLC Bars
The HLC Bars Graph Draw Type is similar to the OHLC Bars Graph Draw Type, except that the Open value is not displayed on the chart.
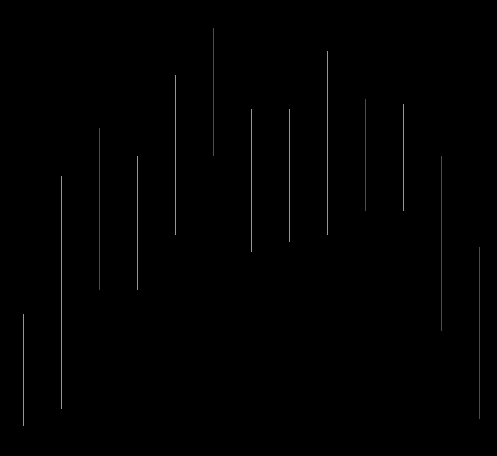
HL Bars
The HL Bars Graph Draw Type is similar to the OHLC Bars Graph Draw Type, except that the Open and Close values are not displayed on the chart.
Line On Open
The Line On Open Graph Draw Type draws a line from the Open Price of one bar period to the Open Price of the next bar period.

Line On HL Avg
The Line On HL Avg Graph Draw Type draws a line from the average of the High Price and the Low Price of one bar period to the average of the High Price and the Low Price of the next bar period.
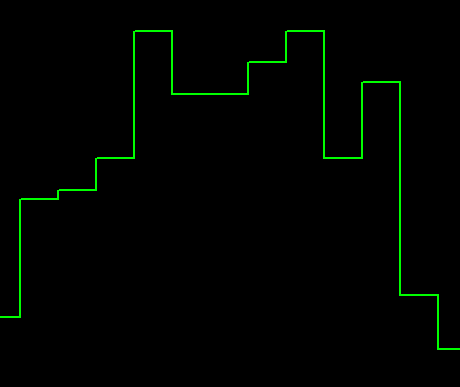
Stair Step on Close
Draws a Stair Step graph using the period Close values.
Bid Ask Volume Bars
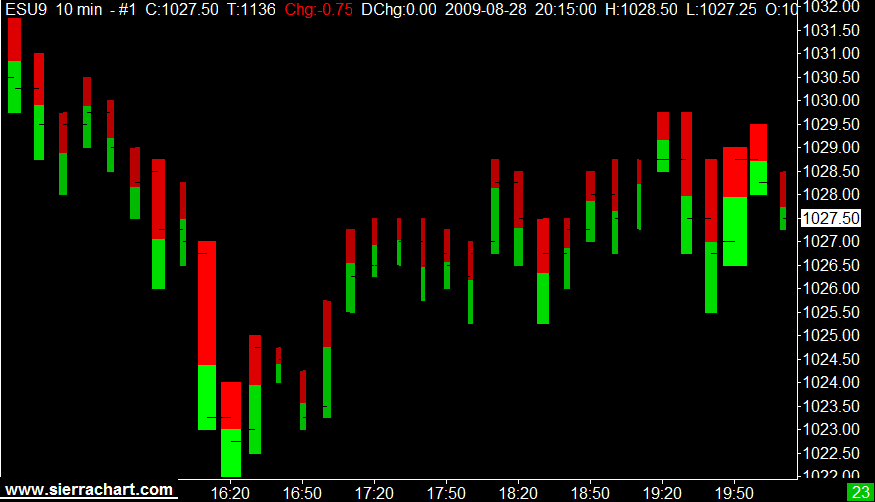
This graph is based on the Bid Volume, Ask Volume and total volume data as well as the Open, High, Low, and Close values.
For these bars to function as documented you must have Bid Volume and Ask Volume for the symbol of the chart. To confirm that you do, add the Bid Volume and Ask Volume studies to the chart. If these studies do not display any bars or have missing bars, then where you do not see bars you do not have Bid Volume and Ask Volume available. If Bid Volume and Ask Volume are not known for a bar in the chart, they are assumed to each be 50% of the total volume of the bar.
Each bar provides the following information:
- High price value: The top of the bar.
- Low price value: The bottom of the bar.
- Open price value: The thin dash on the left of the bar.
- Close price value: The thin dash on the right of the bar.
- Volume: The width of the bar depends on its total volume. The widest bar corresponds to the bar with the largest volume among the visible bars in the chart. The narrowest bar corresponds to the bar with lowest volume among the visible bars in the chart.
- BidVolume and AskVolume: The bar has two colors. The Bid Volume color (red by default) represents the volume of the trades that make up the bar that traded at the Bid. The Ask Volume color (green by default) represents the volume of the trades that make up the bar that traded at the Ask. For example, if Bid volume and Ask volume each represent 50% of the total volume, then each will be 50% of the bar. The color of BidVolume and AskVolume depends upon the width of the bar. These colors are explained in the Bid Ask Volume Bars Color Settings section.
The largest width for these types of chart bars is controlled through the Global Settings >> Graphics Settings >> Other >> Price Volume Bars Width % setting. The default setting is 125 percent.
Color Settings for Bid Ask Volume Bars
You can set the colors for the Bid Ask Volume Bars Graph Draw Type through the Graphics Settings window.
The color settings are in the Colors and Widths list.

| Color | Description |
|---|---|
| Bid Ask Bar: Large Volume Ask Color | This color is used for the Ask Volume portion of the bar when the total volume of the bar is in the 75% to 100% range of the volumes of the displayed bars. |
| Bid Ask Bar: Medium - Large Volume Ask Color | This color is used for the Ask Volume portion of the bar when the total volume of the bar is in the 50% to less than 75% range of the volumes of the displayed bars. |
| Bid Ask Bar: Light - Medium Volume Ask Color | This color is used for the Ask Volume portion of the bar when the total volume of the bar is in the 25% to less than 50% range of the volumes of the displayed bars. |
| Bid Ask Bar: Light Volume Ask Color | This color is used for the Ask Volume portion of the bar when the total volume of the bar is in the 0% to less than 25% range of the volumes of the displayed bars. |
| Bid Ask Bar: Large Volume Bid Color | This color is used for the Bid Volume portion of the bar when the total volume of the bar is in the 75% to 100% range of the volumes of the displayed bars. |
| Bid Ask Bar: Medium - Large Volume Bid Color | This color is used for the Bid Volume portion of the bar when the total volume of the bar is in the 50% to less than 75% range of the volumes of the displayed bars. |
| Bid Ask Bar: Light - Medium Volume Bid Color | This color is used for the Bid Volume portion of the bar when the total volume of the bar is in the 25% to less than 50% range of the volumes of the displayed bars. |
| Bid Ask Bar: Light Volume Bid Color | This color is used for the Bid Volume portion of the bar when the total volume of the bar is in the 0% to less than 25% range of the volumes of the displayed bars. |
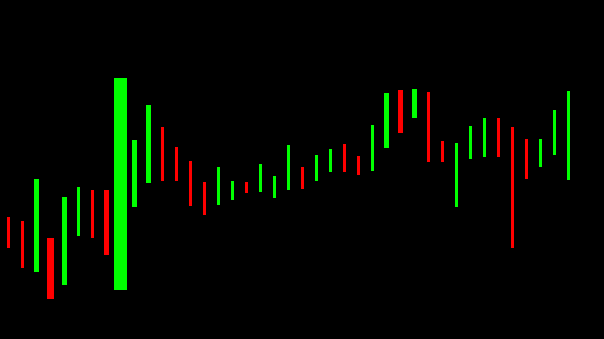
Price Volume Bars
This Graph Draw Type will combine Price and Volume into the chart bars. The width of the bar depends on the Volume compared to the Volume of other bars displayed within the visible chart window. The wider the bar, the higher the volume of that bar relative to the other bars that are visible.
These bars are also reffered to as EquiVolume Bars.
For these bars to function properly, the symbol must have Volume data.
The largest width for these types of chart bars is controlled through the Global Settings >> Graphics Settings >> Other >> Price Volume Bars Width % setting. The default setting is 125 percent.
For each chart bar there is a consistent amount of space in the chart regardless of the width of the actual displayed bar itself. To change the spacing between the bars, refer to Changing Bar Spacing.
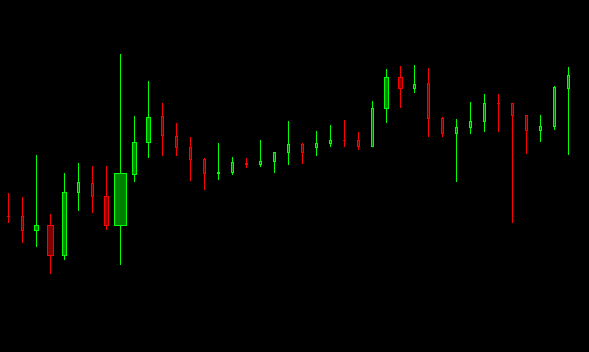
Candle Price Volume Bars
The Candle Price Volume Bars Graph Draw Type draws candlesticks that have a variable width based upon the volume of the candlestick relative to the candlestick with the maximum volume.
A narrow width indicates that the candlestick bar has a lower volume compared to the visible candlestick bar with the maximum volume.
A wide width indicates the candlestick bar has a larger volume compared to the visible candlestick bar with the minimum volume.
The width of a candlestick bar is based upon the comparison of the volume of that particular bar to the visible candlestick bar with the maximum volume. Therefore, as you scroll the chart, the candlestick bar widths can change previous to what they were at a different position in the chart.
The largest width for these types of chart bars is controlled through the Global Settings >> Graphics Settings >> Other >> Price Volume Bars Width % setting. The default setting is 125 percent.
Candle Price Volume Bars Hollow
The Candle Price Volume Bars Hollow Graph Draw Type draws candlesticks that have a variable width based upon the volume of the candlestick relative to the candlestick with the maximum volume. The interior of these candlesticks is not colored in.
A narrow width indicates that the candlestick bar has a lower volume compared to the visible candlestick bar with the maximum volume.
A wide width indicates the candlestick bar has a larger volume compared to the visible candlestick bar with the minimum volume.
The width of a candlestick bar is based upon the comparison of the volume of that particular bar to the visible candlestick bar with the maximum volume. Therefore, as you scroll the chart, the candlestick bar widths can change previous to what they were at a different position in the chart.
The largest width for these types of chart bars is controlled through the Global Settings >> Graphics Settings >> Other >> Price Volume Bars Width % setting. The default setting is 125 percent.
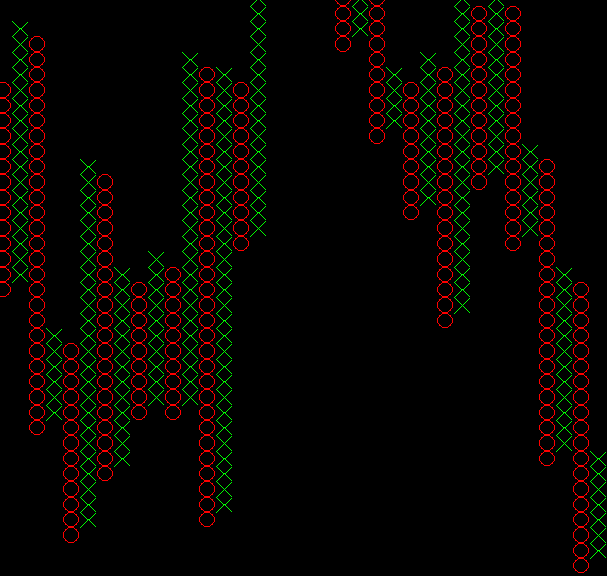
Point and Figure XO
The Point and Figure XO Graph Draw Type consists of columns of X's or O's. An X column is created when the price of the symbol is going up. An O column is created when the price of the symbol is going down. One X or O is drawn for each price move of the specified Box Size Input.
If the price of the symbol reverses direction by the number of boxes specified by the Reversal Size Input setting or more, then a new column is created in the opposite direction. If the prior column consisted of X's, then the next column will be O's, or O's if the prior column is X's. The Reversal Size in no way controls the minimum number of boxes per chart column. The number of boxes per chart column just simply depends upon whether a reversal has occurred based on the price action of the symbol. So there can be just one box.
The chart Tick Size can be changed to whatever that you require and this will affect the Box Size. However, this does not change the values of the underlying data in the chart. Those will remain the same. And as explained below all comparisons are based upon the Price Display Format setting on the chart.
For more information on how Point and Figure charts are generated, refer to the Point and Figure Chart Study.
Renko Bricks
The Renko Brick Graph Draw Type draws a Renko Brick body based on the Bar Size as defined in Chart >> Chart Settings.
For more information on Renko Bricks and how to create a Chart using Renko Bricks see the Renko Charts documentation.

Renko Brick With Wicks
The Renko Brick With Wicks Graph Draw Type is similar to the Renko Brick Graph Draw Type, except that it includes lines (wicks) on the top and bottom of the Renko Brick Body that extend up to the High and down to the Low of the bar.
For more information on Renko Bricks With Wicks and how to create a Chart using Renko Bricks With Wicks see the Renko Charts documentation.

Blank
The Blank Graph Draw Type does not display any bars in the chart
*Last modified Wednesday, 06th December, 2023.