Home >> (Table of Contents) Studies and Indicators >> Technical Studies Reference >> Study Subgraph Above Below Bar As Text
Technical Studies Reference
- Technical Studies Reference
- Common Study Inputs (Opens a new page)
- Using Studies (Opens a new page)
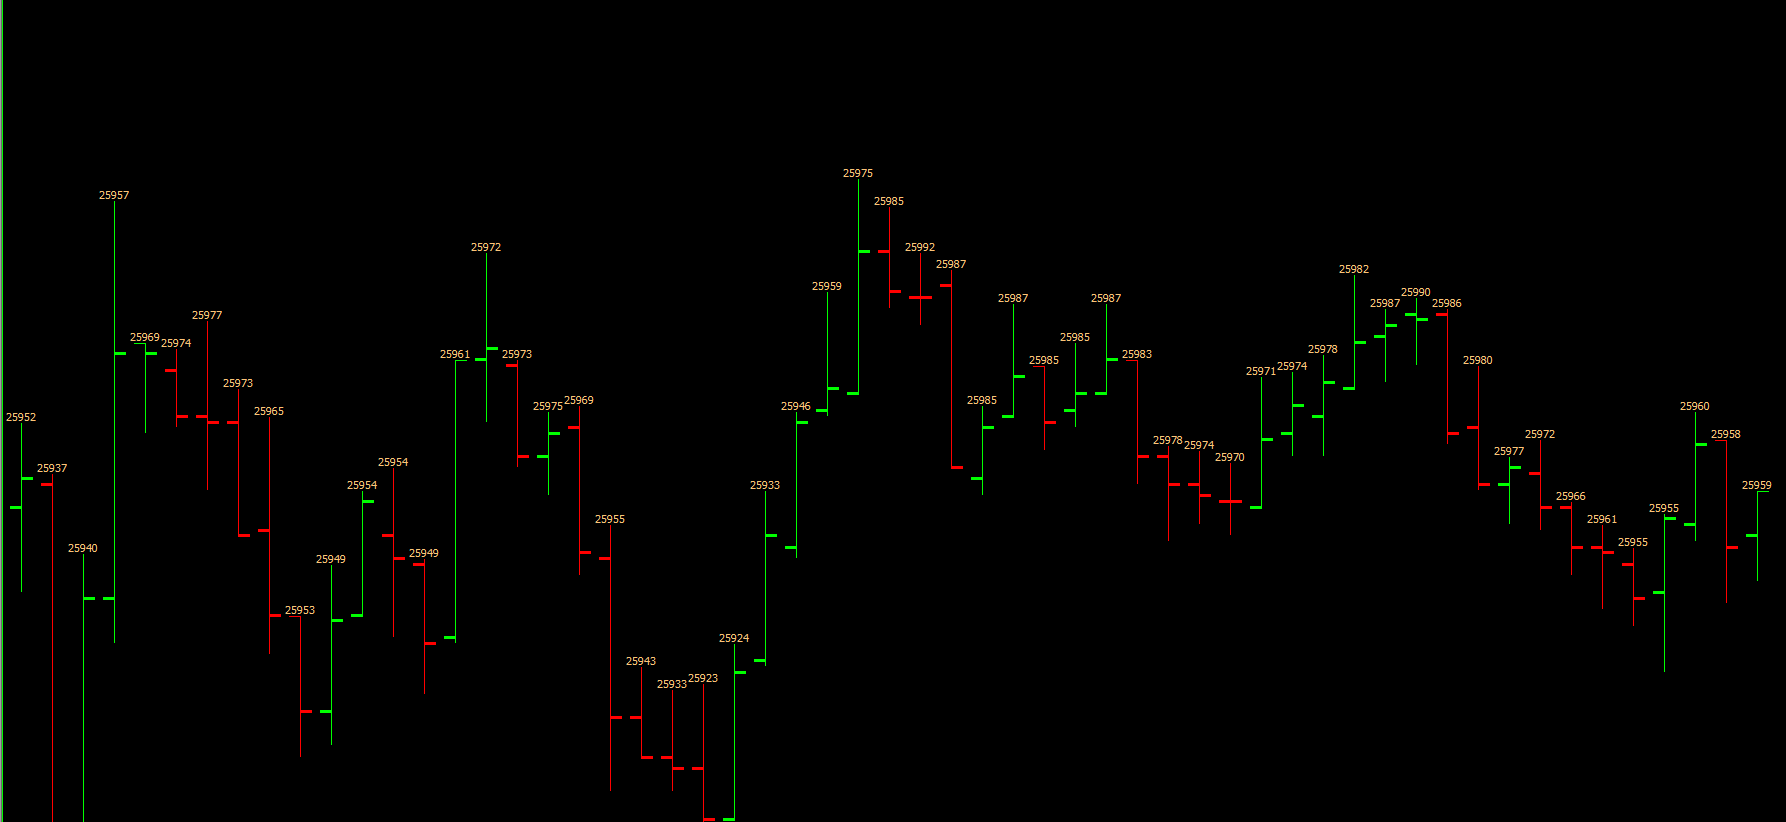
Study Subgraph Above/Below Bar as Text
This study displays the value of the study Subgraph as text at each chart bar. To select the study to use, set the Based On study setting to that study and set the Input Data Input to the specific study Subgraph.
Let \(X\) be a random variable denoting the Input Data Input, and let \(X_t\) be the value of the Input Data at Index \(t\). Then the value of Study Subgraph As Text Above/Below Bar at Index \(t\) is the value of \(X_t\), which is displayed as text.
If the Draw Zeros Input is set to No, then Study Subgraph As Text Above/Below Bar is not drawn at Index \(t\) if \(X_t = 0\). Otherwise, it is drawn at Index \(t\) even if \(X_t = 0\).
By default, the the Subgraph >> Draw Style is set to Custom Value at Y. This can be changed to Value on Low to display the values of the Input Data below the chart bars, or to Value On High to display the values above the bars. Doing this, however, will not use the Input Offset in Ticks.
It is possible to use this study to display information from a different Chart Region. To do this, however, the Subgraph >> Draw Style must be set to Value on High or Value on Low.
The size of the text is controlled with the Subgraphs >> Study Subgraph (SG1) >> Width/Size setting in the Study Settings window.
When displaying a study Subgraph as text, you may want to set the original source study Subgraph Draw Style to Ignore so it is not visible any longer if you no longer need to see it.
Inputs
- Input Data.
- Display Location: This Input contains two options that are used to set the location of the text. Note that this will not apply when using a subgraph draw style other than Custom Value at Y. The options are:
- Top of Bar: This sets the text at the top of (above) the bar.
- Bottom of Bar: This sets the text at the bottom of (below) the bar.
- Offset in Ticks: This sets the distance, in ticks, that the text is drawn offset from the bar. A positive offset value will be in the direction of the setting for Display Location. For example, if the Display Location is set to Bottom of Bar then positive values for this Input will move the text towards the bottom of the screen and vice versa. Negative values can be entered.
- Draw Zeros: When this Input is set to Yes, then zero values from the study Subgraph will be drawn. Otherwise, they will not be.
- Additional Forward Columns: This input controls whether additional columns forward from the last bar in the Main Price Graph will have information displayed.
- Offset in Text Heights (+/-): This supports offsetting the text by a positive or negative amount in units of the text size. If this is set to 1 at a particular chart bar index, then the text will be offset down by the amount of the text height. If this is set to -1 the text will be offset up by the text height. Using a larger values will increase the amount of the offset.
*Last modified Monday, 03rd October, 2022.