Technical Studies Reference
- Technical Studies Reference
- Common Study Inputs (Opens a new page)
- Using Studies (Opens a new page)
Zig Zag
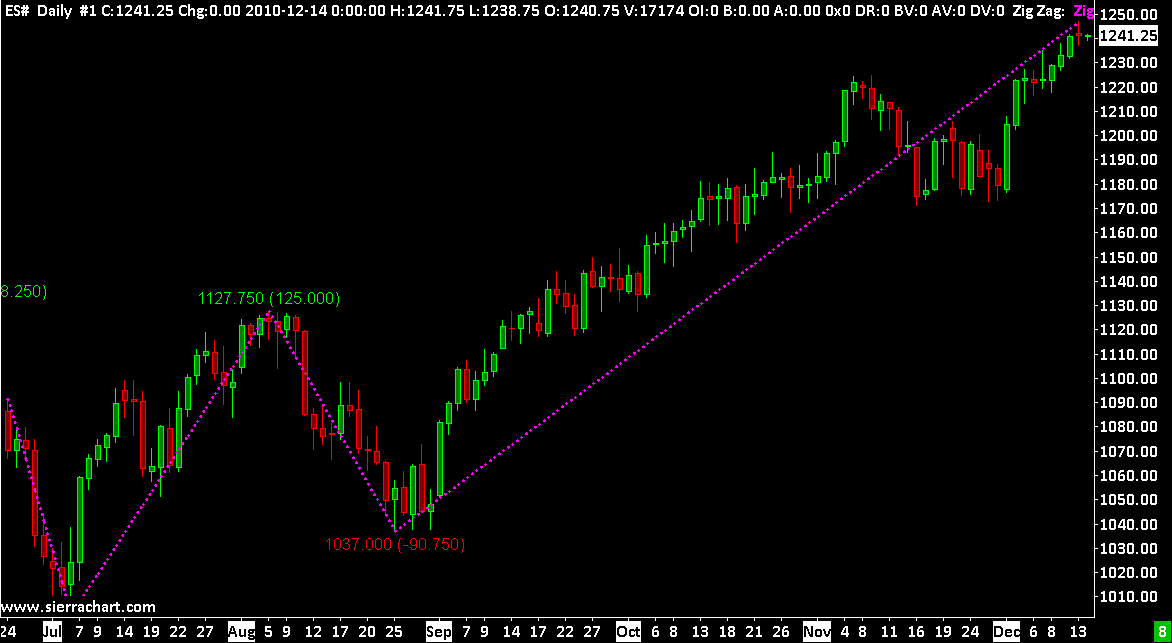
The Zig Zag study draws lines from Highs and Lows in the main price graph according to the documented calculation methods. A new line will start where prices have reversed by the specified amount.
The High and Low values of a bar are used in the calculations. These can be changed with the Input Data Inputs in case you want to base the study on another study.
The Sierra_Chart Zig Zag study has three calculation modes. Each calculation mode is described here so you understand exactly how they work.
This documentation also applies to the Zig Zag Cumulative Volume study which calculates and draws the cumulative volume across each Zig Zag line. The volume is drawn as volume bars in its own graph region. The volume resets at the start of a new Zig Zag line.
The Zig Zag line does not always extend to the very last bar in the chart unless the last chart bar is the start of a reversal. This is something to keep in mind when viewing the Zig Zag data in a Spreadsheet, when using one of the Spreadsheet studies because the most recent rows outputted for the study Subgraph will be 0 if the Zig Zag line does not extend to the end of the chart.
Calculation Modes 1 and 3
This section describes Calculation Modes 1 and 3.
When the Zig Zag study is called for the first time, it determines the initial trend direction. The Low and High of the first bar in the chart are compared to the following bars.
If following bars Low and High are higher than those of the first bar, then the trend is considered Up. There is a trend line drawn from the Low of the first bar in the chart to the High of the bar that determined the direction.
If the following bars Low and High are lower than those of the first bar, then the trend is considered Down. There is a trend line drawn from the High of the first bar in the chart to the Low of the bar that determined the direction.
The High and Low values from the bar that determined the trend are remembered. These are named LastHigh and LastLow.
Next, the study function begins to iterate through bars in the chart. A ReversalPrice variable is calculated for determining if trend direction should change. The calculation of ReversalPrice differs for an Up or Down trend and for calculation modes 1 and 3 as follows:
- Mode 1 with Up trend: ReversalPrice = LastHigh - (LastHigh * Reversal % for Calculation Mode 1)
- Mode 3 with Up trend: ReversalPrice = LastHigh - Reversal Amount for Calculation Mode 2,3
- Mode 1 With Down trend: ReversalPrice = LastLow + (LastLow * Reversal % for Calculation Mode 1)
- Mode 3 With Down trend: ReversalPrice = LastLow + Reversal Amount for Calculation Mode 2,3
If there currently is an Up trend (Up line) and the calculated ReversalPrice is exceeded downwards by the low of a bar during the iteration of the bars, then the trend changes its direction to Down. The Low of the bar that changed the direction is stored as the LastLow. If the trend does not change directon at a bar during the iteration, then we check if the High of the bar is higher than the LastHigh. If this is true, then we set LastHigh value to High of the bar and make this high the endpoint for the Up trend line.
If there currently is a Down trend (Down line) and the calculated ReversalPrice is exceeded upwards by the high of a bar during the iteration of the bars, then the trend changes its direction to Up. The High of the bar that changed the direction is stored as the LastHigh. If the trend does not change directon at a bar during the iteration, then we check if the Low of the bar is lower than the LastLow. If this is true, then we set LastLow value to Low of the bar and make this low the endpoint for the Down trend line.
To gain an understanding of the above description, it is recommended to Replay the chart to see the formation of the Zig Zag lines as the chart bars are built.
In the case of when using any type of Renko bars, make sure you are understanding for each chart bar what are the actual High and Low values when evaluating the bar data according to the explanation above, in case they are not actually visible based upon the values and the Graph Draw Type. You will need to use the Chart Values tool to determine the High and Low values for each chart bar. This is essential in order to make sure you are not being misled by making an assumption about what the High and Low Values are.
Calculation Mode 2
When the Zig Zag study is called for the first time, it determines the initial trend direction. The Low and High of the first bar in the chart are compared to the following bars.
If following bars Low and High are higher than those of the first bar, then the trend is considered Up. There is a trend line drawn from the Low of the first bar in the chart to the High of the bar that determined the direction.
If the following bars Low and High are lower than those of the first bar, then the trend is considered Down. There is a trend line drawn from the High of the first bar in the chart to the Low of the bar that determined the direction.
The High and Low values from the bar that determined the trend are remembered. These are named LastHigh and LastLow.
Next, the Zig Zag study begins to iterate through the bars in the chart.
For a current Uptrend: If the next bar's High is equal or greater than LastHigh, then LastHigh is set to the new High and the Up trend line is adjusted to the high of this next bar.
If the next bar's High is lower than LastHigh, then the trend may become Down starting from this bar. The following conditions are checked at this point:
1. If the Reversal Amount for Calculation Mode 2,3 Input value has been exceeded by the difference between LastHigh to the Low of the next bar, and the number of bars since the LastHigh for the Up trend line equals or exceeds the Number of Bars Required for Reversal study Input, the Trend is changed to Down and new Zig Zag Down trend line is started. The Low of the bar that changed the direction is stored as the LastLow.
2. If the above condition has not been met and the next bar's Low is lower than the low of the current Up trend line, then trend is changed to Down immediately, without waiting for Number of Bars Required for Reversal to be satisfied.
For a current Downtrend: If the next bar's Low is equal or less than LastLow, then LastLow is set to the new Low and the Down trend line is adjusted to the low of this next bar.
If the next bar's Low is higher than LastLow, then the trend may become Up starting from this bar. The following conditions are checked at this point:
1. If the Reversal Amount for Calculation Mode 2,3 Input value has been exceeded by the difference between the High of the next bar and the LastLow, and the number of bars since the LastLow for the Down trend line equals or exceeds the Number of Bars Required for Reversal study Input, the Trend is changed to Up and new Zig Zag Up trend line is started. The High of the bar that changed the direction is stored as the LastHigh.
2. If the above condition has not been met and the next bar's High is higher than the high of the current Down trend line, then trend is changed to Up immediately, without waiting for Number of Bars Required for Reversal to be satisfied.
To gain an understanding of the above description, it is recommended to Replay the chart to see the formation of the Zig Zag lines as the chart bars are built.
In the case of when using any type of Renko bars, make sure you are understanding for each chart bar what are the actual High and Low values when evaluating the bar data according to the explanation above, in case they are not actually visible based upon the values and the Graph Draw Type. You will need to use the Chart Values tool to determine the High and Low values for each chart bar. This is essential in order to make sure you are not being misled by making an assumption about what the High and Low Values are.
Text Labels Subgraph Description
The Text Labels study Subgraph contains numeric values representing the text labels describing the peaks and valleys of the Zig Zag lines, at the chart bars where these peaks and valleys occur. This Subgraph is only set with these numeric values when the Display HH,HL,LL,LH Labels Input is set to Yes.
Definitions:
- LH (Lower High) = 1
- HH (Higher High) = 2
- HL (Higher Low) = 3
- LL (Lower Low) = 4
- (no text label) = 10. This value is used when the Zig Zag study resets at the start of the day. It is used at the initial Zig Zag point.
- (no text label) = 11. This value is used when the Zig Zag study resets at the start of the day. It is used at the end of the first Zig Zag line for the trading day when it is sloping down (low).
- (no text label) = 12. This value is used when the Zig Zag study resets at the start of the day. It is used at the end of the first Zig Zag line for the trading day when it is sloping up (high).
When viewing this column of data on a Spreadsheet when using one of the Spreadsheet studies, you can can see the actual high or low value by looking at the cell at the same row to the left in the Zig Zag column.
To change the text size for the Zig Zag labels, go to the Subgraphs tab of the Study Settings window. Select the Text Labels Subgraph. Change the Size setting.
Set it to 0 to make the size automatic and the same as the Chart Text Font size. The font face for Zig Zag labels is the same as the Drawing Tools Font.
The study Subgraph containing the Text Labels can be programmatically accessed using ACSIL. This is Subgraph 2. The zero-based Subgraph index in this case will be 1. Using this Subgraph data in your study function is useful to know exactly where a Zig Zag line changes direction. For instructions, refer to Using or Referencing Study/Indicator Data in an ACSIL Function.
This Subgraph can also be referenced by Simple Alert Formulas. In this case it would be referenced as SG2 in the formula.
Zig Zag Reverses at Wrong Bar
In the case of a chart bar where it creates a new low or new high for the current Zig Zag line and also triggers a reversal to start a new Zig Zag line, there can be a difference between the bar where the Zig Zag line reverses direction at, between real-time updating of a chart and when a chart is fully recalculated like when selecting Chart >> Recalculate or modifying Study Settings.
This is inherently just a limitation of the study working with complete chart bars because the Zig Zag study does not know how the chart bar formed within during a full recalculation whereas it can during real-time updating.
The solution to this is to set the Calculate New Values on Bar Close Input to Yes.
Displaying the Zig Zag Mid-Point
To display the the Mid-Point Subgraph line with the Zig Zag study, go to the Subgraphs tab of the Study Settings window. Set the Draw Style for the Zig Zag Mid-Point Subgraph to Line instead of Ignore.
This Zig Zag Mid-Point line is also outputted to a Sheet when using the Spreadsheet study.
Displaying the Zig Zag Oscillator
The Zig Zag oscillator can be displayed. The Zig Zag oscillator at each chart bar is the difference between the most recent Zig Zag line endpoint, relative to a particular chart bar and the close/last price of that same bar. Therefore, this is the Zig Zag line length at each chart bar.
Follow the instructions below to display the Zig Zag Oscillator.
- Add the Zig Zag study to the chart following the Adding/Modifying Studies documentation.
- Open the Study Settings window for the study and select the Subgraphs tab.
- Set the Subgraph >> Zig Zag >> Draw Style to Ignore.
- Set the Subgraph >> Zig Zag Oscillator >> Draw Style to Bar.
- Select the Settings and Inputs tab.
- Set the Chart Region to 2.
- Press OK.
- Press OK.
Zig Zag Reversal Alert
To receive an alert when the Zig Zag study changes direction and displays a new label, follow the instructions below.
- Open the Study Settings window for the Zig Zag study already added to the chart.
- On the Settings and Inputs tab, set the Display HH,HL,LL,LH Labels Input to Yes.
- On the Alerts tab in the Alert Condition box enter the following formula: SG2 > 0. For further information, refer to Study/Chart Alerts And Scanning.
- Press OK.
Inputs
Input Data for High
Input Data for High. This Input applies to all Calculation Modes. The default is High. It sets the data array to use for the High values in the calculation.
In the case of when the Zig Zag study is used on the main price graph and not based on any other study, this must be set to High. Otherwise, when a chart is fully recalculated, there may be different results compared to real-time updating because if you are not using a value which stays the same or goes higher when a bar is being formed but instead sometimes goes lower, then you will get an unstable result.
These different results with the calculations can also become apparent when Sierra_Chart is downloading historical data compared to a full recalculation.
The solution to the above is to set Calculate New Values on Bar Close Input Yes.
Input Data for Low
Input Data for Low. This Input applies to all Calculation Modes. The default is Low. It sets the data array to use for the Low values in the calculation.
In the case of when the Zig Zag study is used on the main price graph and not based on any other study, this must be set to Low. Otherwise, when a chart is fully recalculated, there may be different results compared to real-time updating because if you are not using a value which stays the same or goes lower when a bar is being formed but instead sometimes goes higher, then you will get an unstable result.
These different results with the calculations can also become apparent when Sierra_Chart is downloading historical data compared to a full recalculation.
The solution to the above is to set Calculate New Values on Bar Close Input Yes.
Calculation Mode (1,2,3)
This Input selects the calculation mode. The calculation modes are described above.
Reversal % for Calculation Mode 1
The percentage change of the price values that must occur to begin a new Zig Zag line when using Calculation Mode 1.
Reversal Value for Calculation Mode 2 and 3
The price change of the price values that must occur to begin a new Zig Zag line when using Calculation Mode 3.
Number of Bars Required for Reversal (Calculation Mode 2)
Refer to the Zig Zag Calculation Mode 2 description above.
Volume To Accumulate
When this set to a setting other than None, the volume across each Zig Zag line is calculated using one of the below formulas:
- None: No volume is calculated.
- Total Volume: The total volume for the Zig Zag line is calculated.
- Bid Volume: Only the total Bid Volume for the Zig Zag line is calculated.
- Ask Volume: Only the total Ask Volume for the Zig Zag line is calculated.
- Ask Bid Volume Difference: The difference between Ask Volume and Bid Volume at each chart bar the Zig Zag line spans across is calculated.
Reset Zig Zag at Start of Trading Day
When this Input is set to Yes, then the Zig Zag is reset at the start of the trading day.
The start of the trading day is determined from the Session Times in Chart >> Chart Settings. This will be the Start Time, or if the Evening Session option is enabled, then it will be the Evening Start Time.
Note: When enabling this option, changing the Draw Style from Line to Line - Skip Zeros will remove the plots from the final swing of a trading day to the first swing of the next trading day. So this is something you may want to do.
When Reset Zig Zag at Start of Trading Day is set to Yes, at the start of the trading day, there will not be any labels displayed. And at the first reversal, there will not be any HH,HL,LL,LH Labels.
Calculate New Values on Bar Close
When this Input is set to Yes, the Zig Zag study will always ignore the last bar in the chart and only perform calculations on the completed chart bars.
It is useful to set this to Yes if you have set Input Data for High/Low both to Last.
Additional Output for Spreadsheets
When this Input is set to Yes, then there are additional columns of data outputted for the Zig Zag study to the Spreadsheet Sheet being used by one of the Spreadsheet Studies if you have applied one of the Spreadsheet Studies to the chart. The data is outputted beginning and column AA in the Sheet.
The additional Subgraphs outputted to the Sheet used by the Spreadsheet Study include the following: Reversal Price, Zig Zag Line Length, Zig Zag Number of Bars. The Zig Zag Line Length Subgraph only has a value at each Zig Zag line end point. Therefore, it may also be helpful to set the Display HH,HL,LL,LH Labels Input to Yes to also have the corresponding HH,HL,LL,LH label value.
The default Draw Style for each of these study Subgraphs is set to Ignore. Therefore, to see them on the Spreadsheet Sheet, make sure the Do Not Output Subgraphs Set to Ignore Input with the Spreadsheet Study is set to No.
If this Input is set to Yes, but the data is still not being displayed in the Spreadsheet, then ensure that the option for Include in Spreadsheet is enabled for each Subgraph on the Subgraph tab of the Study window.
Display HH,HL,LL,LH Labels
When this Input is set to Yes, then HH (Higher High), LH (Lower High), LL (Lower Low), HL (Higher Low) labels will be displayed. The colors of these labels is controlled with the Text Labels (SG2) Subgraph Primary and Secondary color settings. The font size is controlled with the Text Labels Subgraph Size setting.
Display Reversal Price
When this Input is set to Yes, then at each bar where the Zig Zag line reverses direction, the price value of the High or Low of the bar the Zig Zag lines are drawn to, is displayed. This price value is not the actual reversal price trigger which caused the line to reverse.
Display Length of Zig Zag Line
When this Input is set to a value other than None, the price difference between the endpoints of each Zig Zag line will be displayed at the Zig Zag endpoints in the specified value.
The options are:
- Points: This displays the length of the Zig Zag line in points (actual numerical difference).
- Ticks: This displays the length of the Zig Zag line in ticks (based on the Tick Size setting for the chart).
- Percent: This displayes the length of the Zig Zag line as a percent difference using the most recent value as the denominator.
Display Zig Zag Volume
When this Input is set to Yes, the volume for the Zig Zag line as calculated according to the Volume To Accumulate Input and is displayed at each Peak or Valley of the Zig Zag line.
Format Volume Using Large Number Suffix
When this Input is set to Yes, the volume displayed at the Peak or Valley is displayed in units of 1000. For example, if the Total Volume is accumulated and has a value of 28,872, this would be displayed as 28.8K.
Display Time Labels
When this Input is set to Yes, labels indicating the time of the Zig Zag line endpoints will be displayed at the Zig Zag endpoints.
Include Seconds in Time Display
When this input is set to Yes and the Display Time Labels is also set to Yes then the time displayed includes seconds.
Display Zig Zag Time Duration
When this Input is set to Yes the duration of time over which the Zig Zag segment covers is displayed at the Peak or Valley. The duration is prefaced with the display D:.
Display Zig Zag Number of Bars
When this Input is set to Yes the number of bars over which the Zig Zag segment covers is displayed at the Peak or Valley. The Number of Bars is prefaced with the display B:
Display ZigZag Volume / Length in Ticks
When this Input is set to Yes, the Volume / Length in Ticks is calculated according to the Volume to Accumulate Input and is displayed at each Peak or Valley of the Zig Zag line. This information is prefaced with the label V/L:, unless the Omit Label Prefixes is set to Yes.
Use Multi-line Labels
When this Input is set to Yes each of the labels that is displayed at the Peak or Valley is displayed on individual lines.
Omit Label Prefixes
When this Input is set to Yes the label designations are not displayed.
Text Label Offset Specified As
This defines what value type is used for the Text Label Offset. The following options are available:
- Percentage of Bar: The Text Label Offset is the percentage of the bar height away from the high or low of the bar.
- Tick Offset: The Text Label Offset is the number of ticks away from the high or low of the bar.
Text Label Offset
This is the value represented by the Text Label Offset Specified As that you want to offset the text labels from the bar highs or lows.
Color Zig Zag Line Using
The Zig Zag Subgraph can be colored based on one of the following settings:
- Slope: When the Zig Zag line has positive slope it is colored with the primary color. Otherwise, it is colored with the secondary color when the Zig Zag line has negative slope.
- Trend Confirmed Volume: In this mode, a Zig Zag line trend is based on the prior Zig Zag line trend, the current Zig Zag line trend, the accumulated volume of the current Zig Zag line, and the accumulated volume of the previous Zig Zag line.
The Zig Zag Subgraph coloring starts with the primary color when the trend is up, and the secondary color when the trend is down. If the current Zig Zag line has less than or equal accumulated volume than the prior Zig Zag line, and the prior Zig Zag line has an opposite trend than the current Zig Zag line, then the coloring for the current Zig Zag line is changed to the opposite color. For example, an up sloping Zig Zag line has lower accumulated volume than the previous Zig Zag line and the previous Zig Zag line is down sloping, therefore the current Zig Zag line is colored the down (Secondary) color. If either the accumulated volume is not lower, or the previous Zig Zag line trend is not opposing, then the coloring will not be changed. - Confirmed Volume: In this mode, a Zig Zag line trend is based on the current Zig Zag line trend, the accumulated volume of the current line and the accumulated volume of the previous line.
The Zig Zag Subgraph coloring starts with the primary color when the trend is up, and the secondary color when the trend is down. When the current Zig Zag line has less than or equal accumulated volume than the prior Zig Zag Line, then the coloring of the current Zig Zag line is changed to the opposite color. For example: a down sloping Zig Zag line has lower accumulated volume than the previous Zig Zag line, therefore it is colored the up (Primary) color. If the accumulated volume for a Zig Zag line is greater than the previous Zig Zag line, then the coloring is not changed.
Extend End Points Until Future Intersection
When this Input is set to Yes, for each Zig Zag line end point where the Zig Zag line reverses, it will have an extension line drawn at that price level which extends until it intersects with future prices.
Display Value Label for Extension Lines
When this Input is set to Yes the Value Label (price) is displayed for each of the Extension Lines. The Value Label is displayed in the Chart Scales for the Extension Lines that do not intersect a bar, and are displayed at the end of the line for those Extension Lines that do intersect a bar.
If the option Extend End Points Until Future Intersection is set to No then no Value Labels are displayed.
Single Line Horizontal Text Alignment
This Input controls the horizontal alignment of the displayed text when the Input for Use Multi-Line Labels is set to No. The available options are:
- Left: This sets the left side of the text at the Zig Zag point with which it is associated.
- Center: This sets the center of the text at the Zig Zag point with which it is associated.
- Right: This sets the right side of the text at the Zig Zag point with which it is associated.
Multi-Line Horizontal Text Alignment
This Input controls the horizontal alignemtn of the displayed text when the Input for Use Multi-Line Labels is set to Yes. The available options are:
- Left: This sets the left edge of the text at the Zig Zag point with which it is associated.
- Center: This sets the center of the text at the Zig Zag point with which it is associated.
- Right: This sets the right edge of the text at the Zig Zag point with which it is associated.
*Last modified Monday, 03rd October, 2022.