Status Bar
Introduction
The Status Bar displays Data and Trading server connection status and can be optionally located on any of the Control Bars.
A Control Bar can be set to be displayed on a floating Chart or Spreadsheet window or the Sierra Chart main application window.
The Status Bar can be added through Global Settings >> Customize Control Bars >> Control Bar # >> Available Control Bar Commands >> Special Items.
The colors are controlled through the Graphics Settings.
Description
The connection status on the Status Bar displays multiple information.
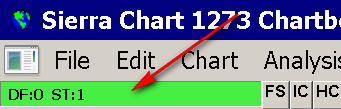
The background color of the Status Bar, indicates the connection status. By default, red indicates no connection to the primary Data/Trading service, yellow indicates the process of connecting, and green indicates current connection.
Many of the supported Data Feeds used by Sierra Chart use connections in the background. When those connections are active or have been lost, this does not change the Status Bar color. The connection status in this case can only be viewed through the Window >> Message Log. There are messages added to the log indicating a connection to a data feed, lost connections and successful connections.
DF: When connected to the data feed, the number after this text is the sequence number of the latest message received from the data feed. If there is a comma after the first number followed by another number, then this is the number of messages lost.
ST: (first number) The first number after this text is the number of symbols being tracked by Sierra Chart. For information about how to reduce the number of symbols being tracked, refer to Reducing Number of Symbols Being Tracked by Sierra Chart.
In the case of when using sub instances started with File >> New Instance, the ST: number also includes symbols tracked by sub instances as well.
ST: (, second number) Depending upon the particular Data or Trading service being used, there may be a second number displayed after a comma character after ST:. This indicates the number of symbols that are placed into a fast lookup map for higher performance market data processing. This is for when Sierra Chart is used in market data processing applications where Sierra Chart is tracking a large number of symbols.
DL: This is the number of historical data downloads which are outstanding. This includes both historical Daily and historical Intraday chart downloads.
When you are looking at the number of symbols being tracked when using either of the Real-Time Exchange Data Feeds Available from Sierra Chart, you need to be aware that symbols that do not come from these data feeds are included in the ST: count. For example, cash Forex symbols are included in this count but do not go towards the symbol limit for the Sierra Chart Data Feeds.
Disabling Detect Rollover of Current Futures Contract Symbols Based on Real Time Volume will also reduce the number of symbols being tracked.
BR: For some of the supported Data and Trading services, this indicates the bytes received in bytes (B), kilobytes (K), megabytes (M), or gigabytes(G) from the data feed on the current connection. This gives you an indication of the amount of data received. This value does not include historical price data which has been downloaded.
When Sierra Chart begins to track a symbol, it will continue to do so until you disconnect from the data feed by selecting File >> Disconnect on the menu, even if you close the chart or Quote Board or Quote Spreadsheet which contains the symbol.
For further information, refer to Reducing Number of Symbols Being Tracked by Sierra Chart.
The font size of the text in the Status Bar can be adjusted with Global Settings >> Graphics Settings >> Fonts >> Text Windows.
The overall size of the Status Bar is controlled with the Status Bar Width In Characters setting.
*Last modified Monday, 03rd April, 2023.