Sierra Chart - Image Gallery
This is the public chart image gallery. To share a chart image, select Edit >> Screen Images >> Upload Chart on the Sierra Chart menu to upload a chart. Select Help >> Account Management. Click on Manage Images. Locate the chart image among the images you have uploaded. Add a note to it if you wish. And click on Share Image in the Public Image Gallery. That's it!
Available Pages
View Image | View Image with the note
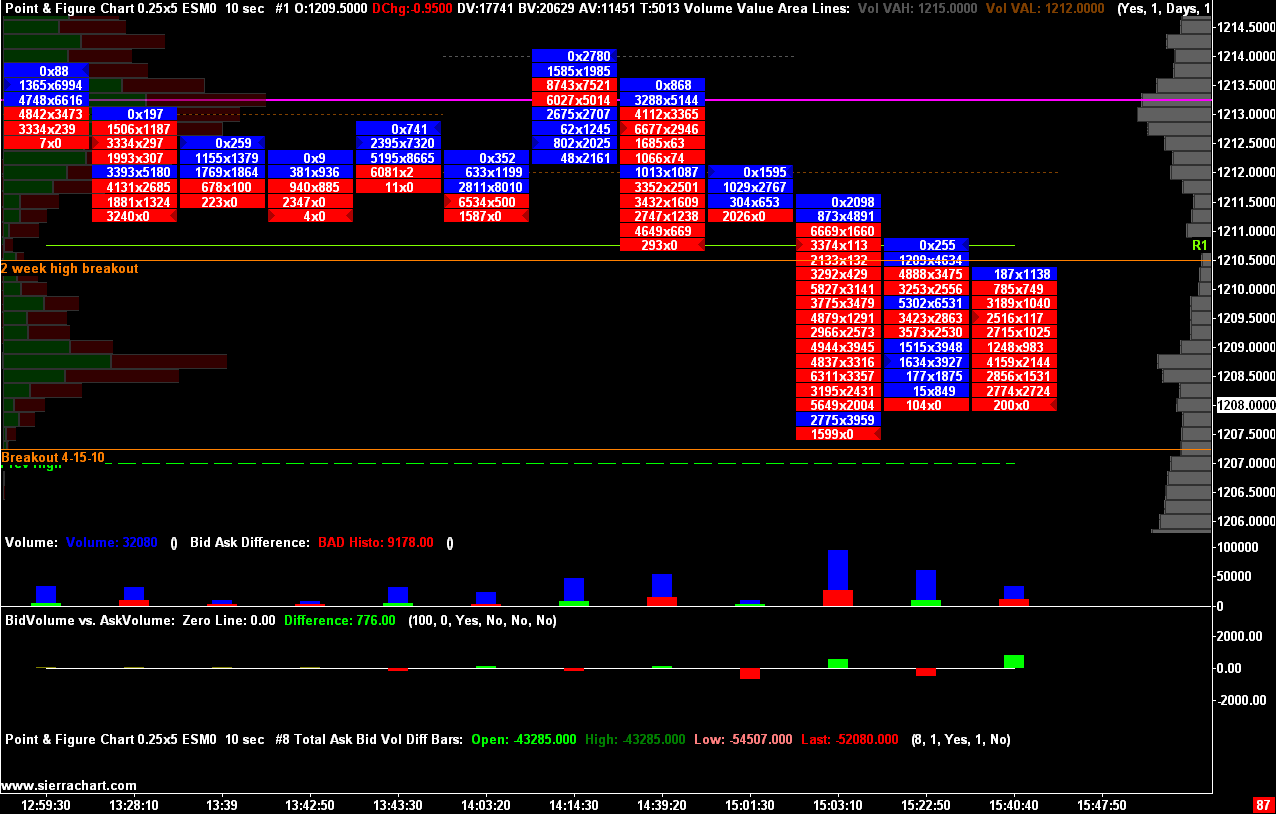
Image Uploaded on 2010-04-26 using SC version 593 by WarriorTrader Note: Point & Figure number bars, volume, bid/ask delta, bid/ask delta with 100 lot filter, two volume by price studies |
View Image | View Image with the note
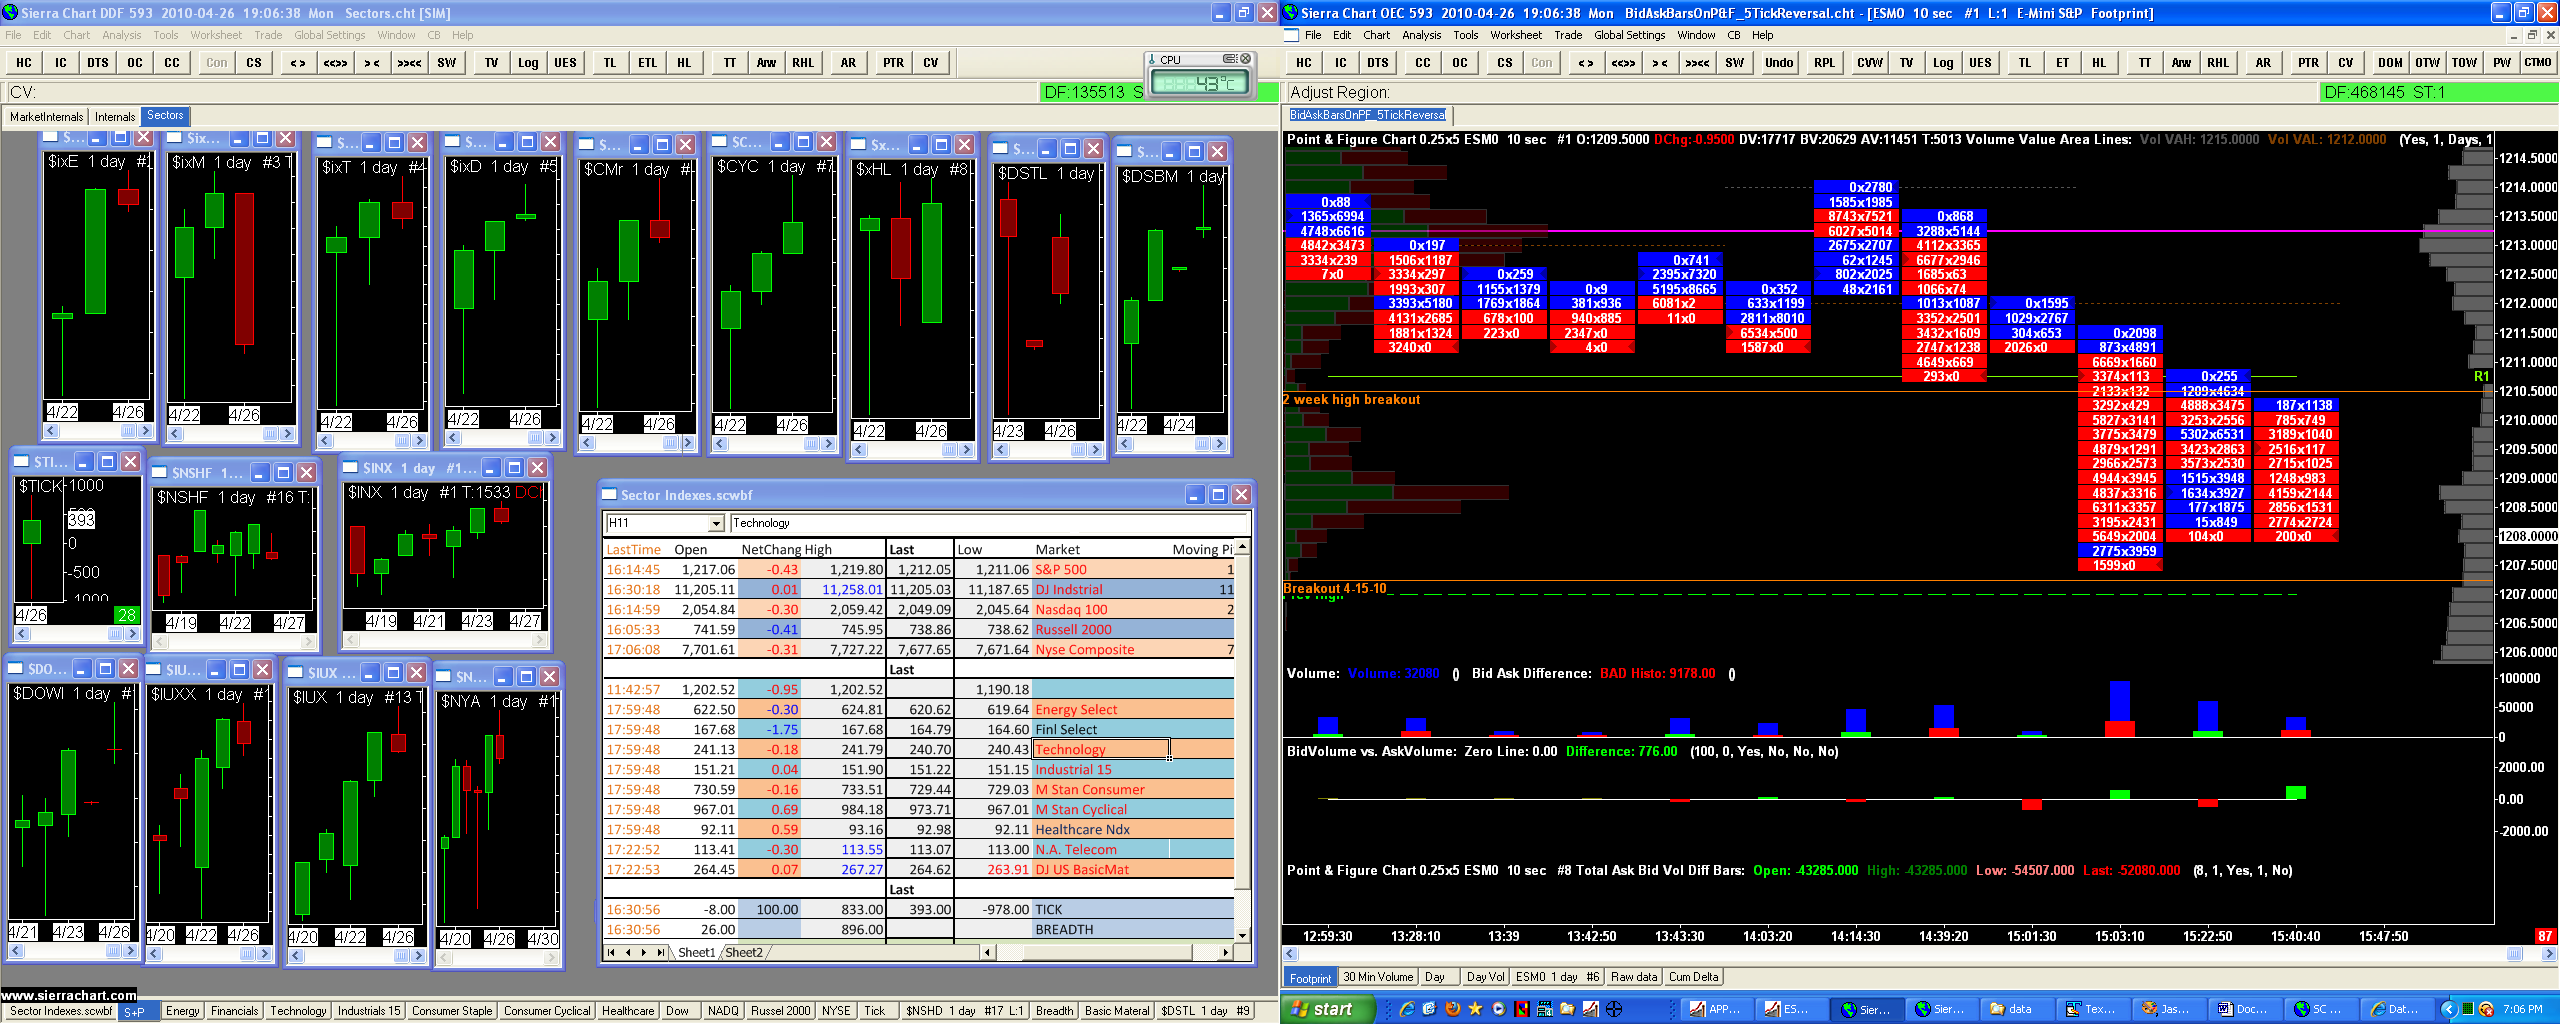
Image Uploaded on 2010-04-26 using SC version 593 by WarriorTrader Note: Day candle sticks of stock sectors. |
View Image | View Image with the note
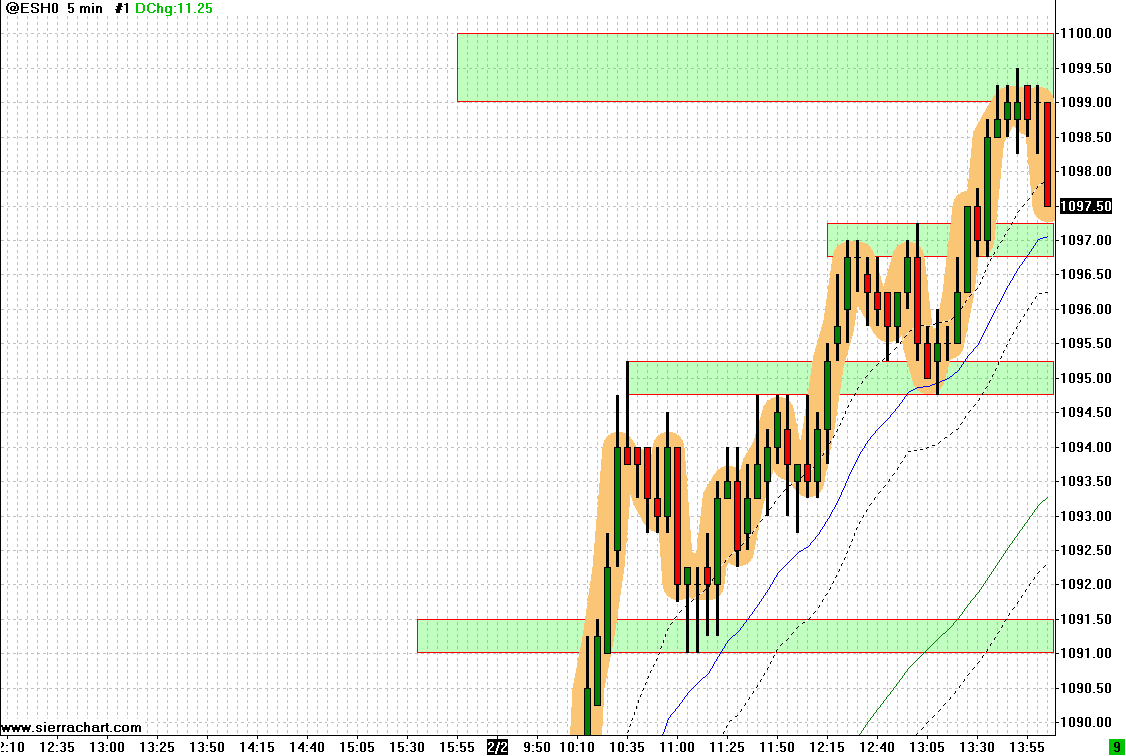
Image Uploaded on 2010-02-02 using SC version 568 |
View Image | View Image with the note
Image Uploaded on 2009-12-27 using SC version 551 |
View Image | View Image with the note
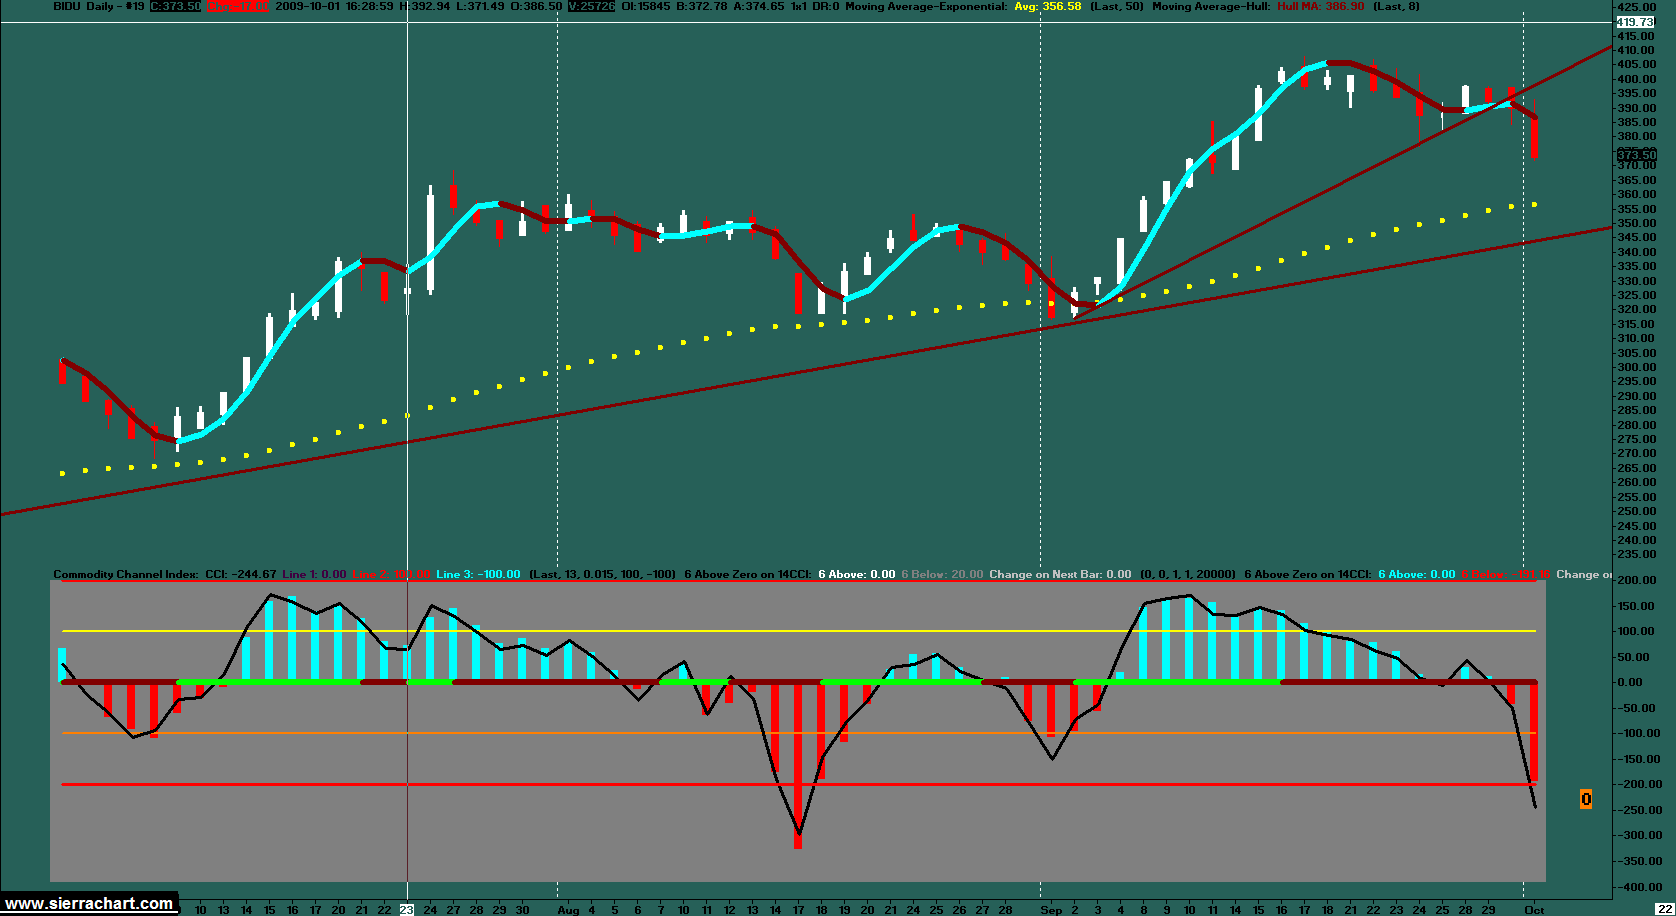
Image Uploaded on 2009-10-01 using SC version 496 by Hanksterr Note: This is Bidu. Broke trendline. Next target is 360. |
View Image | View Image with the note
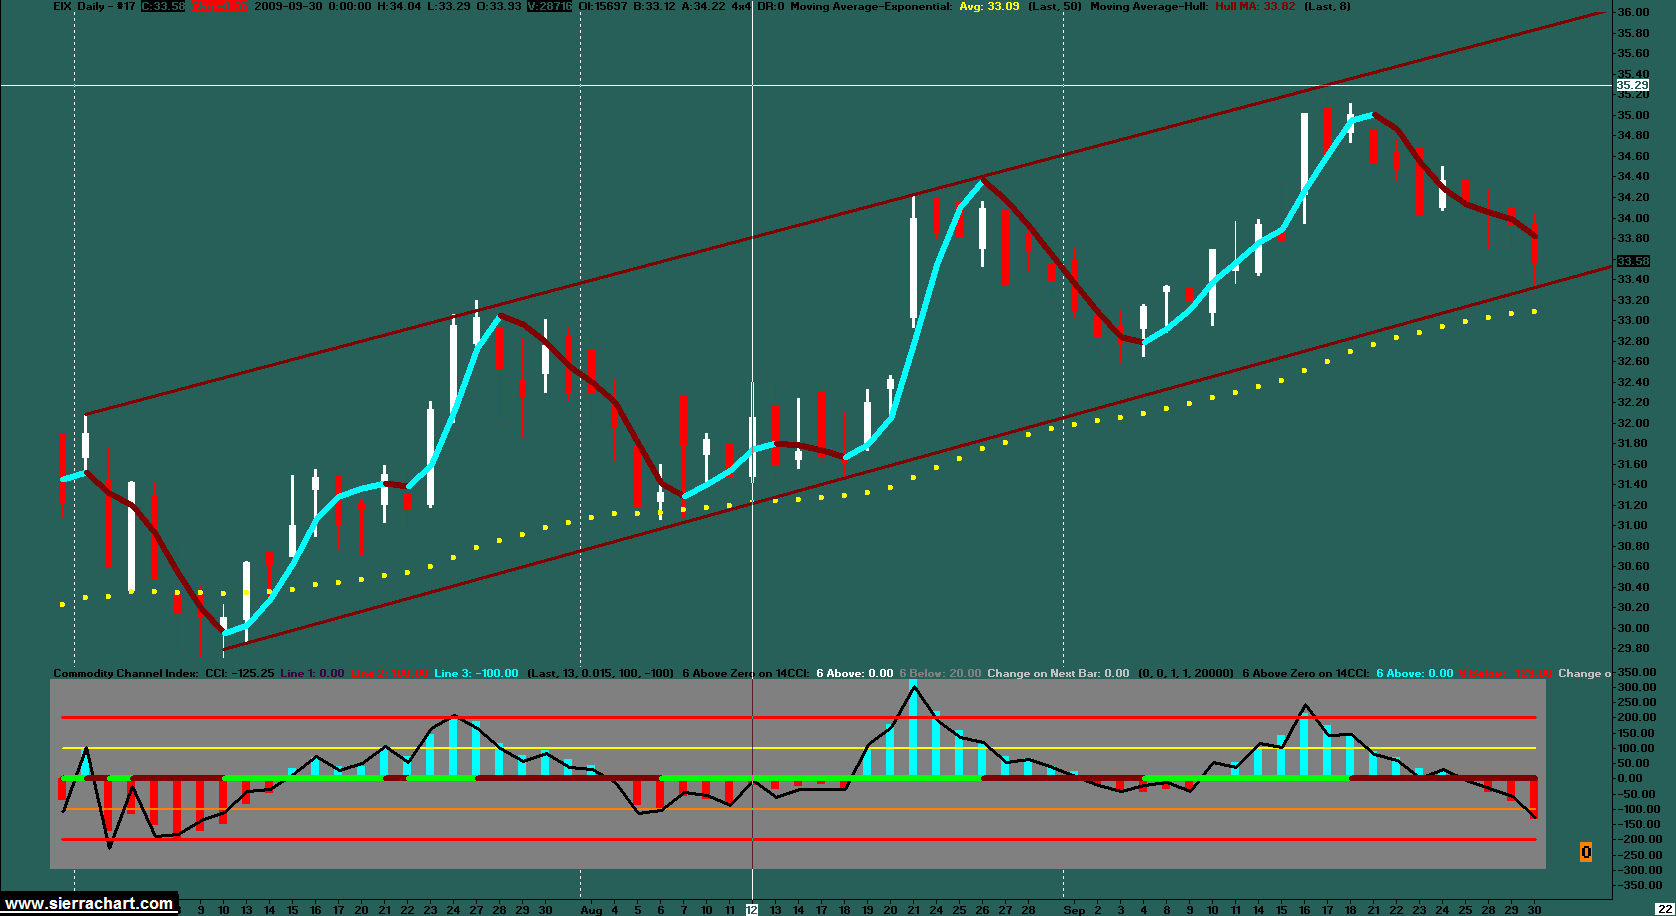
Image Uploaded on 2009-10-01 using SC version 496 by Hanksterr Note: EIX, Edison International Nice rolling channel. |
View Image | View Image with the note
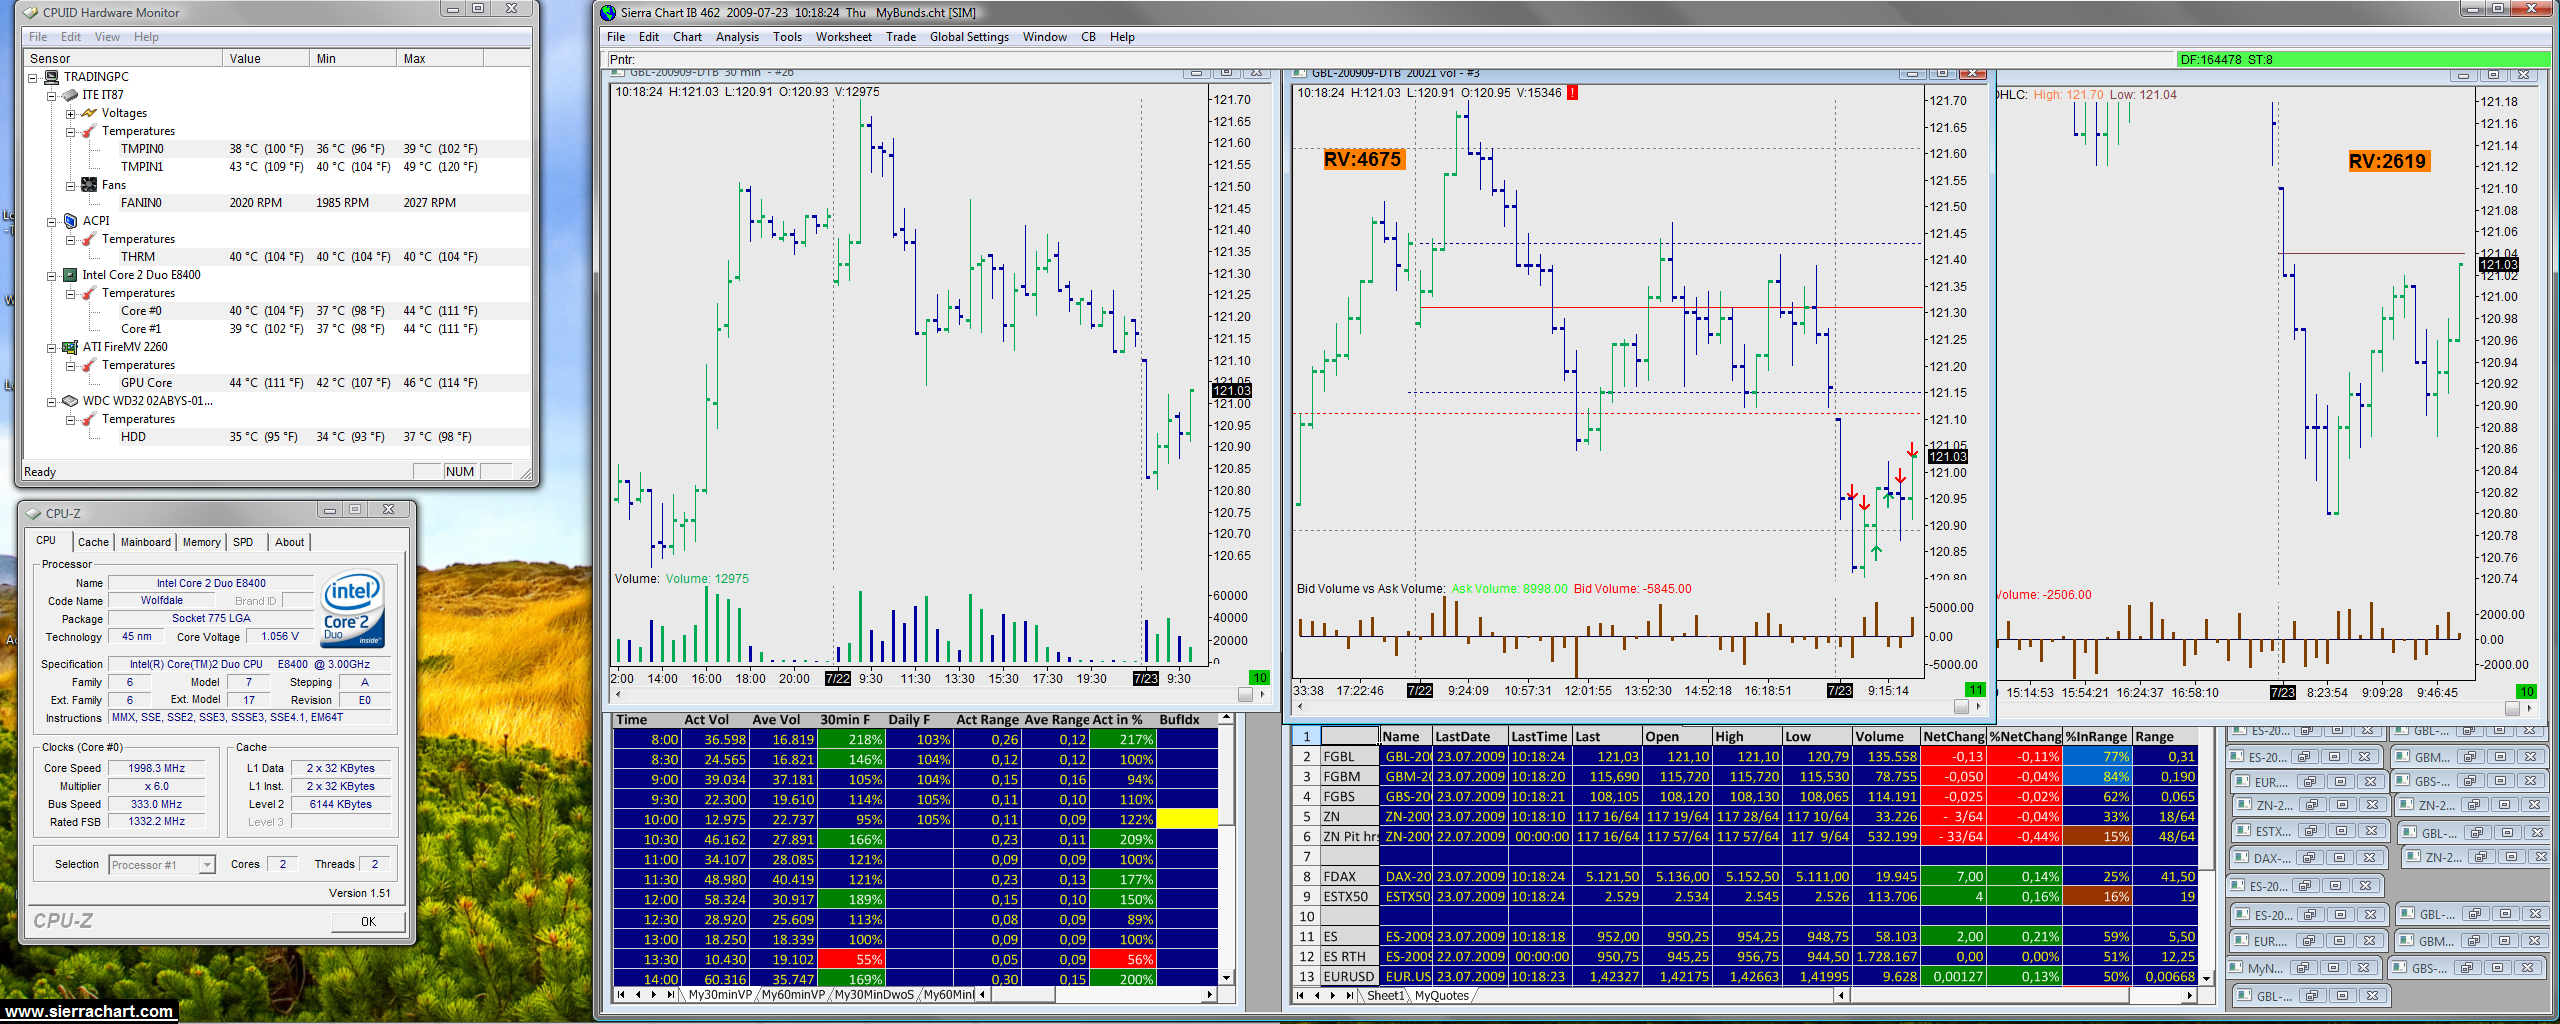
Image Uploaded on 2009-07-23 using SC version 462 by staylor Note: The leftmost chart is a 30-minute chart, below a 30-minute Volume Profile. The middle chart is a 20000-something volume bar chart, the right one a 8000-something volume bar chart. Both charts have the bid vs. ask volume study added. Below them is a quote board with some adjustements, not quite the standard fields. There is a plethora of other charts, but they are not used very often. |
View Image | View Image with the note

Image Uploaded on 2009-07-20 using SC version 470 Note: YM - 3 Min with Heikin Ashi Bars, KUMO Cloud, Moving Average, Daily Pivots and Proprietary Oscillator in the bottom panel. |
View Image | View Image with the note
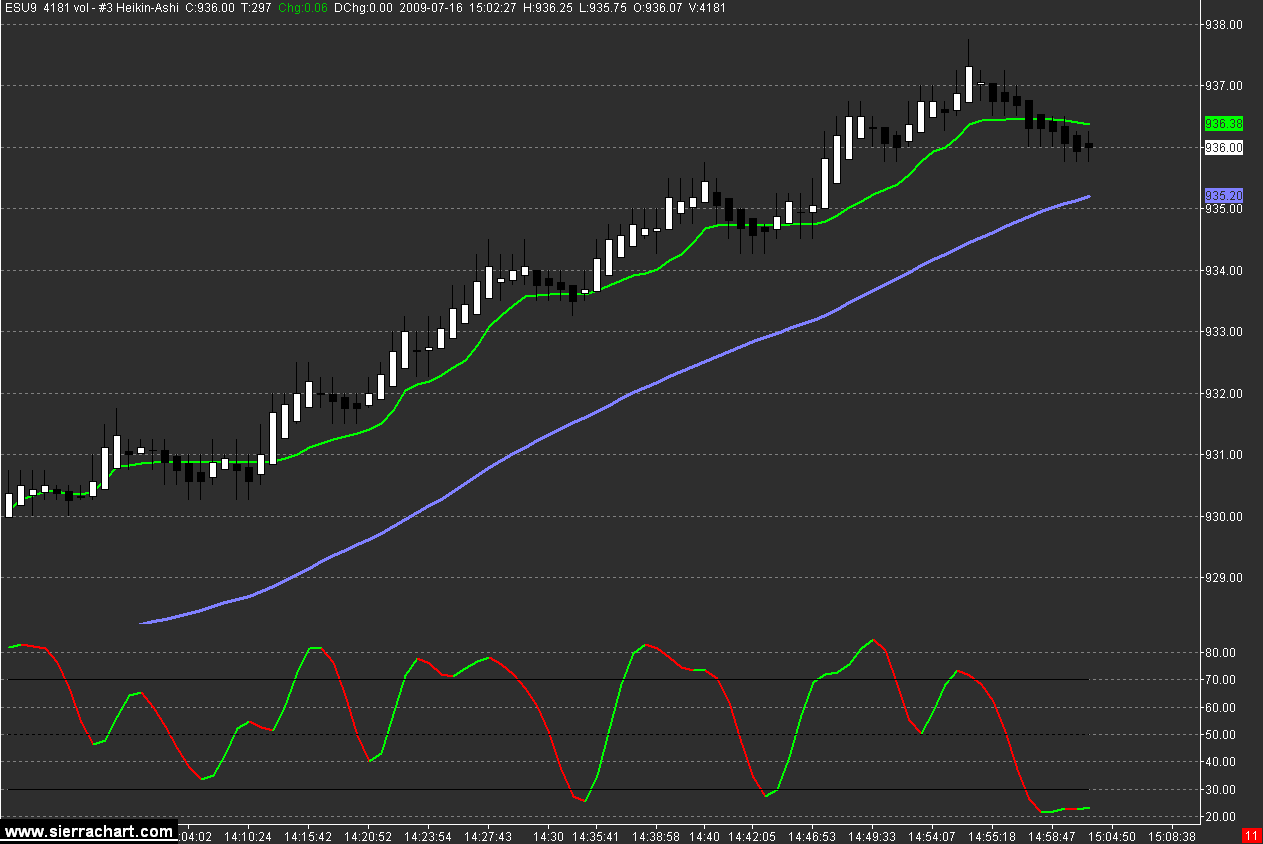
Image Uploaded on 2009-07-19 using SC version 464 Note: ES 4181Vol Heikin-Ashi 13MA-Adaptive 56MA-Simple Slow Stoch |
View Image | View Image with the note
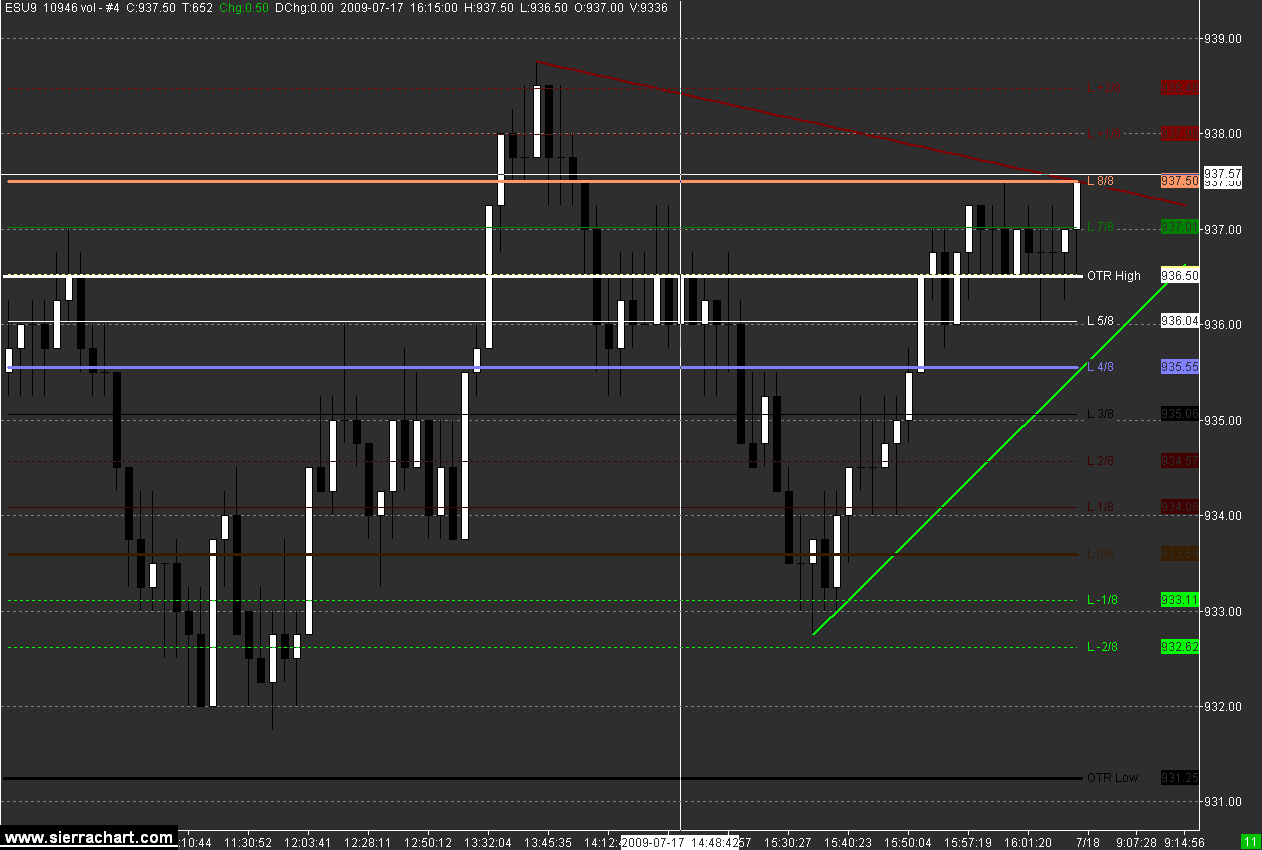
Image Uploaded on 2009-07-19 using SC version 464 Note: ES 10946Vol with Murray Math and Auto Trend Lines |
*Last modified Wednesday, 22nd February, 2023.