Home >> (Table of Contents) Help/Frequently Asked Questions >> Help topic 71: Cumulative AskVolume and BidVolume Difference Bars (Cumulative Delta)
Cumulative AskVolume and BidVolume Difference Bars (Cumulative Delta)
Introduction

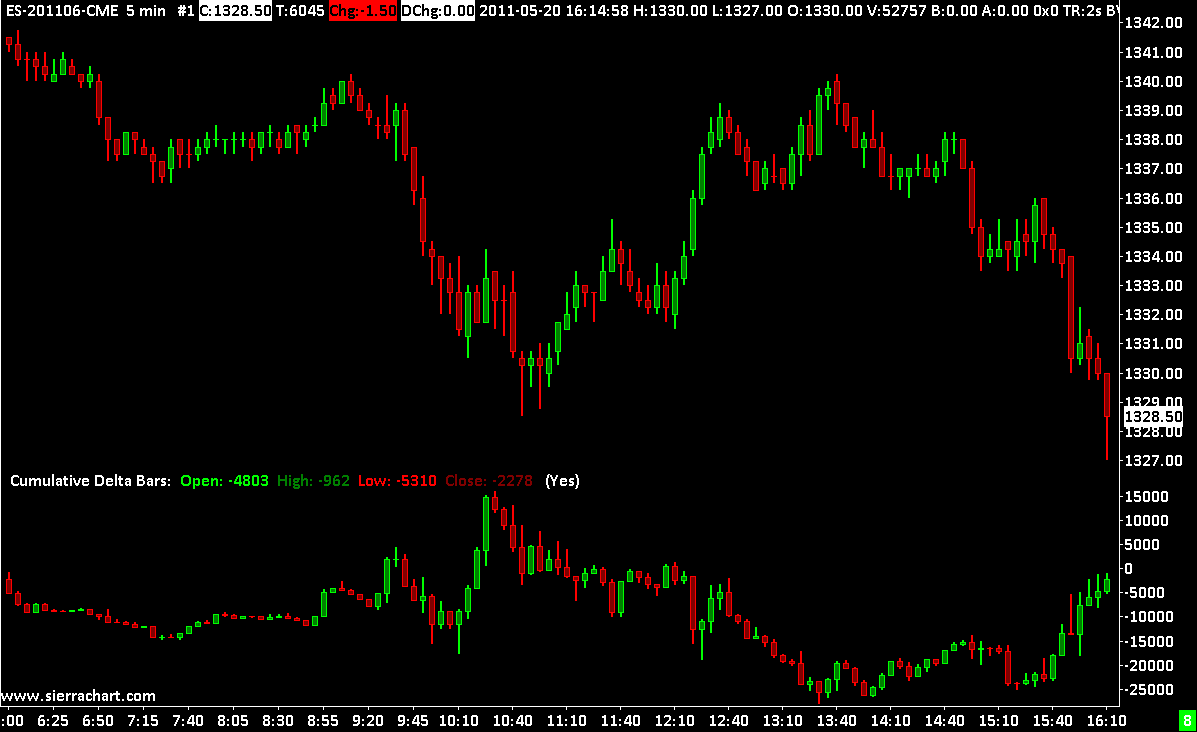
Sierra Chart provides the Cumulative Delta Bars - Volume study. This is the cumulative sum, over the data in the chart or the trading day, of the difference between the Ask Volume and the Bid Volume, displayed as High-Low CandleStick bars.
This is commonly known as Cumulative Delta in many trading forums on the Internet.
This study requires data from a Data or Trading service that provides historical BidVolume and AskVolume. Otherwise, the study will not display anything or contain incomplete data. Sierra Chart will always store BidVolume and AskVolume from real-time data received when using any of the supported Data and Trading services. However, you may not have it historically with the service you are using.
Instructions
- Open or go to an Intraday Chart.
- Select Analysis >> Studies.
- In the Studies Available list box (left side) locate and add the Cumulative Delta Bars - Volume study.
- You will also see the Cumulative Delta Bars - Ticks study listed. This one is based upon the number of trades at the Ask price and the number of trades at the Bid price. Rather than the volume.
- Press the Settings button.
- If you want the study to reset at the start of a trading day, then set the Reset at Start or Trading Day input to Yes.
- Press OK, and press OK.
*Last modified Wednesday, 22nd February, 2023.
