Sierra Chart Image
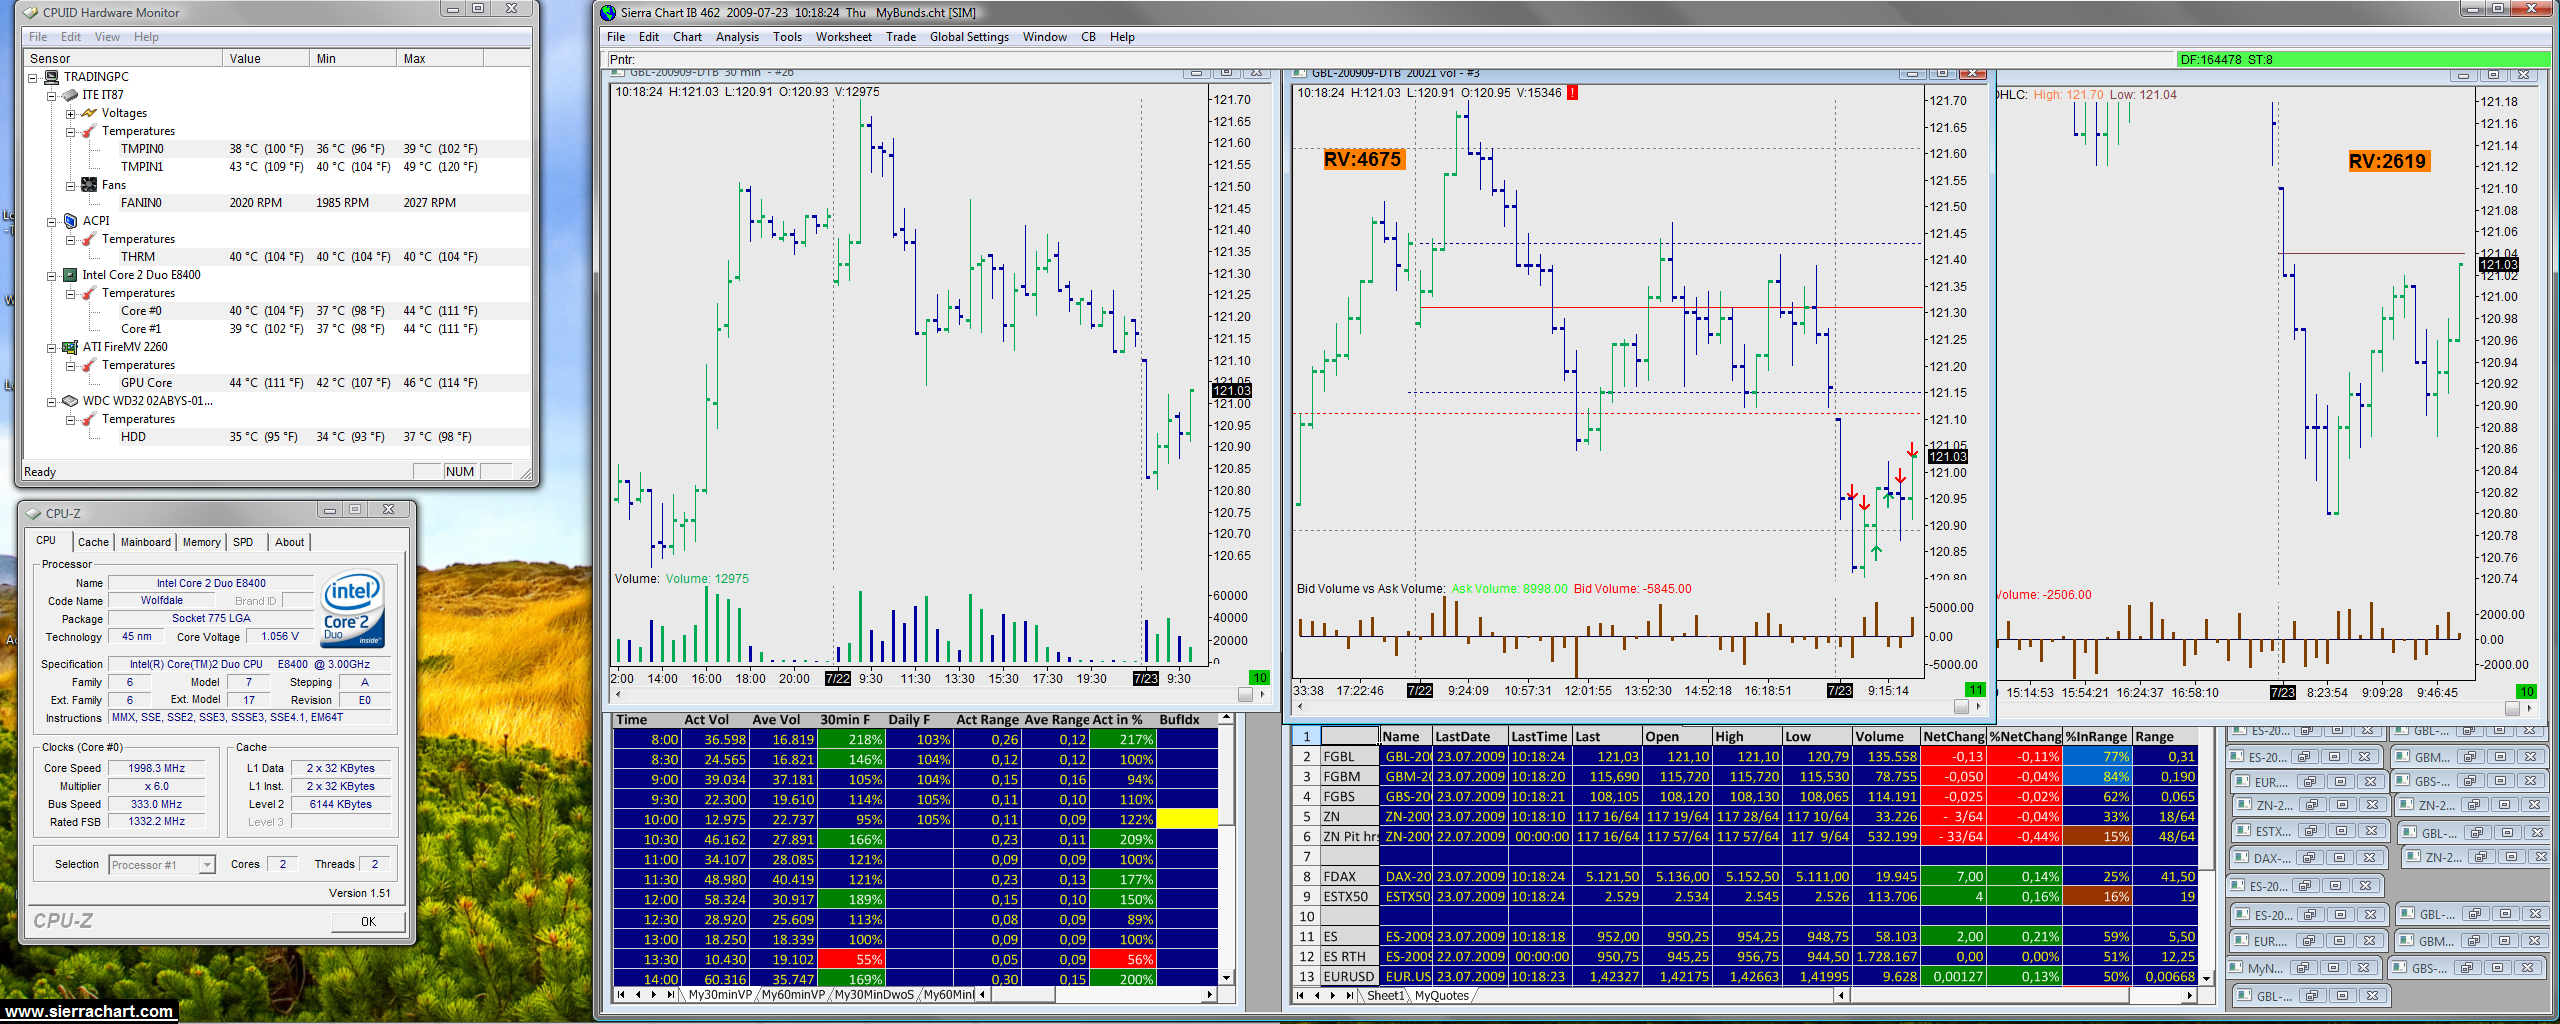
Image Uploaded on 2009-07-23 by staylor using 462 The leftmost chart is a 30-minute chart, below a 30-minute Volume Profile. The middle chart is a 20000-something volume bar chart, the right one a 8000-something volume bar chart. Both charts have the bid vs. ask volume study added. Below them is a quote board with some adjustements, not quite the standard fields. There is a plethora of other charts, but they are not used very often. |